

Presynaptic cGMP sets synaptic strength in the striatum and is important for motor learning
- PMID: 35735260
- PMCID: PMC9346481
- DOI: 10.15252/embr.202154361
Presynaptic cGMP sets synaptic strength in the striatum and is important for motor learning
Abstract
The striatum is a subcortical brain region responsible for the initiation and termination of voluntary movements. Striatal spiny projection neurons receive major excitatory synaptic input from neocortex and thalamus, and cyclic nucleotides have long been known to play important roles in striatal function. Yet, the precise mechanism of action is unclear. Here, we combine optogenetic stimulation, 2-photon imaging, and genetically encoded scavengers to dissect the regulation of striatal synapses in mice. Our data show that excitatory striatal inputs are tonically depressed by phosphodiesterases (PDEs), in particular PDE1. Blocking PDE activity boosts presynaptic calcium entry and glutamate release, leading to strongly increased synaptic transmission. Although PDE1 degrades both cAMP and cGMP, we uncover that the concentration of cGMP, not cAMP, controls the gain of striatal inputs. Disturbing this gain control mechanism in vivo impairs motor skill learning in mice. The tight dependence of striatal excitatory synapses on PDE1 and cGMP offers a new perspective on the molecular mechanisms regulating striatal activity.
Keywords: cyclic nucleotides; gain control; striatum; synapse; transmitter release.
© 2022 The Authors. Published under the terms of the CC BY 4.0 license.
Figures
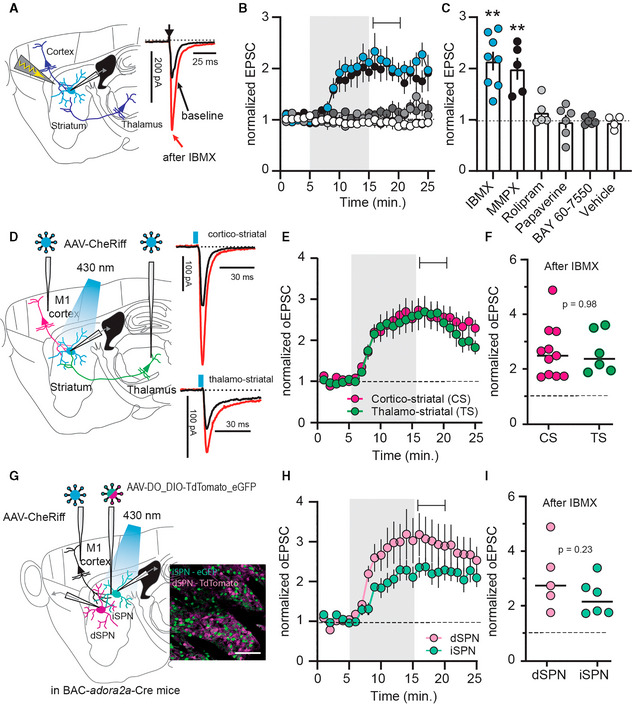
- A
Electrical stimulation of descending afferents evoked excitatory postsynaptic currents (EPSCs) in striatal spiny projection neurons (SPNs). EPSCs before (black) and after (red) application of the phosphodiesterase (PDE) inhibitor IBMX (75 μM).
- B
Normalized EPSC recordings. Shaded area indicates washin of IBMX, the PDE1 inhibitor MMPX (10 μM), the PDE4 inhibitor rolipram (1 μM), the PDE10 inhibitor papaverine (10 μM), the PDE2 inhibitor BAY 66‐7550 (2 μM) or vehicle (DMSO, 0.002%). Mean ± SEM.
- C
Averaged EPSCs during the 5‐min interval indicated in (B) ** P < 0.01, paired t‐test versus respective baseline, N = 5–8. Mean ± SEM.
- D
CheRiff was expressed in either cortical area M1 or the thalamic parafascicular nucleus (one area injected per mouse) and blue light flashes were used to evoke cortical or thalamic EPSCs. Example traces show response before (black) and after IBMX (red).
- E
Optically evoked EPSCs (oEPSCs) from cortical (magenta) or thalamic inputs (green). Shaded area is washin of IBMX. Mean ± SEM.
- F
Averaged normalized EPSCs during the interval indicated in (E). P = 0.98, unpaired t‐test, N = 11 and 6.
- G
Cortical oEPSCs recorded from GFP‐labeled, Cre‐positive indirect pathway (iSPNs), and tdTomato‐labeled Cre‐negative direct pathway SPNs (dSPNs). Scale bar 100 μm.
- H
Normalized oEPSCs in dSPNs and iSPNs. Shaded area indicates washin of IBMX. Mean ± SEM.
- I
Averaged responses during the interval marked in (H). P = 0.23, unpaired t‐test, dSPNs versus iSPNs N = 5 and 6.
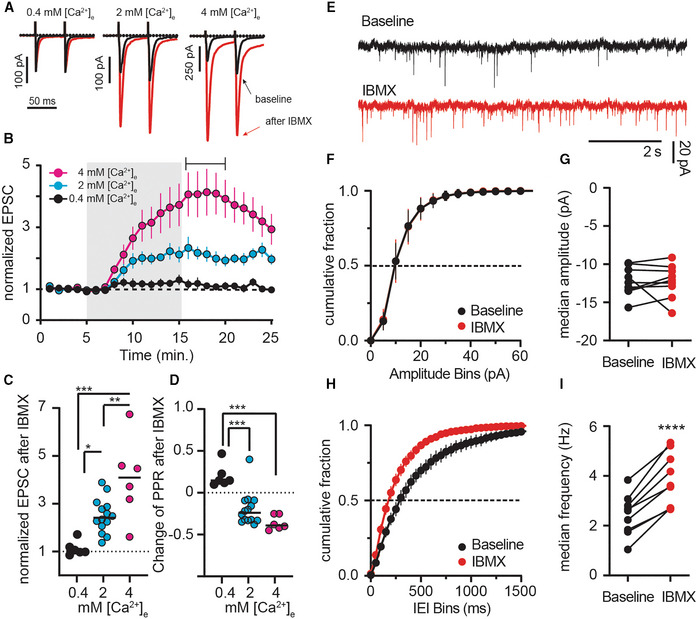
- A
Paired‐pulse EPSCs under different extracellular calcium ([Ca2+]e) conditions pre (black) and post IBMX (red).
- B
EPSC amplitude in low (0.4 mM, black), normal (2 mM, cyan, replotted from Fig 1B), and high (4 mM, magenta) [Ca2+]e. Shading indicates application of IBMX (75 μM). Mean ± SEM.
- C
Average EPSCs.
- D
Paired‐pulse ratios (PPRs) of individual recordings from time indicated in (B). *P < 0.05, **P < 0.01, ***P < 0.001, ANOVA followed by Tukey's multiple comparisons. N = 6–14.
- E
Example mEPSCs recorded in tetrodotoxin before and after IBMX.
- F
Cumulative fraction plots of mEPSC amplitude at baseline and after IBMX (75 μM, 10 min). Mean ± SEM.
- G
Comparison of the median mEPSC amplitude per cell shows no significant effect of IBMX. paired t‐test, P = 0.99, N = 9.
- H
Cumulative fraction plots of mEPSC interevent intervals (IEI) showing a left shift after IBMX. Mean ± SEM.
- I
Comparison of median event frequency shows an increase of mEPSC event frequency after IBMX. ****P < 0.0001, paired t‐test, N = 9.
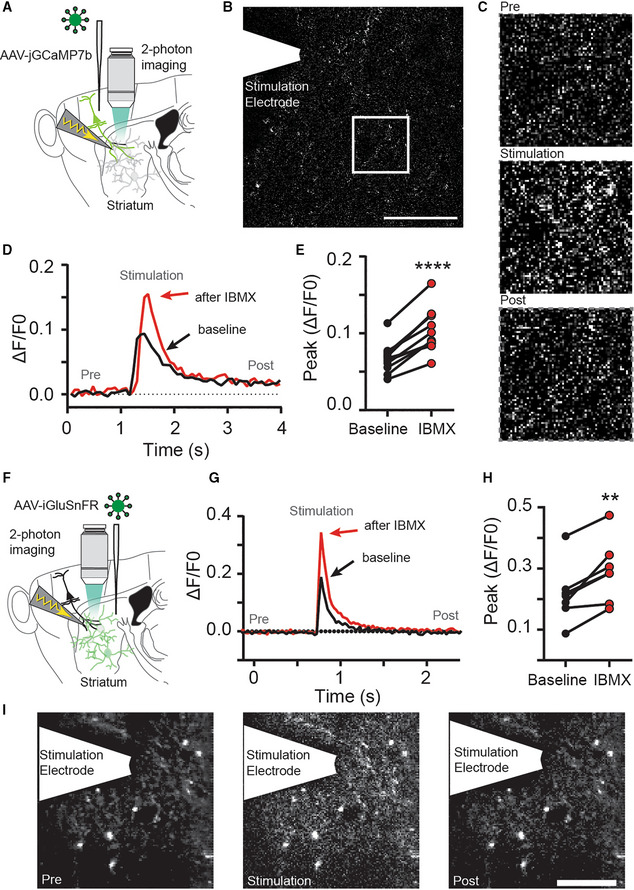
- A
The calcium sensor jGCaMP7b was expressed in cortical input neurons to the striatum and electrically evoked signals were imaged in axon terminals in the striatum using fast‐scanning 2‐photon microscopy.
- B
Full‐field image of jGCaMP7b signal in the dorsolateral striatum. Scale bar: 30 μm.
- C
Zoom in from (B) and jGCaMP7b signal before (Pre), during (Stimulation) and after (Post) electrical stimulation of afferents.
- D
Example recording of full‐field fluorescence signal, before (black) and after IBMX application (red).
- E
Blocking phosphodiesterases with IBMX (75 μM, 10 min) increases the peak Ca2+ signal detected in presynaptic terminals. ****P < 0.0001, paired t‐test. N = 11 slices (three mice).
- F
The glutamate sensor iGluSnFR was expressed in striatal neurons and electrically evoked signals were imaged using fast‐scanning 2‐photon microscopy.
- G
Example of electrically evoked signals before (black) and after IBMX (red).
- H
Peak fluorescence signal is increased after inhibition of phosphodiesterases with IBMX (75 μM, 10 min). **P < 0.01 paired t‐test, N = 7 (three mice).
- I
The striatal iGluSnFR signal before (Pre), during (Stimulation), and after (Post) electrical stimulation of afferents. Scale bar: 25 μm.
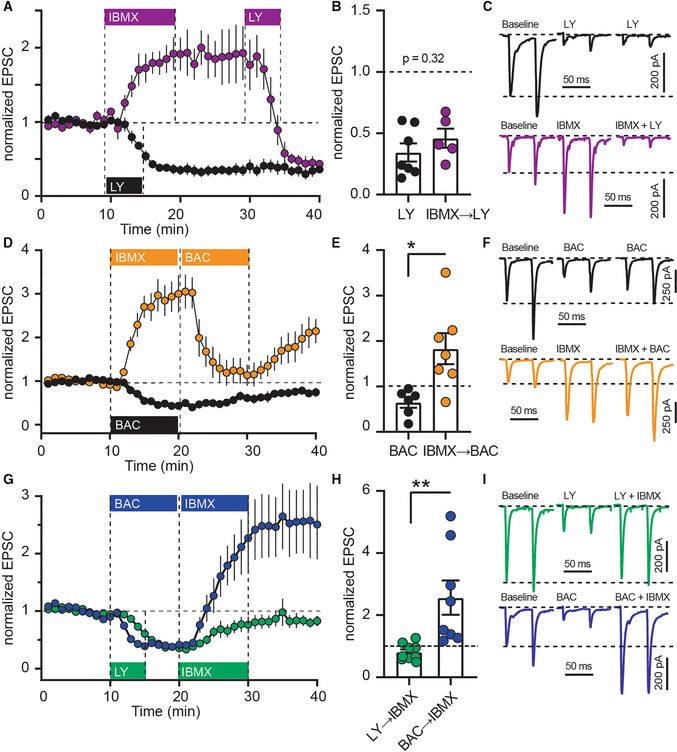
- A
The mGlu2/3‐agonist LY379268 (LY; 200 nM) was applied alone (black), or after IBMX (75 μM; purple). Mean ± SEM.
- B
Averaged EPSC amplitudes from the last 5 min of (A). P = 0.32, unpaired t‐test, N = 5–6. Mean ± SEM.
- C
Example recordings from (A).
- D
GABAB agonist baclofen (BAC; 3 μM) applied alone (black), or after IBMX (orange). Mean ± SEM.
- E
Averaged EPSC amplitudes from the last 5 min of (D). *P < 0.05, unpaired t‐test, N = 6–7. Mean ± SEM.
- F
Example recordings from (D).
- G
IMBX was applied after LY (green) or BAC (blue). Mean ± SEM.
- H
Averaged EPSC amplitudes from the last 5 min of (G). **P < 0.01, unpaired t‐test N = 6–8. Mean ± SEM.
- I
Example recordings from (G).
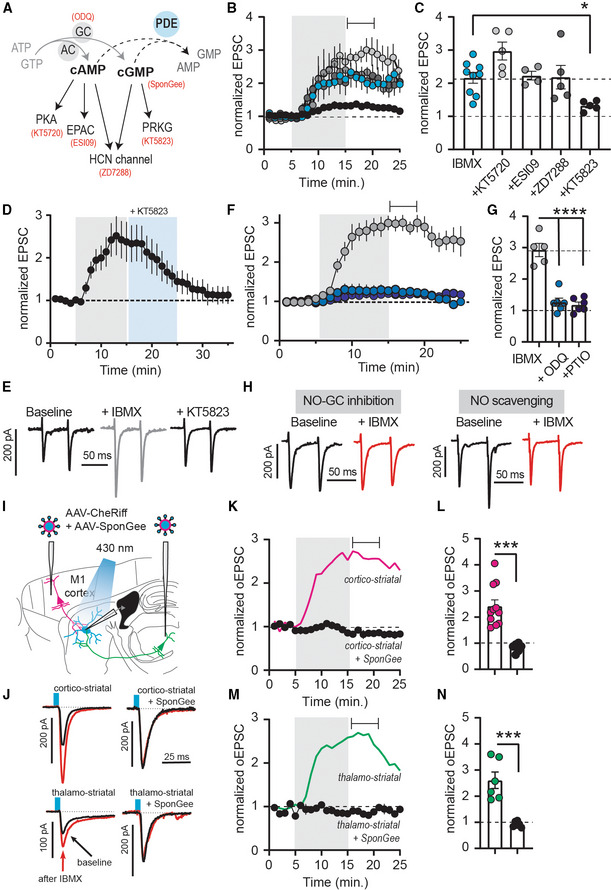
- A
Inhibition of PDE1 decreases both cAMP and cGMP hydrolysis and potentially activate downstream signaling via PKA, EPAC, PRKG, or HCN channels. In red are respective inhibitors or scavengers.
- B
EPSCs with downstream inhibitors (see A and C) before and after IBMX (75 μM; gray shading). Mean ± SEM. Drugs were used at following concentrations: KT5720 0.5 μM, ESI09 15 μM, ZD7288 30 μM, KT5823 1 μM.
- C
Averaged responses from the time window indicated in (B). *P < 0.05, ANOVA followed by Dunnett's multiple comparison test versus IBMX, N = 4–7. Mean ± SEM. IBMX data in (B) and (C) are replotted from Fig 1.
- D
EPSCs with bath application of IBMX (75 μM), followed by PRKG inhibitor KT5823 (1 μM). Mean ± SEM. N = 7.
- E
Example traces from (D).
- F
EPSCs before and after IBMX (75 μM, gray shading), with either short (10 min, “IBMX”, gray) or long incubation (> 60 min) in NO‐GC inhibitor ODQ (10 μM, light blue), or long incubation in NO‐scavenger carboxy‐PTIO (> 60 min, 50 μM, dark blue). Mean ± SEM.
- G
Averaged responses for the time window indicated in (F). ****P < 0.05, ANOVA followed by Dunnett's multiple comparison test versus IBMX, N = 5–6. Mean ± SEM.
- H
Example traces from (F).
- I
Neurons in M1 or the PF co‐expressed CheRiff and the cGMP scavenger SponGee.
- J
Example recordings before (black) and after (red) IBMX, controls from Fig 1.
- K
Effect of IBMX on cortico‐striatal oEPSCs in the presence of SponGee (black). Control oEPSCs are replotted from Fig 1 (magenta). Mean ± SEM.
- L
Corticostriatal oEPSCs averaged from the time indicated in (F). ***P < 0.001, unpaired t‐test, N = 11 and 6. Mean ± SEM.
- M, N
As (J, K) but thalamostriatal oEPSCs. Controls (green) are replotted from Fig 1. ***P < 0.001, unpaired t‐test, N = 6 and 6. Mean ± SEM.
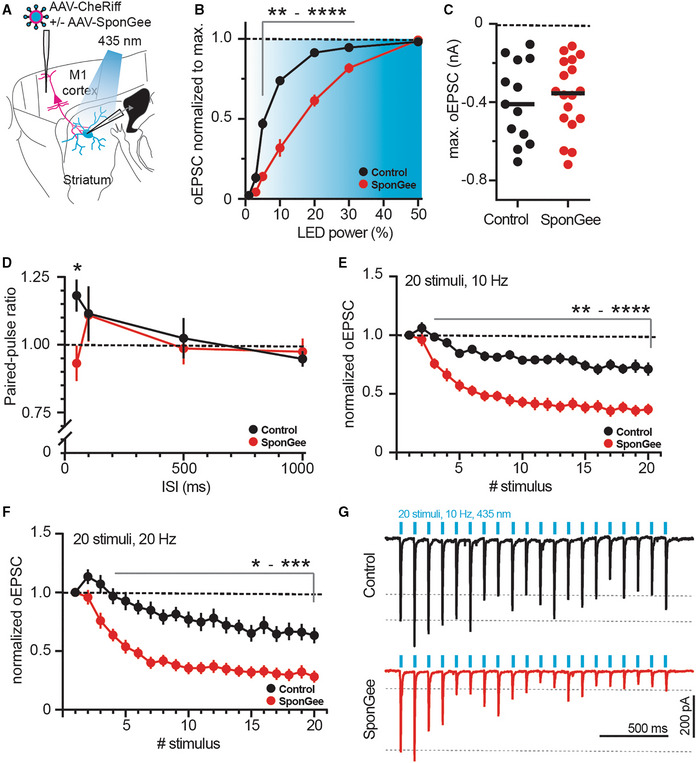
- A
Sketch of experimental design. SPNs were patched in the striatum and oEPSCs evoked from cortical neurons with or without SponGee.
- B
Right shift of the input–output relationship in the presence of SponGee. **P < 0.01, ***P < 0.001, ****P < 0.0001 two‐way ANOVA followed by Sidak's post hoc test, N = 13 and 18. Mean ± SEM.
- C
Maximum evoked current is not changed by the presence of SponGee. P = 0.69, unpaired t‐test, N = 13 and 18.
- D
Paired‐pulse ratios measured for different interstimulus intervals (ISI). *P < 0.05, two‐way ANOVA followed by Sidak's post hoc test, N = 13 and 18. Mean ± SEM.
- E
Adaptation of oEPSCs for 20 consecutive stimuli given at 10 Hz. The oEPSC amplitudes are normalized to the respective first stimulus. **P < 0.01, ***P < 0.001, ****P < 0.0001, two‐way ANOVA followed by Sidak's post hoc test, N = 13 and 18. Mean ± SEM.
- F
As in (E) but with 20 stimuli given at 20 Hz. *P < 0.05 **P < 0.01, ***P < 0.001 two‐way ANOVA followed by Sidak's post hoc test, N = 13 and 18. Mean ± SEM.
- G
Example traces for 10 Hz stimulation in (E).
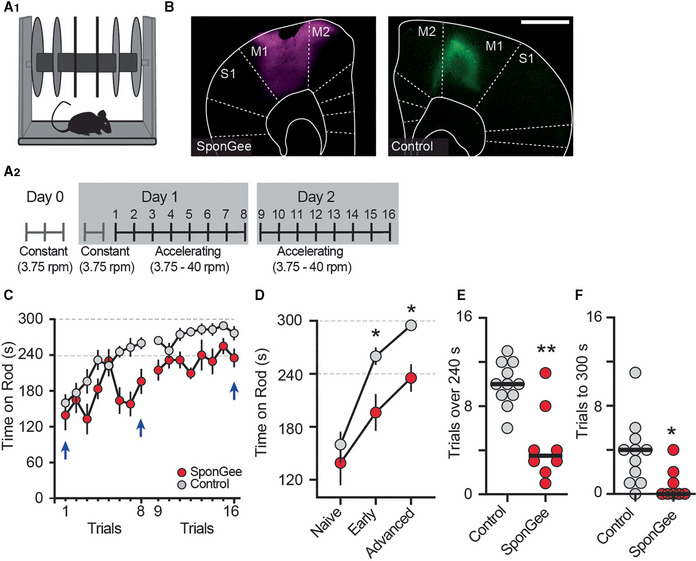
- A1, A2
Mice were trained on the rotarod. A2 shows time course of the motor skill learning paradigm, starting with a habituation on a constant speed on day 0, and an additional round of habituation on day 1. Mice were trained for eight trials on two consecutive days.
- B
Example pictures from each group, either expressing AAV2/9‐synapsin‐SponGee (left) or a control AAV (AAV2/9 synapsin‐CheRiff‐Cerulean, right) in the M1 motor cortex. Scale bar 1 mm.
- C
Mean time spent on accelerating rod during each of eight trials on days 1 and 2. Control mice (gray) show progressive learning, that is, longer times on the accelerating rod, over both test days. Mice with SponGee (red) perform less well. Blue arrows indicate the time points compared in (D). Mean ± SEM.
- D
“Naïve” is the first trial on the accelerating rotarod, “early” the performance on the last trial on day 1 and “advanced” on the last trial at the end of the second day of motor learning. *P < 0.05, two‐way ANOVA followed by Sidak's post hoc test, N = 11 and 8. Mean ± SEM.
- E, F
(E) Number of trials that each mouse stayed on the rod for at least 240 s or (F) Until the cut‐off time of 300 s. *P < 0.05, **P < 0.01, unpaired t‐test, N = 11 and 8.
Similar articles
-
Kainate Receptors Inhibit Glutamate Release Via Mobilization of Endocannabinoids in Striatal Direct Pathway Spiny Projection Neurons.J Neurosci. 2018 Apr 18;38(16):3901-3910. doi: 10.1523/JNEUROSCI.1788-17.2018. Epub 2018 Mar 14. J Neurosci. 2018. PMID: 29540547 Free PMC article.
-
Phosphodiesterase 1 Bridges Glutamate Inputs with NO- and Dopamine-Induced Cyclic Nucleotide Signals in the Striatum.Cereb Cortex. 2019 Dec 17;29(12):5022-5036. doi: 10.1093/cercor/bhz041. Cereb Cortex. 2019. PMID: 30877787
-
Parvalbumin-producing striatal interneurons receive excitatory inputs onto proximal dendrites from the motor thalamus in male mice.J Neurosci Res. 2018 Jul;96(7):1186-1207. doi: 10.1002/jnr.24214. Epub 2018 Jan 4. J Neurosci Res. 2018. PMID: 29314192
-
Postsynaptic integration of glutamatergic and dopaminergic signals in the striatum.Prog Neurobiol. 1994 Oct;44(2):163-96. doi: 10.1016/0301-0082(94)90037-x. Prog Neurobiol. 1994. PMID: 7831476 Review.
-
Integrating neurotransmission in striatal medium spiny neurons.Adv Exp Med Biol. 2012;970:407-29. doi: 10.1007/978-3-7091-0932-8_18. Adv Exp Med Biol. 2012. PMID: 22351066 Review.
Cited by
-
Ca2+-dependent phosphodiesterase 1 regulates the plasticity of striatal spiny projection neuron glutamatergic synapses.Cell Rep. 2024 Aug 27;43(8):114540. doi: 10.1016/j.celrep.2024.114540. Epub 2024 Jul 25. Cell Rep. 2024. PMID: 39058595 Free PMC article.
-
Optogenetic elevation of postsynaptic cGMP in the hippocampal dentate gyrus enhances LTP and modifies mouse behaviors.Front Mol Neurosci. 2024 Nov 26;17:1479360. doi: 10.3389/fnmol.2024.1479360. eCollection 2024. Front Mol Neurosci. 2024. PMID: 39660172 Free PMC article.
-
Analysis of changes in intercellular communications in Alzheimer's disease reveals conserved changes in glutamatergic transmission in mice and humans.Sci Rep. 2025 Jul 19;15(1):26248. doi: 10.1038/s41598-025-10795-4. Sci Rep. 2025. PMID: 40683902 Free PMC article.
References
-
- Arancio O, Kandel ER, Hawkins RD (1995) Activity‐dependent long‐term enhancement of transmitter release by presynaptic 3′,5′‐cyclic GMP in cultured hippocampal neurons. Nature 376: 74–80 - PubMed
-
- Catterall WA, Few AP (2008) Calcium channel regulation and presynaptic plasticity. Neuron 59: 882–901 - PubMed
Publication types
MeSH terms
Substances
LinkOut - more resources
Full Text Sources
