Expression of GOT2 Is Epigenetically Regulated by DNA Methylation and Correlates with Immune Infiltrates in Clear-Cell Renal Cell Carcinoma
- PMID: 35735610
- PMCID: PMC9222030
- DOI: 10.3390/cimb44060169
Expression of GOT2 Is Epigenetically Regulated by DNA Methylation and Correlates with Immune Infiltrates in Clear-Cell Renal Cell Carcinoma
Abstract
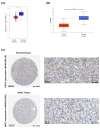
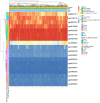
Clear cell renal cell carcinoma (KIRC) is the most common and highly malignant pathological type of kidney cancer, characterized by a profound metabolism dysregulation. As part of aspartate biosynthesis, mitochondrial GOT2 (glutamic-oxaloacetic transaminase 2) is essential for regulating cellular energy production and biosynthesis, linking multiple pathways. Nevertheless, the expression profile and prognostic significance of GOT2 in KIRC remain unclear. This study comprehensively analyzed the transcriptional levels, epigenetic regulation, correlation with immune infiltration, and prognosis of GOT2 in KIRC using rigorous bioinformatics analysis. We discovered that the expression levels of both mRNA and protein of GOT2 were remarkably decreased in KIRC tissues in comparison with normal tissues and were also significantly related to the clinical features and prognosis of KIRC. Remarkably, low GOT2 expression was positively associated with poorer overall survival (OS) and disease-free survival (DFS). Further analysis revealed that GOT2 downregulation is driven by DNA methylation in the promoter-related CpG islands. Finally, we also shed light on the influence of GOT2 expression in immune cell infiltration, suggesting that GOT2 may be a potential prognostic marker and therapeutic target for KIRC patients.
Keywords: GOT2; KIRC; epigenetics; immune cell infiltration; multi-omics.
Conflict of interest statement
The authors declare no conflict of interest.
Figures


Similar articles
-
Downregulation of RAB17 have a poor prognosis in kidney renal clear cell carcinoma and its expression correlates with DNA methylation and immune infiltration.Cell Signal. 2023 Sep;109:110743. doi: 10.1016/j.cellsig.2023.110743. Epub 2023 Jun 1. Cell Signal. 2023. PMID: 37269962
-
The combination of NDUFS1 with CD4+ T cell infiltration predicts favorable prognosis in kidney renal clear cell carcinoma.Front Cell Dev Biol. 2023 Jul 4;11:1168462. doi: 10.3389/fcell.2023.1168462. eCollection 2023. Front Cell Dev Biol. 2023. PMID: 37469574 Free PMC article.
-
LAG3 (LAG-3, CD223) DNA methylation correlates with LAG3 expression by tumor and immune cells, immune cell infiltration, and overall survival in clear cell renal cell carcinoma.J Immunother Cancer. 2020 Mar;8(1):e000552. doi: 10.1136/jitc-2020-000552. J Immunother Cancer. 2020. PMID: 32234847 Free PMC article.
-
Can CpG methylation serve as surrogate markers for immune infiltration in cancer?Adv Cancer Res. 2019;143:351-384. doi: 10.1016/bs.acr.2019.03.007. Epub 2019 Apr 17. Adv Cancer Res. 2019. PMID: 31202362 Review.
-
GOT2: New therapeutic target in pancreatic cancer.Genes Dis. 2024 Jul 2;12(4):101370. doi: 10.1016/j.gendis.2024.101370. eCollection 2025 Jul. Genes Dis. 2024. PMID: 40247913 Free PMC article. Review.
Cited by
-
Evaluation of aristolochic acid Ι nephrotoxicity in mice via 1H NMR quantitative metabolomics and network pharmacology approaches.Toxicol Res (Camb). 2023 Mar 25;12(2):282-295. doi: 10.1093/toxres/tfad020. eCollection 2023 Apr. Toxicol Res (Camb). 2023. PMID: 37125334 Free PMC article.
-
Bioinformatics analysis to disclose shared molecular mechanisms between type-2 diabetes and clear-cell renal-cell carcinoma, and therapeutic indications.Sci Rep. 2024 Aug 19;14(1):19133. doi: 10.1038/s41598-024-69302-w. Sci Rep. 2024. PMID: 39160196 Free PMC article.
-
GOT2: a moonlighting enzyme at the crossroads of cancer metabolism and theranostics.Front Immunol. 2025 Aug 6;16:1626914. doi: 10.3389/fimmu.2025.1626914. eCollection 2025. Front Immunol. 2025. PMID: 40842990 Free PMC article. Review.
-
PARP1 Characterization as a Potential Biomarker for BCR::ABL1 p190+ Acute Lymphoblastic Leukemia.Cancers (Basel). 2023 Nov 22;15(23):5510. doi: 10.3390/cancers15235510. Cancers (Basel). 2023. PMID: 38067214 Free PMC article.
-
Spotlight on GOT2 in Cancer Metabolism.Onco Targets Ther. 2023 Aug 22;16:695-702. doi: 10.2147/OTT.S382161. eCollection 2023. Onco Targets Ther. 2023. PMID: 37635751 Free PMC article. Review.
References
-
- Gerlinger M., Rowan A.J., Horswell S., Math M., Larkin J., Endesfelder D., Gronroos E., Martinez P., Matthews N., Stewart A., et al. Intratumor heterogeneity and branched evolution revealed by multiregion sequencing. N. Engl. J. Med. 2012;366:883–892. doi: 10.1056/NEJMoa1113205. - DOI - PMC - PubMed
LinkOut - more resources
Full Text Sources
Research Materials
Miscellaneous

