. 2022 Nov;596(21):2746-2767.
doi: 10.1002/1873-3468.14436. Epub 2022 Jul 21.

Ubiquitin receptors play redundant roles in the proteasomal degradation of the p53 repressor MDM2

Affiliations

Ubiquitin receptors play redundant roles in the proteasomal degradation of the p53 repressor MDM2

Alison Sparks et al. FEBS Lett. 2022 Nov.

Abstract

Much remains to be determined about the participation of ubiquitin receptors in proteasomal degradation and their potential as therapeutic targets. Suppression of the ubiquitin receptor S5A/PSMD4/hRpn10 alone stabilises p53/TP53 but not the key p53 repressor MDM2. Here, we observed S5A and the ubiquitin receptors ADRM1/PSMD16/hRpn13 and RAD23A and B functionally overlap in MDM2 degradation. We provide further evidence that degradation of only a subset of ubiquitinated proteins is sensitive to S5A knockdown because ubiquitin receptor redundancy is commonplace. p53 can be upregulated by S5A modulation while degradation of substrates with redundant receptors is maintained. Our observations and analysis of Cancer Dependency Map (DepMap) screens show S5A depletion/loss substantially reduces cancer cell line viability. This and selective S5A dependency of proteasomal substrates make S5A a target of interest for cancer therapy.

Keywords: ADRM1/PSMD16/hRpn13; MDM2; S5A/PSMD4/hRpn10; p53/TP53; proteasomal ubiquitin receptor; redundancy.


Figures

Fig. 1
Fig. 1
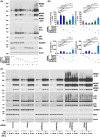
Knockdown of S5A alone is sufficient to stabilise p53, while depletion of both S5A and ADRM1 is required to inhibit MDM2 degradation. A375 cells were harvested 48 h after transfection with the indicated siRNAs and analysed by western blotting. A non‐targeting siRNA (Control) was used. S5A and ADRM1 siRNA (A) and (B) are complementary to different target sequences. Cycloheximide (CHX; 20 μg·mL−1) was added for 60 min unless otherwise indicated to assess protein stability. (A) Representative western blots. Short (SE), medium (ME) and long (LE) exposures are included. (B) Western blot results expressed as the percentage remaining in cycloheximide‐treated cells (upper panels: protein stability) or, in the absence of cycloheximide, as a percentage of the level in cells transfected with siRNA S5A (A) (lower panels: protein expression). The mean and SD are shown, and individual data points from four experiments are plotted, ns, not significant, *P < 0.05, **P < 0.01, ***P < 0.001, ****P < 0.0001 using one‐way ANOVA and Bonferroni post hoc test. (C) Comparison of the effects on p53 and MDM2 of combined S5A and ADRM1 depletion and bortezomib‐mediated proteasome inhibition (BZ; 100 nm for 5 h). Representative western blots. Short (SE), medium (ME) and long (LE) exposures are included.
Fig. 2
Fig. 2
Ectopic expression of S5AΔUIM is sufficient to inhibit the degradation of p53, but attenuation of MDM2 degradation requires the simultaneous expression of S5AΔUIM and depletion of ADRM1. A375 cells were reverse transfected with non‐targeting siRNA (Control) or siRNAs ADRM1 (A) or (B) and 24 h later transduced with a control adenovirus (CV) expressing GFP alone or an adenovirus expressing GFP and an HA‐tagged deletion of S5A lacking UIMs (S5AΔUIM). Cycloheximide (CHX; 20 μg·mL−1) was added for the indicated times to assess protein stability. Cells were harvested 40 h after infection and analysed by western blotting. (A) Representative western blots. To allow direct comparison of protein stability, different exposures of MDM2 and p53 blots are shown, so that band intensities in the absence of cycloheximide are approximately matched. Duplicate 0‐min technical replicates were included. (B) Western blot results expressed as the percentage remaining in cycloheximide‐treated cells (protein stability). The mean and SEM are shown (n = 3); all significant differences from cells transfected with control siRNA and transduced with control adenovirus are indicated, *P < 0.05, **P < 0.01, ***P < 0.001, ****P < 0.0001 using one‐way ANOVA and Bonferroni post hoc test.
Fig. 3
Fig. 3
Depletion of RAD23A and B alone or in combination with S5A does not significantly increase the stability of p53 or MDM2. A375 cells were harvested 48 h after siRNA transfection and analysed by western blotting. RAD23A and B siRNAs (A) (B) and (C) are complementary to different target sequences. Cells were incubated with cycloheximide (CHX; 20 μg·mL−1) for the final 60 min to assess protein stability. (A) Knockdown of RAD23A and B alone or in combination did not substantially influence the stability of p53 or MDM2. Representative western blots are shown. (B and C) Combining knockdown of RAD23A with S5A depletion did not increase the stability of p53 or MDM2. (B) Representative western blots. (C) Western blot results expressed as the percentage remaining in cycloheximide‐treated cells (upper panels: protein stability) or, in the absence of cycloheximide, as a percentage of the level in cells transfected with siRNA S5A(A) (lower panels: protein expression). The mean and SD are shown, and individual data points from three experiments are plotted, ns, not significant, *P < 0.05 using one‐way ANOVA and Bonferroni post hoc test. (D and E) Combining knockdown of RAD23B with S5A depletion did not significantly increase the stability of p53 or MDM2. (D) Representative western blots. (E) Western blot results expressed as the percentage remaining in cycloheximide‐treated cells (upper panels: protein stability) or, in the absence of cycloheximide, as a percentage of the level in cells transfected with siRNA S5A(A) (lower panels: protein expression). The mean and SD are shown, and individual data points from four experiments are plotted, ns, not significant, *P < 0.05, **P < 0.01 using one‐way ANOVA and Bonferroni post hoc test.
Fig. 4
Fig. 4
RAD23A and B play redundant roles with S5A and ADRM1 in the degradation of MDM2. A375 cells were harvested 48 h after siRNA transfection and analysed by western blotting. Cells were incubated with cycloheximide (CHX; 20 μg·mL−1) for the final 60 min to assess protein stability. Knockdown of RAD23A or B in cells where both S5A and ADRM1 were also depleted further stabilised MDM2. (A) Representative western blots. Short exposures (SE) and long exposures (LE) are included for MDM2. (B) Western blot results expressed as the percentage remaining in cycloheximide‐treated cells (protein stability). The mean and SD are shown and individual data points from four experiments are plotted, ns, not significant, *P < 0.05, **P < 0.01, ***P < 0.001, ****P < 0.0001 using one‐way ANOVA and Bonferroni post hoc test.
Fig. 5
Fig. 5
S5A and ADRM1 play partially redundant roles in general protein degradation, but S5A makes a substantial contribution to maintaining the viability of cancer cells. (A) The simultaneous knockdown of S5A and ADRM1 had a greater effect on the accumulation of ubiquitin conjugates and, except for p53, the stability of proteasomal substrates tested. A375 cells were harvested 48 h after siRNA transfection. Cells were incubated with cycloheximide (CHX; 20 μg·mL−1) for 60 min to assess protein stability. Representative western blots are shown. Short exposures (SE) and long exposures (LE) are included. (B) While the combined depletion of S5A and ADRM1 induced the greatest level of cell death, targeting S5A but not ADRM1 alone was sufficient to reduce cell viability markedly. A375 cells were mock‐transfected (Mock) or transfected with the indicated siRNAs. The number of live cells expressed as a percentage of non‐targeting siRNA transfected cells and the percentage of dead cells was assessed 96 h after siRNA reverse transfection by real‐time imaging. The mean and SD are shown and individual data points from four experiments are plotted, ns, not significant, **P < 0.01, ***P < 0.001, ****P < 0.0001 using one‐way ANOVA and Bonferroni post hoc test. (C and D) Targeting S5A reduces the viability of cancer cell lines. (C) Dependency probability analysis of Achilles, DRIVE and Marcotte knockdown (RNAi) and Project Score and DepMap 22Q1 Public knockout (PS, DM CRISPR) cancer cell line screens. The results are expressed as a percentage of the cancer cell lines classified as being dependent for viability on S5A, ADRM1 and, for comparison, the genes encoding 20S CP subunits PSMB3 and 5. The number of dependent cell lines and the total number of cell lines screened are shown. (D) DepMap portal analysis of the influence on viability (gene effect) of targeting the indicated gene in Achilles, DRIVE and Marcotte knockdown screens (RNAi) and Project Score (PS CRISPR) and DepMap 22Q1 Public (DM CRISPR) knockout screens. Box and whisker plots are shown. A negative gene effect score indicates a decrease in viability. The boxes extend from the 25th to 75th percentiles. The whiskers extend to the 10th and 90th percentiles. The median (line) and mean (+) are shown.
Fig. 6
Fig. 6
The reduction in viability caused by depleting S5A, but not other methods of targeting the proteasome, is greater in HCT116 cells with full‐length p53. (A) In HCT116 cells, the degradation of p53 was inhibited by depletion of S5A, while inhibition of MDM2 degradation required the knockdown of both S5A and ADRM1. HCT116 cells with wild‐type p53 were harvested 48 h after transfection with the indicated siRNAs. Cycloheximide (CHX; 20 μg·mL−1) was added for 60 min to assess protein stability. Representative western blots are shown. For p53 and MDM2 short and long exposures are included (SE and LE, respectively). (B) In HCT116 cells, loss of full‐length p53 partially attenuated the decrease in viability caused by S5A knockdown, but it did not significantly influence the reduction in viability due to the simultaneous depletion of S5A and ADRM1. The viability of HCT116 cells with wild‐type p53 (HCT116 WT) and HCT116 cells where exon two of the p53 gene was deleted (HCT116Ex2p53−/−) was assessed 96 h after siRNA reverse transfection using the SRB assay. The mean and SD are shown and individual data points from three experiments are plotted, ns, not significant, **P < 0.01, ***P < 0.001, ****P < 0.0001 using one‐way ANOVA and Bonferroni post hoc test. (C) In HCT116 cells, loss of full‐length p53 increased sensitivity to submaximal concentrations of bortezomib but did not influence the decrease in viability observed at higher concentrations of this proteasome inhibitor. HCT116 WT and HCT116Ex2p53−/− cells were incubated with the indicated concentration of bortezomib (BZ) and viability was assessed after 72 h using the SRB assay. The mean and SD are shown and individual data points from three experiments are plotted, ns, not significant, ****P < 0.0001 using one‐way ANOVA and Bonferroni post hoc test.
Fig. 7
Fig. 7
The effect of S5A knockout on viability is not strongly influenced overall by p53 mutation; however, targeting S5A has a greater effect on viability in cell lines where wild‐type p53 is more active in limiting growth. (A and B) There is, at best, a weak correlation between the p53 mutational status and the reduction in viability caused by targeting S5A. DepMap portal analysis of Project Score knockout screens in cancer cell lines. (A) The gene effect scores in cell lines with wild‐type p53 (n = 72) and cell lines with p53 mutation (n = 245) for S5A and ADRM1 and, for comparison, genes encoding the wild‐type p53 repressors MDM2, HAUSP and UBCH5C. Box and whisker plots are shown. The boxes extend from the 25th to 75th percentiles. The whiskers extend to the 10th and 90th percentiles. The median (line) and mean (+) are shown. (B) The Pearson correlation coefficients (Pearson's r) for p53 mutation and the gene effect scores for S5A and ADRM1 and the genes encoding the indicated wild‐type p53 repressors and proteasome subunits (72 wild‐type p53 cell lines and 245 mutant p53 cell lines). All significant correlations are indicated, *P < 0.05, ****P < 0.0001 (two‐tailed). (C and D) Targeting S5A, but not proteasome subunits in general, has a greater effect on viability in cell lines where wild‐type p53 is more growth limiting. DepMap portal analysis of the correlation between the gene effect scores in cell lines with wild‐type p53 for the indicated genes and p53 in Project Score CRISPR knockout screens. (C) DepMap gene effect scores in wild‐type p53 cell lines (n = 72) for the indicated genes plotted against the gene effect scores for p53. A negative gene effect score indicates a decrease in viability and a positive gene effect score an increase in growth. The Pearson's correlation coefficients are shown (r), *P < 0.05, **P < 0.01, ****P < 0.0001 (two‐tailed). (D) Pearson correlation coefficients (Pearson's r) in wild‐type p53 cell lines (n = 72) for the gene effect scores for the indicated genes and the gene effect scores for p53. All significant correlations are indicated, *P < 0.05, **P < 0.01, ****P < 0.0001 (two‐tailed).

Similar articles

References

    1. Kwon YT, Ciechanover A. The ubiquitin code in the ubiquitin‐proteasome system and autophagy. Trends Biochem Sci. 2017;42(11):873–86. - PubMed
    1. Roeten MSF, Cloos J, Jansen G. Positioning of proteasome inhibitors in therapy of solid malignancies. Cancer Chemother Pharmacol. 2018;81(2):227–43. - PMC - PubMed
    1. Sherman DJ, Li J. Proteasome inhibitors: harnessing proteostasis to combat disease. Molecules. 2020;25(3):671. - PMC - PubMed
    1. Tundo GR, Sbardella D, Santoro AM, Coletta A, Oddone F, Grasso G, et al. The proteasome as a druggable target with multiple therapeutic potentialities: cutting and non‐cutting edges. Pharmacol Ther. 2020;213:107579. - PMC - PubMed
    1. Kambhampati S, Wiita AP. Lessons learned from proteasome inhibitors, the paradigm for targeting protein homeostasis in cancer. Adv Exp Med Biol. 2020;1243:147–62. - PubMed

Publication types

MeSH terms