. 2022 Aug 5;12(8):1847-1859.
doi: 10.1158/2159-8290.CD-21-0282.

Mapping Phenotypic Plasticity upon the Cancer Cell State Landscape Using Manifold Learning

Affiliations

Mapping Phenotypic Plasticity upon the Cancer Cell State Landscape Using Manifold Learning

Daniel B Burkhardt et al. Cancer Discov. .

Abstract

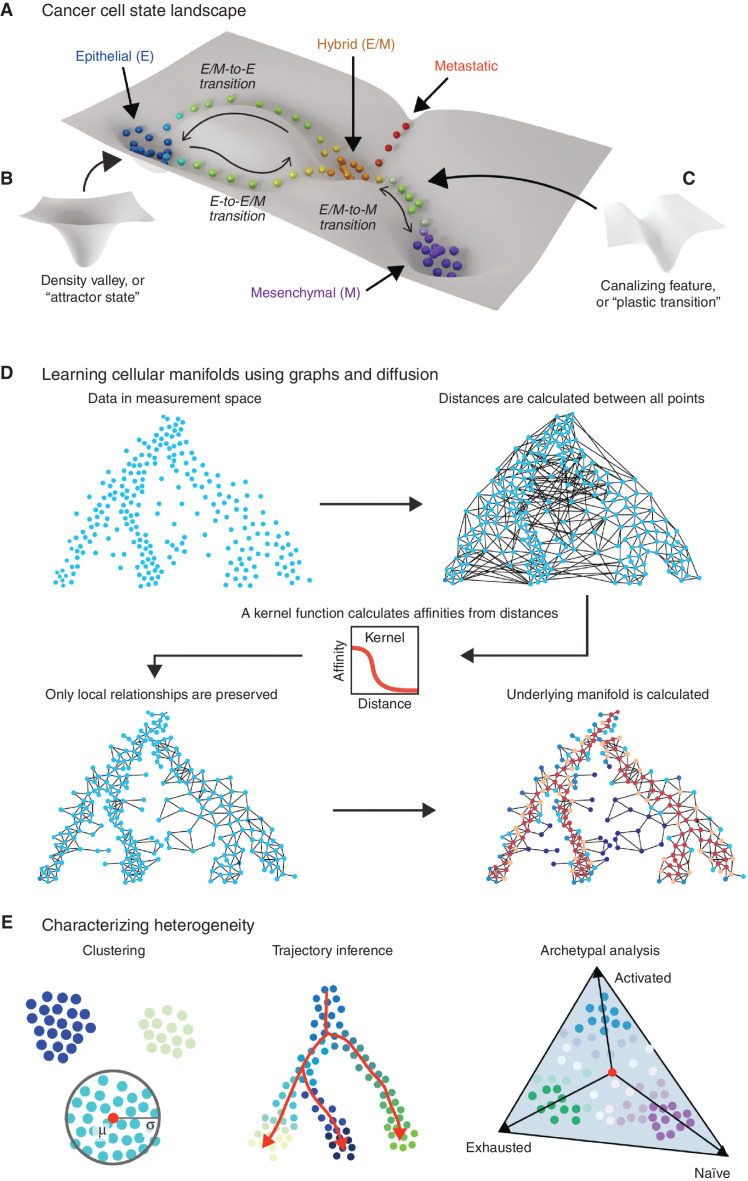
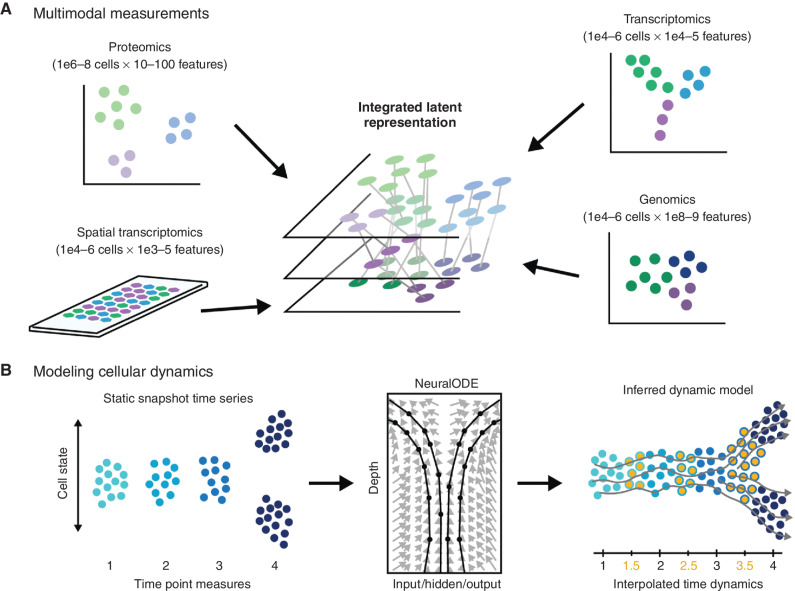
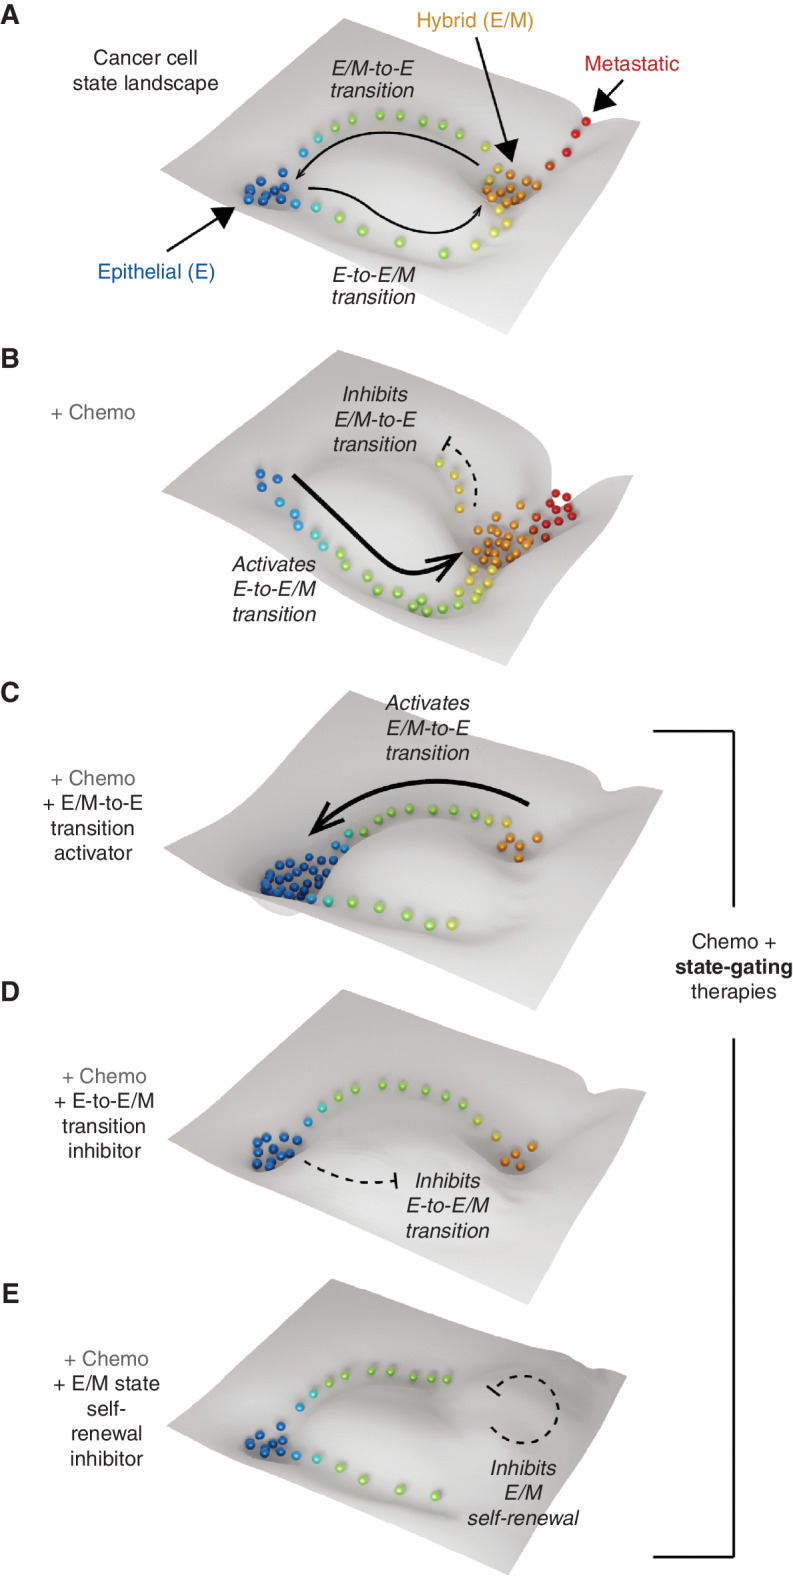
Abstract: Phenotypic plasticity describes the ability of cancer cells to undergo dynamic, nongenetic cell state changes that amplify cancer heterogeneity to promote metastasis and therapy evasion. Thus, cancer cells occupy a continuous spectrum of phenotypic states connected by trajectories defining dynamic transitions upon a cancer cell state landscape. With technologies proliferating to systematically record molecular mechanisms at single-cell resolution, we illuminate manifold learning techniques as emerging computational tools to effectively model cell state dynamics in a way that mimics our understanding of the cell state landscape. We anticipate that "state-gating" therapies targeting phenotypic plasticity will limit cancer heterogeneity, metastasis, and therapy resistance.

Significance: Nongenetic mechanisms underlying phenotypic plasticity have emerged as significant drivers of tumor heterogeneity, metastasis, and therapy resistance. Herein, we discuss new experimental and computational techniques to define phenotypic plasticity as a scaffold to guide accelerated progress in uncovering new vulnerabilities for therapeutic exploitation.


Figures

Figure 1. Estimating the topology of the cancer cell state landscape via manifold modeling. A, Cancer cell populations reside in a high-dimensional state space that can be conceived as a landscape wherein highly populated “attractor states” constitute valleys (B) and the trajectories of “plastic transitions” between these states follow canalizing features such as channels (C). The height or depth of topologies on this landscape reflect the relative favourability of the corresponding cell state in thermodynamic or informational terms. D, The topology of cell state landscapes can be modeled using graph representations that approximate nonlinear but locally continuous “cellular manifolds.” Learning a graph from high-dimensional data such as scRNA-seq involves calculating global distances and then connecting adjacent neighborhoods of cells using a kernel function. Methods like diffusion, modeling random walks on the connected graph, can be used to estimate recurring trajectories within the data, reflecting plastic cell state transitions. E, Given the estimation of a manifold representing the cell state landscape, tasks like clustering (left), trajectory inference (center), and archetypal analysis (right) of phenotype composition can be performed to extend biological inferences.
Figure 1.
Estimating the topology of the cancer cell state landscape via manifold modeling. Cancer cell populations reside in a high-dimensional state space that can be conceived as a landscape (A) in which highly populated “attractor states” constitute valleys (B) and the trajectories of “plastic transitions” between these states follow canalizing features such as channels (C). The height or depth of topologies on this landscape reflect the relative favorability of the corresponding cell state in thermodynamic or informational terms. D, The topology of cell state landscapes can be modeled using graph representations that approximate nonlinear but locally continuous “cellular manifolds.” Learning a graph from high-dimensional data such as single-cell RNA sequencing involves calculating global distances and then connecting adjacent neighborhoods of cells using a kernel function. Methods like diffusion, modeling random walks on the connected graph, can be used to estimate recurring trajectories within the data, reflecting plastic cell state transitions. E, Given the estimation of a manifold representing the cell state landscape, tasks like clustering (left), trajectory inference (center), and archetypal analysis (right) of phenotype composition can be performed to extend biological inferences. E, epithelial; E/M, epithelial/mesenchymal; M, mesenchymal.
Figure 2. Modeling temporal dynamics. A, Single-cell populations can be characterized via different “Omics” modalities capturing genomic, transcriptomic, or proteomic information. Resulting data sets may vary significantly in the number of observations and the number of features, and different sets of relationships may exist between the same set of cells depending on which set of features are being examined. Data integration algorithms must be used to merge data sets for joint analysis of multiple data domains. B, In the context of single-cell time-series analyses comprising discrete timepoint data sets (left), dynamical models based on optimal transport or neural ordinary differential equations (NeuralODEs; center) have been used to improve our understanding of biological dynamics by interpolating intervening time-point data (orange points; right) to allow inference of dynamic trajectory models (gray lines).
Figure 2.
Modeling temporal dynamics. A, Single-cell populations can be characterized via different omics modalities capturing genomic, transcriptomic, or proteomic information. Resulting data sets may vary significantly in the number of observations and the number of features, and different sets of relationships may exist between the same set of cells depending on which set of features is being examined. Data integration algorithms must be used to merge data sets for joint analysis of multiple data domains. B, In the context of single-cell time-series analyses comprising discrete time point data sets (left), dynamical models based on optimal transport or neural ordinary differential equations (NeuralODE; center) have been used to improve our understanding of biological dynamics by interpolating intervening time point data (orange points, right) to allow inference of dynamic trajectory models (gray lines).
Figure 3. State-gating strategies to control cancer cell plasticity by remodeling the cancer landscape. A, A subspace of the cancer cell state landscape containing epithelial (“E”) and hybrid (“E/M”) attractor states linked by plastic transitions. B, Chemotherapy remodels the landscape favoring the transition from the E to the E/M state, while inhibiting the reverse process. This increases the population of E/M cells, which promote metastasis and therapy resistance. C–E, Potential antiplasticity “state-gating strategies”: (C) activating E/M to E transition, (D) inhibiting E to E/M transition, and (E) inhibiting E/M self-renewal. These will have dual actions, preventing the amplification of E/M cells by chemotherapy while simultaneously favoring the E state that is sensitive to chemotherapy.
Figure 3.
State-gating strategies to control cancer cell plasticity by remodeling the cancer landscape. A, A subspace of the cancer cell state landscape containing epithelial (E) and hybrid epithelial/mesenchymal (E/M) attractor states linked by plastic transitions. B, Chemotherapy (Chemo) remodels the landscape favoring the transition from the E to the E/M state while inhibiting the reverse process. This increases the population of E/M cells, which promote metastasis and therapy resistance. C–E, Potential antiplasticity state-gating strategies: activating E/M-to-E transition (C), inhibiting E-to-E/M transition (D), and inhibiting E/M self-renewal (E). These will have dual actions, preventing the amplification of E/M cells by chemotherapy while favoring the E state that is sensitive to chemotherapy.

References

    1. Hanahan D, Weinberg RA. Hallmarks of cancer: the next generation. Cell 2011;144:646–74. - PubMed
    1. Kreso A, Dick JE. Evolution of the cancer stem cell model. Cell Stem Cell 2014;14:275–91. - PubMed
    1. Yap TA, Gerlinger M, Futreal PA, Pusztai L, Swanton C. Intratumor heterogeneity: seeing the wood for the trees. Sci Transl Med 2012;4:127ps10. - PubMed
    1. Marine JC, Dawson SJ, Dawson MA. Non-genetic mechanisms of therapeutic resistance in cancer. Nat Rev Cancer 2020;20:743–56. - PubMed
    1. McGranahan N, Swanton C. Clonal heterogeneity and tumor evolution: past, present, and the future. Cell 2017;168:613–28. - PubMed

Publication types