. 2022 Aug 31;10(4):e0125721.
doi: 10.1128/spectrum.01257-21. Epub 2022 Jun 23.

A Novel Probiotic Bacillus subtilis Strain Confers Cytoprotection to Host Pig Intestinal Epithelial Cells during Enterotoxic Escherichia coli Infection

Affiliations

A Novel Probiotic Bacillus subtilis Strain Confers Cytoprotection to Host Pig Intestinal Epithelial Cells during Enterotoxic Escherichia coli Infection

Sudhanshu Sudan et al. Microbiol Spectr. .

Abstract

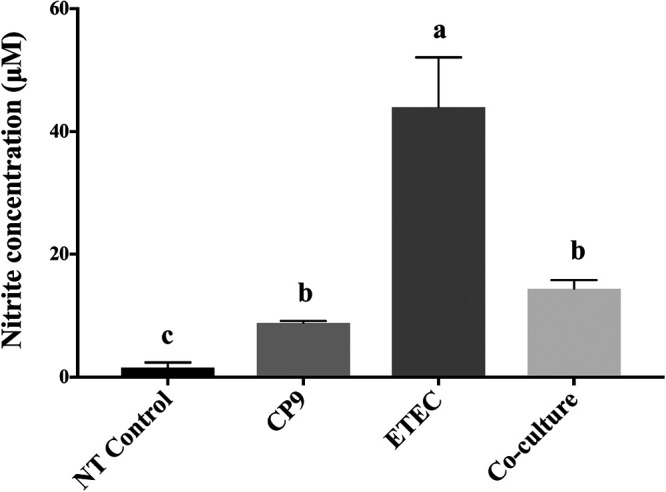
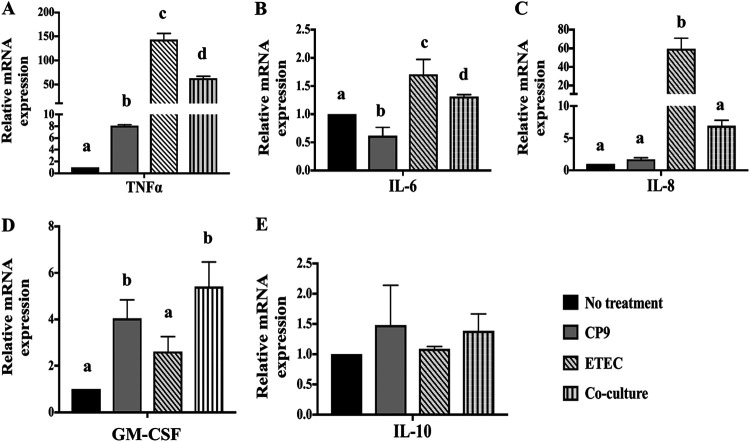
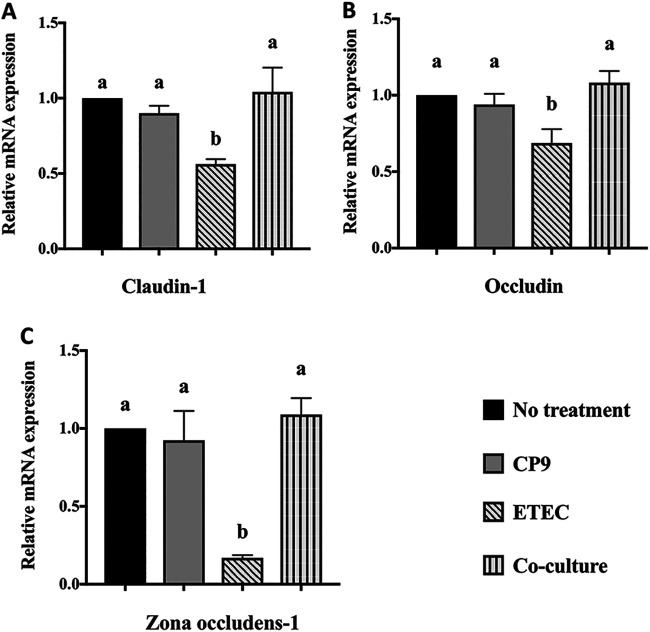
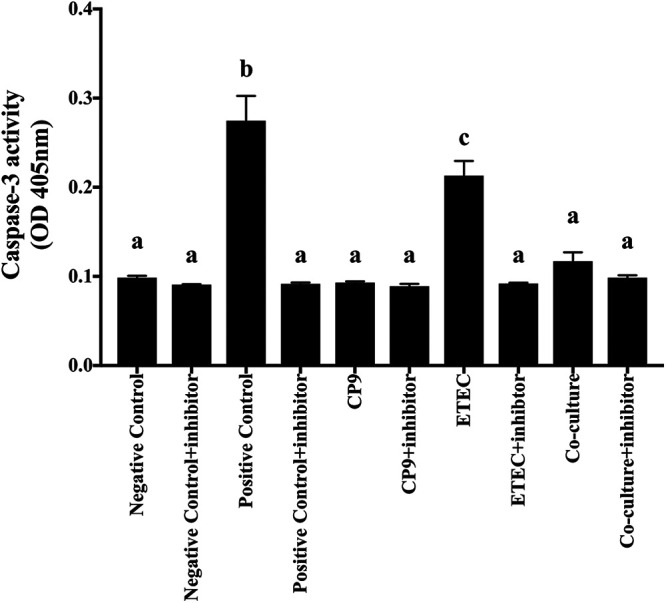
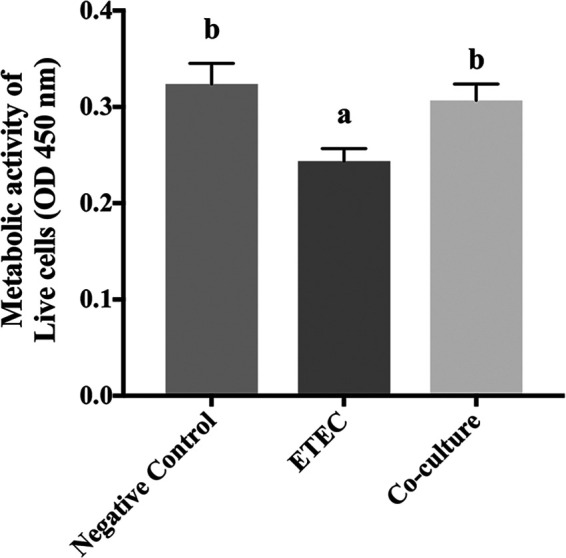
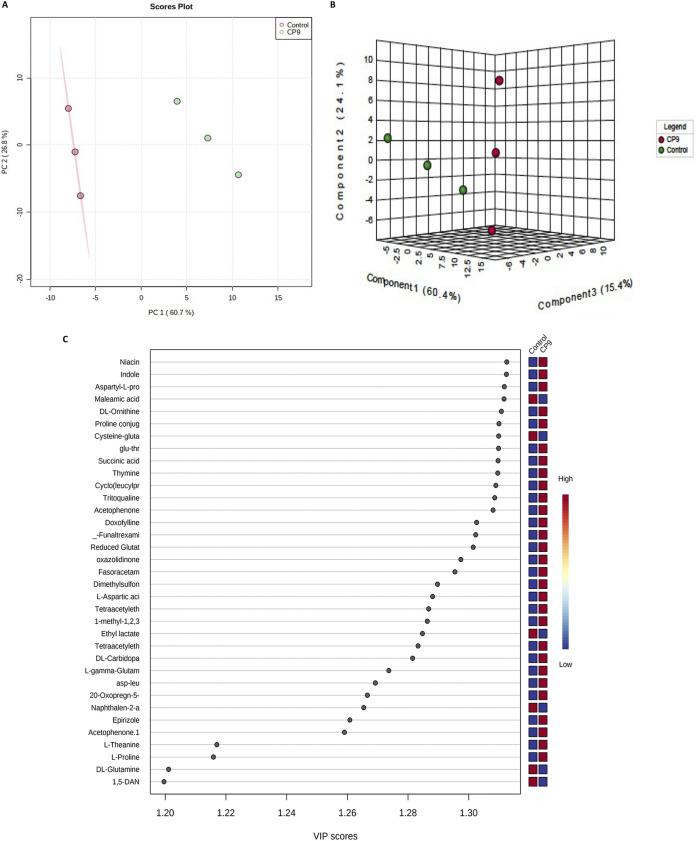
Enteric infections caused by enterotoxic Escherichia coli (ETEC) negatively impact the growth performance of piglets during weaning, resulting in significant economic losses for the producers. With the ban on antibiotic usage in livestock production, probiotics have gained a lot of attention as a potential alternative. However, strain specificity and limited knowledge on the host-specific targets limit their efficacy in preventing ETEC-related postweaning enteric infections. We recently isolated and characterized a novel probiotic Bacillus subtilis bacterium (CP9) that demonstrated antimicrobial activity. Here, we report anti-ETEC properties of CP9 and its impact on metabolic activity of swine intestinal epithelial (IPEC-J2) cells. Our results showed that pre- or coincubation with CP9 protected IPEC-J2 cells from ETEC-induced cytotoxicity. CP9 significantly attenuated ETEC-induced inflammatory response by reducing ETEC-induced nitric oxide production and relative mRNA expression of the Toll-like receptors (TLRs; TLR2, TLR4, and TLR9), proinflammatory tumor necrosis factor alpha, interleukins (ILs; IL-6 and IL-8), augmenting anti-inflammatory granulocyte-macrophage colony-stimulating factor and host defense peptide mucin 1 (MUC1) mRNA levels. We also show that CP9 significantly (P < 0.05) reduced caspase-3 activity, reinstated cell proliferation and increased relative expression of tight junction genes, claudin-1, occludin, and zona occludens-1 in ETEC-infected cells. Finally, metabolomic analysis revealed that CP9 exposure induced metabolic modulation in IPEC J2 cells with the greatest impact seen in alanine, aspartate, and glutamate metabolism; pyrimidine metabolism; nicotinate and nicotinamide metabolism; glutathione metabolism; the citrate cycle (TCA cycle); and arginine and proline metabolism. Our study shows that CP9 incubation attenuated ETEC-induced cytotoxicity in IPEC-J2 cells and offers insight into potential application of this probiotic for ETEC infection control. IMPORTANCE ETEC remains one of the leading causes of postweaning diarrhea and mortality in swine production. Due to the rising concerns with the antibiotic use in livestock, alternative interventions need to be developed. In this study, we analyzed the cytoprotective effect of a novel probiotic strain in combating ETEC infection in swine intestinal cells, along with assessing its mechanism of action. To our knowledge, this is also the first study to analyze the metabolic impact of a probiotic on intestinal cells. Results from this study should provide effective cues in developing a probiotic intervention for ameliorating ETEC infection and improving overall gut health in swine production.

Keywords: Bacillus subtilis; antimicrobial; antimicrobial agents; cytoprotection; enterotoxic E. coli; extreme environment; probiotic.


Conflict of interest statement

The authors declare no conflict of interest.

Figures

FIG 1
FIG 1
Impact of CP9 on ETEC-induced cytotoxicity in IPEC-J2 cells. (A) Change in cell morphology seen via preincubation assay. (B) Viability of IPEC-J2 cells after preincubation assay determined by trypan blue staining. (C) Change in cell morphology seen via coincubation assay. (D) Viability of IPEC-J2 cells after coincubation assay determined by trypan blue staining. The morphology of the cells was captured by using a Cytation 5 Cell Imaging Multi-Mode Reader at ×20 magnification, with a 100-μm scale in bright-field mode. The data are presented as means ± the SEM. Means marked with different letters (a, b, and c) differ significantly (P < 0.05).
FIG 2
FIG 2
Inhibitory effect of CP9 on ETEC adhesion to IPEC-J2 cells. (A) Bacterial cell concentration determined in cell surface adhesion assay. (B) ETEC cell concentration determined in spent media. The data are presented as means ± the SEM. Means marked with different letters (a, b, and c) differ significantly (P < 0.05).
FIG 3
FIG 3
Nitric oxide production in IPEC-J2 cells. The impact of CP9 on nitric oxide production in ETEC-induced cells was assessed by calculating the nitrite concentration by using a Griess assay. The data are presented as means ± the SEM. Means marked with different letters (a, b, and c) differ significantly (P < 0.05).
FIG 4
FIG 4
Relative gene expression of Toll-like receptors in IPEC-J2 cells. A coincubation assay was performed for 4 h with equal numbers of CP9 and ETEC in IPEC-J2 cells. The relative expression of TLR2 (A), TLR4 (B), and TLR9 (C) mRNAs was calculated by real-time PCR. The expression levels of all target genes were calculated relative to the housekeeping gene GAPDH using the 2−ΔΔCT method. The values for the control cells were set to 1. The data are presented as means ± the SEM. Means marked with different letters (a, b, and c) differ significantly (P < 0.05).
FIG 5
FIG 5
Relative gene expression of anti- and proinflammatory cytokines in IPEC-J2 cells. A coincubation assay was performed for 4 h with equal numbers of CP9 and ETEC in IPEC-J2 cells. The relative expression of TNF-α (A), IL-6 (B), IL-8 (C), GM-CSF (D), and IL-10 (E) mRNAs was calculated by real-time PCR. The expression levels of all target genes were calculated relative to the housekeeping gene GAPDH using the 2−ΔΔCT method. The values for the control cells were set to 1. The data are presented as means ± the SEM. Means marked with different letters (a, b, and c) differ significantly (P < 0.05).
FIG 6
FIG 6
Relative gene expression of HDPs in IPEC-J2 cells. A coincubation assay was performed for 4 h with equal numbers of CP9 and ETEC in IPEC-J2 cells. The relative expression of BD3 (A), MUC1 (B), and PG-1 (C) mRNAs was calculated by real-time PCR. The expression levels of all target genes were calculated relative to the housekeeping gene GAPDH using the 2−ΔΔCT method. The values for the control cells were set to 1. The data are presented as means ± the SEM. Means marked with different letters (a, b, and c) differ significantly (P < 0.05).
FIG 7
FIG 7
Relative gene expression of tight-junction genes in IPEC-J2 cells. A coincubation assay was performed for 4 h with equal numbers of CP9 and ETEC in IPEC-J2 cells. The relative expression of claudin-1 (A), occludin (B), and zona occludens-1 (C) mRNAs was calculated by real-time PCR. The expression levels of all target genes were calculated relative to the housekeeping gene GAPDH using the 2−ΔΔCT method. The values for the control cells were set to 1. The data are presented as means ± the SEM. Means marked with different letters (a, b, and c) differ significantly (P < 0.05).
FIG 8
FIG 8
Caspase-3 activity in IPEC-J2 cells. A coincubation assay was performed for 4 h with equal numbers of CP9 and ETEC in IPEC-J2 cells. Cell lysates were collected, and the caspase-3 activity was determined by using caspase-3 colorimetric data. The data are presented as means ± the SEM. Means marked with different letters (a, b, and c) differ significantly (P < 0.05).
FIG 9
FIG 9
Cell proliferation analysis in IPEC-J2 cells. IPEC-J2 cells were stimulated with ETEC for 2 h and then incubated with CP9 in fresh medium for 8 h. Metabolically active cells in proliferation were counted with a CCK-8 kit by measuring the absorbance at 450 nm using a Cytation 5 Cell Imaging Multi-Mode Reader. The data are presented as means ± the SEM. Means marked with different letters (a, b, and c) differ significantly (P < 0.05).
FIG 10
FIG 10
Metabolomic repertoire of IPEC-J2 cells incubated with CP9. Extracellular untargeted metabolomic analyses on the IPEC-J2 cells incubated with CP9, using LC-MS, were performed. (A) PCA scores. Plots are shown with explained variances between the selected PCs. (B) PLS-DA three-dimensional box plot shown with explained variances between the selected PCs. (C) VIP score plot of the important features identified by the PLS-DA model. The colored boxes on the right indicate the relative concentrations of the corresponding metabolite in each group. Statistical analysis was performed using Metaboanalyst (version 5.0) online analysis software with ANOVA testing, with Fisher post hoc analysis plus false discovery rate analysis. Features with P < 0.05 plus a fold change of >2 were considered significant.
FIG 11
FIG 11
CP9-induced metabolic modulation in IPEC-J2 cells. Biochemical pathway analysis was performed on the significant identified metabolite data using Metaboanalyst (version 5.0) online analysis software. (A) Significantly modulated metabolic pathways determined via pathway impact values calculated from pathway topology analysis: 1, alanine, aspartate, and glutamate metabolism; 2, pyrimidine metabolism; 3, nicotinate and nicotinamide metabolism; 4, glutathione metabolism; 5, the citrate cycle (TCA cycle); and 6, arginine and proline metabolism. (B) Pathway enrichment analysis. (C) Heatmap of the significant differentially expressed metabolites.

References

    1. Moeser AJ, Pohl CS, Rajput M. 2017. Weaning stress and gastrointestinal barrier development: implications for lifelong gut health in pigs. Anim Nutr 3:313–321. doi:10.1016/j.aninu.2017.06.003. - DOI - PMC - PubMed
    1. Rhouma M, Fairbrother JM, Beaudry F, Letellier A. 2017. Post weaning diarrhea in pigs: risk factors and non-colistin-based control strategies. Acta Vet Scand 59:31. doi:10.1186/s13028-017-0299-7. - DOI - PMC - PubMed
    1. Bednorz C, Oelgeschläger K, Kinnemann B, Hartmann S, Neumann K, Pieper R, Bethe A, Semmler T, Tedin K, Schierack P, Wieler LH, Guenther S. 2013. The broader context of antibiotic resistance: zinc feed supplementation of piglets increases the proportion of multi-resistant Escherichia coli in vivo. Int J Med Microbiol 303:396–403. doi:10.1016/j.ijmm.2013.06.004. - DOI - PubMed
    1. Larsen C, Lynegaard JC, Pedersen AØ, Kjeldsen NJ, Hansen CF, Nielsen JP, Amdi C. 2021. A reduced CP level without medicinal zinc oxide does not alter the intestinal morphology in weaned pigs 24 days post-weaning. Animal 15:100188. doi:10.1016/j.animal.2021.100188. - DOI - PubMed
    1. Suchodolski JS, Jergens AE. 2016. Recent advances and understanding of using probiotic-based interventions to restore homeostasis of the microbiome for the prevention/therapy of bacterial diseases. Microbiol Spectr 4. doi:10.1128/microbiolspec.VMBF-0025-2015. - DOI - PubMed

Publication types

MeSH terms