. 2022 Jun 7;12(6):528.
doi: 10.3390/metabo12060528.

A Quantitative Systems Pharmacology Platform Reveals NAFLD Pathophysiological States and Targeting Strategies

Affiliations

A Quantitative Systems Pharmacology Platform Reveals NAFLD Pathophysiological States and Targeting Strategies

Daniel E Lefever et al. Metabolites. .

Abstract

Non-alcoholic fatty liver disease (NAFLD) has a high global prevalence with a heterogeneous and complex pathophysiology that presents barriers to traditional targeted therapeutic approaches. We describe an integrated quantitative systems pharmacology (QSP) platform that comprehensively and unbiasedly defines disease states, in contrast to just individual genes or pathways, that promote NAFLD progression. The QSP platform can be used to predict drugs that normalize these disease states and experimentally test predictions in a human liver acinus microphysiology system (LAMPS) that recapitulates key aspects of NAFLD. Analysis of a 182 patient-derived hepatic RNA-sequencing dataset generated 12 gene signatures mirroring these states. Screening against the LINCS L1000 database led to the identification of drugs predicted to revert these signatures and corresponding disease states. A proof-of-concept study in LAMPS demonstrated mitigation of steatosis, inflammation, and fibrosis, especially with drug combinations. Mechanistically, several structurally diverse drugs were predicted to interact with a subnetwork of nuclear receptors, including pregnane X receptor (PXR; NR1I2), that has evolved to respond to both xenobiotic and endogenous ligands and is intrinsic to NAFLD-associated transcription dysregulation. In conjunction with iPSC-derived cells, this platform has the potential for developing personalized NAFLD therapeutic strategies, informing disease mechanisms, and defining optimal cohorts of patients for clinical trials.

Keywords: CMap; MAFLD; MPS; NAFLD; NASH; QSP; connectivity map; drug combinations; drug discovery; drug repurposing; fibrosis; liver; lobular inflammation; metabolic-associated fatty liver disease; microphysiology systems; network proximity; non-alcoholic fatty liver disease; non-alcoholic steatohepatitis; quantitative systems pharmacology; steatosis; targeting disease states.


Conflict of interest statement

D.L.T., A.G. and L.A.V. are the co-inventors and owners (TaylorGoughVernetti, LLP) of a patent on the construction and use of the biomimetic liver MPS. D.L.T. and A.G. are cofounders of BioSystics, Inc., a company developing patient digital twins starting with accessing, analyzing, and computationally modeling data on patient-derived microphysiology systems. Their interests are managed by the Conflict-of-Interest Office at the University of Pittsburgh, USA, in accordance with their policies. A.S.-G. is a co-founder, and D.L.T. is an advisor for Von Baer Wolff, Inc., a company focused on biofabrication of autologous human hepatocytes using stem cell technology. A.S.-G. is a co-founder of and owns stock in Pittsburgh ReLiver Inc., a company focused on genetic reprogramming to overcome liver failure. He is a coinventor on a patent application that describes the use of transcription factors to treat chronic liver failure and on a patent application related to methods to enhance hepatic functions in failing human livers. The other authors declared no potential conflicts of interest with respect to the research, authorship, and/or publication of this article.

Figures

Figure 3
Figure 3
Distribution of differentially enriched pathways and their respective KEGG groups and NAFLD categories among the pairwise cluster comparisons defined in Figure 2. The number of differentially enriched pathways identified between the PLI vs. N&S, PF vs. N&S, and PF vs. PLI pairwise comparisons were 59, 125, and 50, respectively (adj. p-value < 0.001). Their distribution (and percent contribution) with respect to KEGG groups (A) and NAFLD categories (B) are detailed in Table S3 and Data file S1. The top ten differentially enriched pathways for each comparison (ranked by the FDR adjusted p-values through the linear modeling equivalent of a two-sample, moderated t-test) are shown along with their association (black circles) with NAFLD categories C1–4 (as indicated and defined in the Main Text) (C). The colors of the bars represent the directionality and relative enrichment of each pathway for each of the pairwise comparisons.
Figure 4
Figure 4
Unbiased machine learning model of patient transcriptomic data identifies and predicts congruent clinical phenotypes within LAMPS. (A) The bootstrapping procedure used to develop and validate the transcriptome-based machine learning model (MLENet) capable of differentiating and predicting 4 NAFLD patient classifications (see Methods) (red indicates the clinically defined true positives). The average sensitivity across the bootstrapping instances (numbers in parenthesis are standard deviations) are: 0.66 (0.11), 0.64 (0.12), 0.77 (0.08), 0.93 (0.07); average specificity 0.93 (0.03), 0.83 (0.03), 0.98 (0.02), 0.95 (0.03) for normal, steatosis, Lob, and fibrosis, respectively. (B) The workflow and table of outcomes from implementing MLENet to identify and predict congruent NAFLD patient phenotypes from LAMPS transcriptomic analytes generated under normal fasting (NF); early metabolic syndrome (EMS); or late metabolic syndrome (LMS) conditions (see Methods). The phenotype matching of LAMPS to patients results from extensive parallel biochemical and imaging analyses [41], indicating that the three different media conditions drive distinct phenotypes congruent with clinical phenotypes of NAFLD progression and are independently consistent with the machine learning approach.
Figure 5
Figure 5
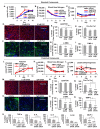
Control and predicted drugs reduce different NAFLD disease phenotypes in LAMPS models treated with EMS media. LAMPS models were maintained for 10 days in Early Metabolic Syndrome (EMS) media containing either vehicle control, 10 µM obeticholic acid (OCA) and 30 µM Pioglitazone (PGZ) [standard compounds], or vorinostat (suberoylanilide hydroxamic acid; SAHA) at 1.7 µM or 5 µM [predicted compounds]. A panel of metrics was examined to monitor disease-specific phenotypes. For standard drugs, albumin, blood urea nitrogen, and lactate dehydrogenase curves throughout the time course show similar profiles throughout the time course between vehicle and drug treatment groups, suggesting no overt model cytotoxicity or loss of function (AC). At the day 6 timepoint, there was a significant increase in albumin secretion in the OCA group; however, no further significant increases in albumin output were observed at later time points (days 8 and 10). At day 10, there was a significant decrease in steatosis (D,E; LipidTOXTM intensity) and stellate cell activation (F,G; α-SMA intensity) for both OCA and PGZ groups compared to vehicle. Panels (D,F) display representative 20X image Day 10 LipidTOXTM (D) and α-SMA (F) images of LAMPS. Scale bar; 50 μm. There was no significant change in the secreted levels of the pro-fibrotic markers Pro-Col 1a1 (H) TIMP-1 (I) in either treatment group compared to vehicle. For the predicted drug vorinostat (SAHA), albumin and blood urea nitrogen curves show no significant differences between vehicle and treatment groups (J,K), suggesting that these drug treatments do not result in loss of model functionality; however, a significant decrease in LDH secretion (L) at days 8 and 10 in the 5 µM vorinostat treatment group, suggesting decreased cytotoxicity. This was further supported by the significant decrease in stellate cell activation (O,P; α-SMA intensity), production of the pro-fibrotic markers pro-collagen 1a1 and TIMP-1 (Q,R), and inflammatory cytokine production (S) observed in the vorinostat group. In contrast, vorinostat does not reduce lipid accumulation compared to vehicle control (M,N), indicating no effect on steatosis. Panels (M,O) display representative 20X image Day 10 LipidTOXTM (D) and α-SMA images of LAMPS under each treatment condition. Scale bar; 50 μm. For each control and drug treatment group, n = 3 chips were analyzed and plotted ± SEM for each assay and statistical significance was assessed using a One-Way ANOVA with Tukey’s test (* p < 0.05; ** p < 0.01; *** p < 0.001; **** p < 0.0001).
Figure 6
Figure 6
Pioglitazone and vorinostat used in combination result in the reduction of steatosis and stellate cell activation as well as the secretion of pro-fibrotic markers and production of inflammatory cytokines in LAMPS models treated with EMS media. LAMPS models were maintained for 10 days in NAFLD disease media containing combinations of pioglitazone (30 µM) and vorinostat (1.7 µM or 5 µM) or DMSO vehicle control. A panel of metrics was examined to monitor disease-specific phenotypes under these treatment conditions. While albumin secretion profiles show no significant differences between vehicle and drug treatment groups, suggesting that these drug combinations do not result in loss of model functionality (A), a significant increase in urea nitrogen secretion is observed in both drug combination groups compared to control, suggesting increased model metabolic activity (B). In addition, like the LDH profile in Figure 5, there is a significant decrease in LDH secretion (C) in the 5 µM vorinostat treatment group, suggesting a reduction in cytotoxicity. Compared to the contrasting effects observed in the individual drug testing studies shown in Figure 5, we observe an overall decrease in both lipid accumulation (D,E) and stellate cell activation (F,G), as well as in the production of the pro-fibrotic markers pro-collagen 1a1 and TIMP-1 (H,I) and inflammatory cytokine production (J) when pioglitazone and vorinostat are used in combination. Panels (D,F) display representative 20X image Day 10 LipidTOXTM (D) and α-SMA (F) images of LAMPS under each treatment condition. Scale bar; 50 μm. For each control and drug treatment group, n = 3 chips were analyzed and plotted ± SEM for each assay and statistical significance was assessed using a One-Way ANOVA with Tukey’s test (* p < 0.05; ** p < 0.01; *** p < 0.001; **** p < 0.0001).
Figure 1
Figure 1
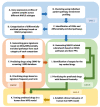
Workflow associating NAFLD subtypes with gene expression signatures to computationally predict and prioritize drugs for testing in a patient-derived microphysiological model of disease progression. Four integrated units are shown, each comprised of a set of steps detailed in the Methods and Results. Unit 1A–D identifies and clusters individual patient hepatic gene expression and enriched pathway profiles associated with clinical subtypes and categorizes the differentially enriched pathways among these clusters (Figure 2 and Figure 3; Tables S2 and S3, and Data files S1 and S2) within our current framework of NAFLD pathophysiology [2,5]. The rationale is presented in the Results for using clusters based on individual patient pathway enrichment profiles as an alternative to the clinical classifications (compare Figure 3, Figures S1 and S2) for determining both differentially expressed genes and enriched pathways between different stages of disease progression. Unit 2E–G generates disease progression-based gene expression signatures (Table S4; Data file S3) and, using the Connectivity Map (CMap) databases, identifies drugs that can normalize these signatures (Table 1 and Table S5; and Data files S4 and S5). The highly integrative Unit 3 H-J maps known protein targets of the predicted drugs from Unit 2 to an NAFLD subnetwork encompassing protein targets from the gene expression analysis within Unit 1 (Figure S6; Table S7, and Data file S6). A network proximity score is then calculated that helps prioritize candidate drugs identified by CMap analysis for experimental testing based on the proximity of their targets to the NAFLD subnetwork (Table S8; Data file S7). In Unit 4K, the effects of the prioritized drugs on a diverse set NAFLD–associated biomarkers in a human MPS, independently shown to recapitulate critical aspects of NAFLD progression (Unit 4L) (Figure 4, Figures S4 and S5), are determined (Figure 5 and Figure 6). Table S1 provides an index of tables, figures, and data files associated with each step.
Figure 2
Figure 2
Individual patient liver transcriptome analysis yields distinct clusters based on their Kyoto Encyclopedia of Genes and Genomes (KEGG) pathway enrichment profiles. The heatmap shows the hierarchical clustering of the liver KEGG pathway enrichment profiles (columns) from individual patients, determined by RNA sequencing and gene set variation analysis (GSVA) using MSigDB v7.0 C2 KEGG pathways [24] (see Methods). Pathways (rows) are grouped according to the top-level KEGG hierarchical classifications (labeled along the left ordinate) to which they belong. The color represents the enrichment score (ES; see the color-coded bar under the heatmap), which reflects the degree to which a pathway is over- or under-represented within that individual patient sample (see [25]). The plots above the heatmap show the patient metadata: the top two bars indicate the color-coded diagnosis (see panel on the right) and patient sex, the third indicates if the patient has been diagnosed with type 2 diabetes (T2D) (black bars), and the additional two plots show the body mass index (BMI) and age of the patient. The clinical subtype distribution for each of the three clusters (PN&S, PLI, PF) is shown in Table S2. More details on this analysis, including the specific pathway information and patient metadata, can be found in the associated R notebooks [26].

References

    1. Eslam M., Sanyal A.J., George J. MAFLD: A Consensus-Driven Proposed Nomenclature for Metabolic Associated Fatty Liver Disease. Gastroenterology. 2020;158:1999–2014. doi: 10.1053/j.gastro.2019.11.312. - DOI - PubMed
    1. Friedman S.L., Neuschwander-Tetri B.A., Rinella M., Sanyal A.J. Mechanisms of NAFLD development and therapeutic strategies. Nat. Med. 2018;24:908–922. doi: 10.1038/s41591-018-0104-9. - DOI - PMC - PubMed
    1. Loomba R., Friedman S.L., Shulman G.I. Mechanisms and disease consequences of nonalcoholic fatty liver disease. Cell. 2021;184:2537–2564. doi: 10.1016/j.cell.2021.04.015. - DOI - PubMed
    1. Hardy T., Oakley F., Anstee Q.M., Day C.P. Nonalcoholic Fatty Liver Disease: Pathogenesis and Disease Spectrum. Annu. Rev. Pathol. Mech. Dis. 2016;11:451–496. doi: 10.1146/annurev-pathol-012615-044224. - DOI - PubMed
    1. Sanyal A.J. Past, present and future perspectives in nonalcoholic fatty liver disease. Nat. Rev. Gastroenterol. Hepatol. 2019;16:377–386. doi: 10.1038/s41575-019-0144-8. - DOI - PubMed