. 2022 Jun 14;12(6):543.
doi: 10.3390/metabo12060543.

The Distribution of Major Brain Metabolites in Normal Adults: Short Echo Time Whole-Brain MR Spectroscopic Imaging Findings

Affiliations

The Distribution of Major Brain Metabolites in Normal Adults: Short Echo Time Whole-Brain MR Spectroscopic Imaging Findings

Xinnan Li et al. Metabolites. .

Abstract

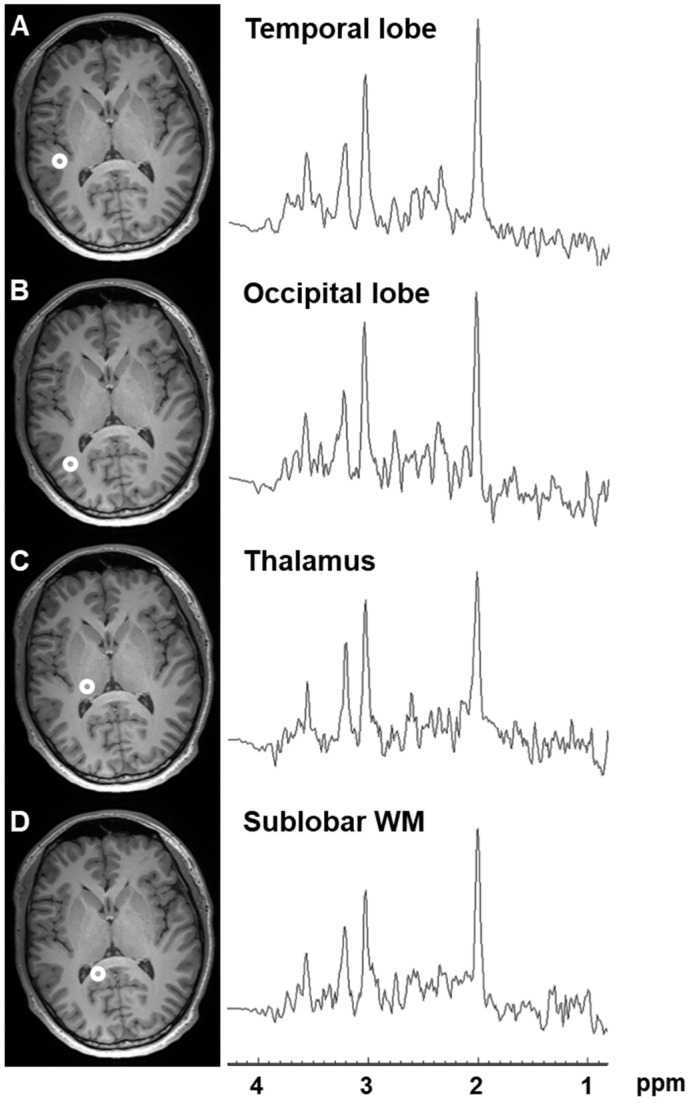
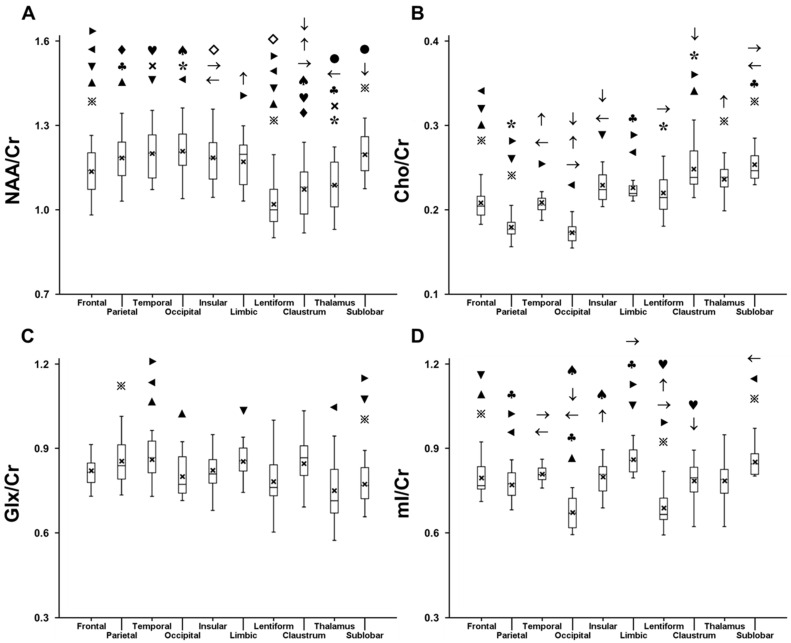
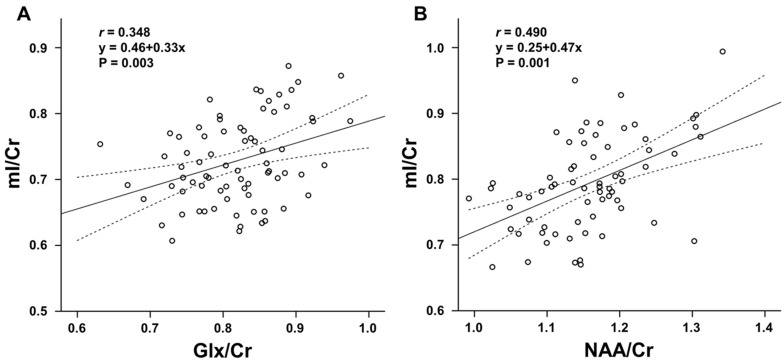
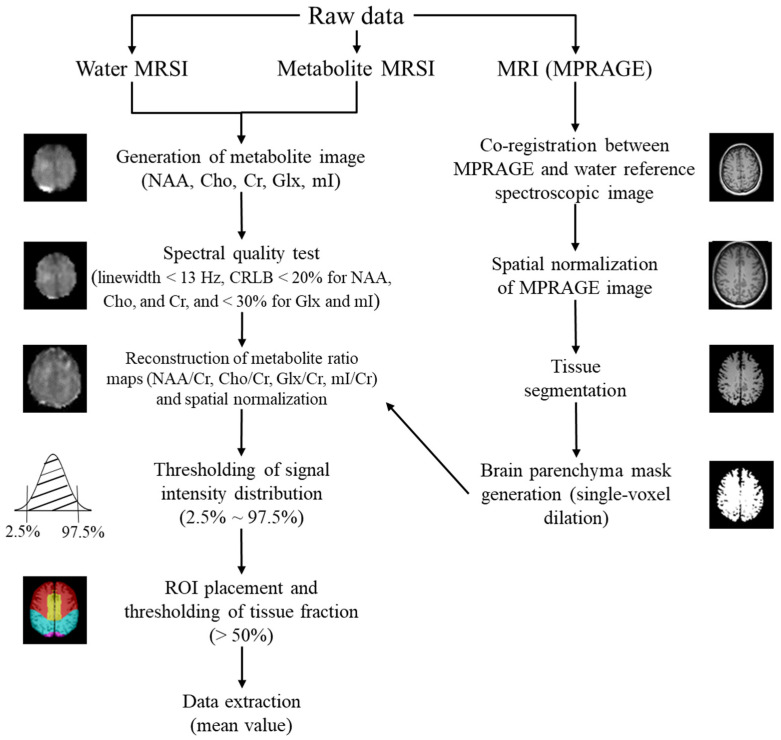
This prospective study aimed to evaluate the variation in magnetic resonance spectroscopic imaging (MRSI)-observed brain metabolite concentrations according to anatomical location, sex, and age, and the relationships among regional metabolite distributions, using short echo time (TE) whole-brain MRSI (WB-MRSI). Thirty-eight healthy participants underwent short TE WB-MRSI. The major metabolite ratios, i.e., N-acetyl aspartate (NAA)/creatine (Cr), choline (Cho)/Cr, glutamate + glutamine (Glx)/Cr, and myoinositol (mI)/Cr, were calculated voxel-by-voxel. Their variations according to anatomical regions, sex, and age, and their relationship to each other were evaluated by using repeated-measures analysis of variance, t-tests, and Pearson’s product-moment correlation analyses. All four metabolite ratios exhibited widespread regional variation across the cerebral hemispheres (corrected p < 0.05). Laterality between the two sides and sex-related variation were also shown (p < 0.05). In several regions, NAA/Cr and Glx/Cr decreased and mI/Cr increased with age (corrected p < 0.05). There was a moderate positive correlation between NAA/Cr and mI/Cr in the insular lobe and thalamus and between Glx/Cr and mI/Cr in the parietal lobe (r ≥ 0.348, corrected p ≤ 0.025). These observations demand age- and sex- specific regional reference values in interpreting these metabolites, and they may facilitate the understanding of glial-neuronal interactions in maintaining homeostasis.

Keywords: echo-planar; magnetic resonance spectroscopic imaging; metabolite; whole-brain.


Conflict of interest statement

Yuta Urushibata is an employee of Siemens Healthcare K.K., and Sinyeob Ahn is an employee of Siemens Healthineers. The other authors declare no conflict of interest.

Figures

Figure 1
Figure 1
The representative single-voxel spectra obtained from the left (A) temporal lobe, (B) occipital lobe, (C) thalamus, and (D) sublobar white matter of WB-MRSI of a 25-year-old male. The voxel locations are shown on the T1-weighted 3D magnetization-prepared rapid acquisition gradient echo (MPRAGE) images.
Figure 2
Figure 2
Box and whisker plots showing the region-specific mean (cross mark), median, interquartile range, minimum, and maximum for (A) N-acetyl acetylaspartate (NAA)/creatine (Cr), (B) choline (Cho)/Cr, (C) glutamate + glutamine (Glx)/Cr, and (D) myoinositol (mI)/Cr (Abbreviations: frontal = frontal lobe, parietal = parietal lobe, temporal = temporal lobe, occipital = occipital lobe, insula = insular lobe, limbic = limbic lobe, lentiform = lentiform nucleus, sublobar = sublobar white matter). Each symbol indicates pairs with statistical significance (i.e., p < 0.05 following correction for multiple comparisons). For example, as indicated by ▶, NAA/Cr is different among the frontal lobe, limbic lobe, and lentiform nucleus.
Figure 3
Figure 3
Scatterplots showing the correlation between (A) glutamate + glutamine (Glx)/creatine (Cr) and myoinositol (mI)/Cr of the parietal lobe (r = 0.348), (B) N-acetylaspartate (NAA)/Cr and mI/Cr of the insular lobe (r = 0.490). The straight line indicates the mean and the dotted lines 95% confidence interval. These correlations are statistically significant at corrected p < 0.05 (Pearson’s product-moment correlation analyses).
Figure 4
Figure 4
Scheme summarizing the processing steps (Abbreviations: CRLB = Cramer-Rao lower bound, MRSI = Magnetic resonance spectroscopic imaging, MPRAGE = T1-weighted 3D magnetization-prepared rapid acquisition gradient echo, NAA = N-acetylaspartate, Cho = choline, Cr = creatine, Glx = glutamate + glutamine, mI = myoinositol).
Figure 5
Figure 5
The outline of the regions of interest (ROIs) overlaid on the axial sections of normalized T1-weighted 3D magnetization-prepared rapid acquisition gradient echo (MPRAGE) images of a participant. Each ROI is placed on the either side of the frontal lobe (1); parietal lobe (2); temporal lobe (3); occipital lobe (4); insular lobe (5); limbic lobe (6); caudate (7) and lentiform nuclei (8); claustrum (9); thalamus (10); sublobar white matter (11) containing corpus callosum, external and internal capsules, and periventricular white matter; midbrain (12); pons (13); and cerebellar hemispheres (14).

Similar articles

Cited by

References

    1. Oz G., Alger J.R., Barker P.B., Bartha R., Bizzi A., Boesch C., Bolan P.J., Brindle K.M., Cudalbu C., Dinçer A., et al. Clinical proton MR spectroscopy in central nervous system disorders. Radiology. 2014;270:658–679. doi: 10.1148/radiol.13130531. - DOI - PMC - PubMed
    1. Castillo M., Kwock L., Green C. MELAS syndrome: Imaging and proton MR spectroscopic findings. AJNR Am. J. Neuroradiol. 1995;16:233–239. - PMC - PubMed
    1. Takahashi S., Oki J., Miyamoto A., Okuno A. Proton magnetic resonance spectroscopy to study the metabolic changes in the brain of a patient with Leigh syndrome. Brain Dev. 1999;21:200–204. doi: 10.1016/S0387-7604(98)00095-3. - DOI - PubMed
    1. Maudsley A.A., Andronesi O.C., Barker P.B., Bizzi A., Bogner W., Henning A., Nelson S.J., Posse S., Shungu D.C., Soher B.J. Advanced magnetic resonance spectroscopic neuroimaging: Experts’ consensus recommendations. NMR Biomed. 2021;34:e4309. doi: 10.1002/nbm.4309. - DOI - PMC - PubMed
    1. Bogner W., Otazo R., Henning A. Accelerated MR spectroscopic imaging—A review of current and emerging techniques. NMR Biomed. 2021;34:e4314. doi: 10.1002/nbm.4314. - DOI - PMC - PubMed

LinkOut - more resources