. 2022 Jun 6;8(3):42.
doi: 10.3390/ncrna8030042.

CRISPR/CasRx-Mediated RNA Knockdown Reveals That ACE2 Is Involved in the Regulation of Oligodendroglial Cell Morphological Differentiation

Affiliations

CRISPR/CasRx-Mediated RNA Knockdown Reveals That ACE2 Is Involved in the Regulation of Oligodendroglial Cell Morphological Differentiation

Yukino Kato et al. Noncoding RNA. .

Abstract

Angiotensin-converting enzyme 2 (ACE2) plays a role in catalyzing angiotensin II conversion to angiotensin (1-7), which often counteracts the renin-angiotensin system. ACE2 is expressed not only in the cells of peripheral tissues such as the heart and kidney, but also in those of the central nervous system (CNS). Additionally, ACE2 acts as the receptor required for the entry of severe acute respiratory syndrome coronavirus 2 (SARS-CoV-2), whose binding leads to endocytotic recycling and possible degradation of the ACE2 proteins themselves. One of the target cells for SARS-CoV-2 in the CNS is oligodendrocytes (oligodendroglial cells), which wrap neuronal axons with their differentiated plasma membranes called myelin membranes. Here, for the first time, we describe the role of ACE2 in FBD-102b cells, which are used as the differentiation models of oligodendroglial cells. Unexpectedly, RNA knockdown of ACE2 with CasRx-mediated gRNA or the cognate siRNA promoted oligodendroglial cell morphological differentiation with increased expression or phosphorylation levels of differentiation and/or myelin marker proteins, suggesting the negative role of ACE2 in morphological differentiation. Notably, ACE2's intracellular region preferentially interacted with the active GTP-bound form of Ras. Thus, knockdown of ACE2 relatively increased GTP-bound Ras in an affinity-precipitation assay. Indeed, inhibition of Ras resulted in decreasing both morphological differentiation and expression or phosphorylation levels of marker proteins, confirming the positive role of Ras in differentiation. These results indicate the role of ACE2 itself as a negative regulator of oligodendroglial cell morphological differentiation, newly adding ACE2 to the list of regulators of oligodendroglial morphogenesis as well as of Ras-binding proteins. These findings might help us to understand why SARS-CoV-2 causes pathological effects in the CNS.

Keywords: ACE2; Ras; differentiation; oligodendrocyte; oligodendroglial cell.


Conflict of interest statement

The authors declare no conflict of interest.

Figures

Figure 1
Figure 1
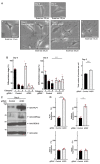
Knockdown of ACE2 by siRNA promotes oligodendroglial cell morphological differentiation. (A,B) FBD-102b cells were transfected with control or ACE2 siRNA and were allowed to be differentiated for 0 or 3 days. Differentiation efficiencies were divided into three categories and depicted in graphs (**, p < 0.01; n = 5 fields). Category 1 included cells with fewer than two primary branches; Category 2 included cells with fewer than three primary branches and without secondary branches; and Category 3 included cells with more than three primary branches and with secondary branches as well as with widespread membranes. Category 1 was considered to be the phenotypes before differentiation, whereas Category 3 was considered to be the differentiated phenotypes. Category 2 corresponded to these intermediate phenotypes. The number of branches in cells is also counted and shown (**, p < 0.01; n = 50 cells). (C,D) Cells at 3 days following the induction of differentiation were collected, lysed, and immunoblotted with an antibody against PLP1, CNPase, SOX10, or actin. Immunoreactive band intensities were also compared to be depicted in graphs (**, p < 0.01 and *, p < 0.05; n = 3 blots).
Figure 2
Figure 2
Knockdown of ACE2 by gRNA promotes oligodendroglial cell morphological differentiation. (A,B) FBD-102b cells were transfected with the plasmids encoding ACE2 gRNA with CasRx or control plasmids and were allowed to be differentiated for 0 or 3 days. Differentiation efficiencies were divided into three categories and depicted in graphs (**, p < 0.01; n = 5 fields). The number of branches in cells is also counted and shown (**, p < 0.01; 50 cells). (C,D) Cells at 3 days following the induction of differentiation were collected, lysed, and immunoblotted with an antibody against PLP1, CNPase, SOX10, or actin. Band intensities were also compared to be depicted in graphs (**, p < 0.01 and *, p < 0.05; n = 3 blots).
Figure 3
Figure 3
Knockdown of ACE2 promotes Akt1 phosphorylation whose site is essential for Akt1 activation. (A) The lysates of siRNA-knocked down FBD-102b cells were used for immunoblotting with an anti-phosphorylated (phospho) Akt1 or Akt1. These two different blots were performed from the same samples. Band intensities were also compared to be depicted in graphs (**, p < 0.01; n = 3 blots). (B) The lysates of gRNA-knocked down cells were used for immunoblotting with an anti-phosphorylated (phospho) Akt1 or Akt1. These two different blots were performed from the same samples. Band intensities were also compared to be depicted in graphs (**, p < 0.01; n = 3 blots).
Figure 4
Figure 4
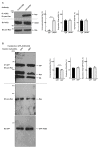
The intracellular domains of ACE2 interacts with Ras. (A) The lysates of FBD-102b cells were immunoprecipitated with an anti-ACE2 IgG or control IgG and then immunoblotted with an anti-Ras (pan-Ras) antibody. Total ACE2 and Ras proteins were also shown to confirm whether their expression levels are comparable. Band intensities were also compared to be depicted in graphs (**, p < 0.01; n = 3 blots). (B) The lysates of cells transfected with the plasmid encoding GFP-tagged ACE2 intracellular domain (ICD) were immunoprecipitated with an anti-GFP antibody in the presence of 1 μM of GTP or GDP and then immunoblotted with an anti-Ras antibody. Total Ras and GFP-tagged proteins were also shown to confirm whether their expression levels are comparable. IgH and IgL indicate the probable heavy and light chains of immune globulins for immunoprecipitation experiments, respectively. Band intensities were also compared to be depicted in graphs (**, p < 0.01; n = 3 blots).
Figure 5
Figure 5
Knockdown of ACE2 promotes the GTP-bound form of Ras in affinity-precipitation assay. (A) The lysates of siRNA-knocked down FBD-102b cells were used for affinity-precipitation (AP) assay, monitoring activated GTP-bound Ras with Ras-binding domain (RBD). Total Ras proteins were also shown. Band intensities were also compared to be depicted in graphs (**, p < 0.01; n = 3 blots). (B) The lysates of gRNA-knocked down cells were used for affinity-precipitation assay to monitor active GTP-bound Ras. Total Ras proteins were also shown. Band intensities were also compared to be depicted in graphs (**, p < 0.01; n = 3 blots).
Figure 6
Figure 6
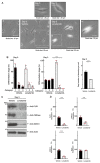
Ras inhibition inhibits oligodendroglial cell morphological differentiation. (A,B) FBD-102b cells were treated with vehicle or Lanafamib (5 μM) and were allowed to be differentiated for 0 or 3 days. Differentiation efficiencies were divided into three categories and depicted in graphs (**, p < 0.01; n = 5 fields). The number of branches in cells is also counted and shown (**, p < 0.01; 50 cells). (C,D) Cells at 3 days following the induction of differentiation were collected, lysed, and immunoblotted with an antibody against PLP1, CNPase, SOX10, or actin. Immunoreactive band intensities were also compared to be depicted in graphs (**, p < 0.01; n = 3 blots).
Figure 7
Figure 7
Ras inhibition decreases Akt1 phosphorylation. The lysates of vehicle or Lanafamib-treated FBD-102b cells were used for immunoblotting with an anti-phosphorylated (phospho) Akt1 or Akt1. These two different blots were performed from the same samples. Band intensities were also compared to be depicted in graphs (**, p < 0.01; n = 3 blots).
Figure 8
Figure 8
Schematic diagram of the relationship of the ACE2 and Ras signaling with morphological differentiation in FBD-102b cells. ACE2, acting through capturing Ras·GTP, inhibits oligodendroglial cell morphological differentiation (A), whereas ACE2 knockdown stimulates morphological differentiation through a possible pathway linking to Akt kinase (B).

Similar articles

Cited by

References

    1. Simons M., Lyons D.A. Axonal selection and myelin sheath generation in the central nervous system. Curr. Opin. Cell Biol. 2013;25:512–519. doi: 10.1016/j.ceb.2013.04.007. - DOI - PubMed
    1. Morton P.D., Ishibashi N., Jonas R.A., Gallo V. Congenital cardiac anomalies and white matter injury. Trends Neurosci. 2015;38:353–363. doi: 10.1016/j.tins.2015.04.001. - DOI - PMC - PubMed
    1. Abu-Rub M., Miller R.H. Emerging cellular and molecular strategies for enhancing central nervous system (CNS) remyelination. Brain Sci. 2018;8:111. doi: 10.3390/brainsci8060111. - DOI - PMC - PubMed
    1. Nave K.-A., Werner H.B. Ensheathment and Myelination of Axons: Evolution of Glial Functions. Annu. Rev. Neurosci. 2021;44:197–219. doi: 10.1146/annurev-neuro-100120-122621. - DOI - PubMed
    1. Danilczyk U., Penninger J.M. Angiotensin-converting enzyme II in the heart and the kidney. Circ. Res. 2006;98:463–471. doi: 10.1161/01.RES.0000205761.22353.5f. - DOI - PubMed

LinkOut - more resources