Structural mechanism underpinning Thermus oshimai Pif1-mediated G-quadruplex unfolding
- PMID: 35736675
- PMCID: PMC9253758
- DOI: 10.15252/embr.202153874
Structural mechanism underpinning Thermus oshimai Pif1-mediated G-quadruplex unfolding
Abstract
G-quadruplexes (G4s) are unusual stable DNA structures that cause genomic instability. To overcome the potential barriers formed by G4s, cells have evolved different families of proteins that unfold G4s. Pif1 is a DNA helicase from superfamily 1 (SF1) conserved from bacteria to humans with high G4-unwinding activity. Here, we present the first X-ray crystal structure of the Thermus oshimai Pif1 (ToPif1) complexed with a G4. Our structure reveals that ToPif1 recognizes the entire native G4 via a cluster of amino acids at domains 1B/2B which constitute a G4-Recognizing Surface (GRS). The overall structure of the G4 maintains its three-layered propeller-type G4 topology, without significant reorganization of G-tetrads upon protein binding. The three G-tetrads in G4 are recognized by GRS residues mainly through electrostatic, ionic interactions, and hydrogen bonds formed between the GRS residues and the ribose-phosphate backbone. Compared with previously solved structures of SF2 helicases in complex with G4, our structure reveals how helicases from distinct superfamilies adopt different strategies for recognizing and unfolding G4s.
Keywords: G-quadruplexes; G4-Recognizing Surface; ToPif1; X-ray; structures.
© 2022 The Authors.
Figures

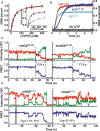
- A
Comparison of the binding activity of ToPif1 for different configurations of antiparallel (G4Tel, black points) and parallel (G4CEB, red points) G4s. (Insert: Comparison of the binding activity of ToPif1 to single‐stranded DNA (T12, black points) with G4Tel, red points), the blue points represent the double‐strand DNA (D24)). The binding activity was measured using steady‐state fluorescence anisotropy assays; 5 nM of fluorescein‐labeled DNA substrate and 0.5 mM ADP·AlF4 were titrated with increasing protein concentrations at 37 °C. The different binding curves represent an average of three to four independent experiments for each substrate with standard deviations. The solid line represents the fit of data according to equation (1).
- B
Stopped‐flow DNA unwinding kinetics of ToPif1 for different configurations of G4 DNA (G4AP‐424, 4G4AP‐333, G4P‐214) under multiple turnover conditions. All curves represent the average of at least 10 individual traces and the plots are representative of three independent experiments. 4 nM G4 DNA and 100 nM ToPif1 were used under experimental conditions as described in ‘Materials and Method’.
- C, D
The typical smFRET trajectories of antiparallel (smG4AP‐424, sm4G4AP‐333) and parallel (smG4P‐111) G4 unwinding catalyzed by 50 nM ToPif1 and 150 μM ATP. Black arrows in the solid style indicate the time of adding proteins. Dashed arrows in black represent the unwinding time of ToPif1 with different G4 DNA substrates.

Overall structure of ToPif1‐G4T6/T8‐ADP·AlF4 ternary complex in cartoon mode with the conserved domains 1A (green), 1B (orange), 2A (pink), 2B (blue), and C‐terminal (CTD, brown). G4 DNA (G4T6/T8) is colored in red and ADP·AlF4 is shown as a black stick. ToPif1 molecules binding at the 5′‐ and 3′‐ends of G4 DNA are labeled as molecule a and molecule b, respectively.
Surface view after cutting the crystal structure ToPif1‐G4T6/T8‐ADP·AlF4 ternary complex and the domains are colored as in (A).
Structural superposition for the structures of molecules a and b with the mass centers of domain 2B shown as a sphere (mass centers of molecules a colored in blue and that of molecules b colored in cyan).
Comparison of G4T6/T8 (red) in the ToPif1 ternary complex, G4Myc (PDB: 5VHE; Chen et al, 2018) colored in cyan and G4 ‘T‐loops’ (PDB: 6LDM; Traczyk et al, 2020) colored in yellow.
Residues of the molecule a that interact with G4 layers in the ToPif1‐G4T6/T8‐ADP·AlF4 ternary complex; G4 DNA (G4T6/T8) is shown in red and the interacting residues are represented as sticks.

CD experiments of G4 DNA.
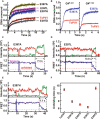
Left panel: DNA binding of ToPif1 to G4CEB with 1 μM T12 (black line) or 1 μM G4CEB (blue line) or none of them (red line). The binding of fitting of the data to the equation (1) yields a K d,app value for ToPif1‐G4CEB of 30.30 ± 1.17 nM, a K d,app value for ToPif1‐G4CEB (added with 1 μM T12) of 30.91 ± 2.32 nM. Right panel: DNA binding of ToPif1 to T12 with 1 μM G4CEB (red line) or 1 μM T12 (blue line) or none of them (black line). Fitting of the data to the equation (1) yields a K d,app value for ToPif1‐T12 of 29.10 ± 0.53 nM, a K d,app value for ToPif1‐T12 (added with 1 μM G4CEB) of 26.50 ± 0.71 nM. DNA binding assays were carried out in buffer A (25 mM Tris–HCl (pH 7.5), 50 mM NaCl, 2 mM MgCl2, and 2 mM DTT) with 0.5 mM ADP·AlF4.
Stopped‐flow unwinding kinetic curves of ToPif1 unwinding G4 DNA (G4AP‐424, G4P‐214, 4G4AP‐333) in buffer A with 1 mM ADP·AlF4.
CD analysis of G4AP‐424 and G4P‐214.
Normalized melting curves from CD melting assays for G4AP‐424 and G4P‐214 at different temperatures (20–75 °C).
Cartoon representation of ToPif1 (molecule a) with G4T6/T8 in the presence of ADP·AlF4 shown as a black stick and loop3 highlighted in magenta.
Cartoon representation of ToPif1‐dT15‐ADP·AlF4 (PDB: 6S3 M; Dai et al, 2021) with ADP·AlF4 shown as a black stick and loop3 highlighted in magenta.
Cartoon representation of BaPif1‐dT10‐ ADP·AlF4 (PDB: 5FHE; Zhou et al, 2016) with ADP·AlF4 shown as a black stick and loop3 highlighted in magenta.
Cartoon representation of ScPif1p‐poly (G3T5)‐ADP·AlF4 (PDB: 5O6B; Lu et al, 2018) with ADP·AlF4 shown as a black stick and loop3 highlighted in magenta.

Cartoon representation of molecule a in the ToPif1‐G4T6/T8‐ADP·AlF4 structure with domain 2B and the center mass (sphere) of domain 2B is highlighted in blue. G‐quadruplex (G4) DNA is shown in red.
Cartoon representation of the ToPif1‐S7D11‐ADP·AlF4 structure (PDB: 6S3H; Dai et al, 2021) with domain 2B shown in magenta. The center mass of domain 2B is shown as a red sphere.
Superposition on domain 1A of the structures in (A) and (B).
Domain 2B and G4 DNA of molecule a in the ToPif1‐G4T6/T8‐ADP·AlF4 structure with the close‐up view of interactions between ToPif1 and the G4 tetrad I.
Domain 2B and modeled duplex DNA in the ToPif1‐S7D11‐ADP·AlF4 structure (PDB: 6S3H; Dai et al, 2021).
Superposition on domain 1A of the structure in (C) with only domain 2B and G4 DNA being shown.

Fit curve of the SAXS data of ToPif1‐ G4T6/T8‐ADP·AlF4 with two modeled ToPif1 molecules bound to the substrate G4T6/T8 calculated with Crysol.
The model of ToPif1‐G4T6/T8‐ADP·AlF4 superimposed on the ab initio envelope calculated with DAMMIF.
The SAXS Model of ToPif1‐G4T6/T8 ‐ADP·AlF4.
Crystal structure of ToPif1‐G4T6/T8 ‐ADP·AlF4.
Superposition for SAXS model and crystal structure of ToPif1‐G4T6/T8‐ADP·AlF4.

CD results of ToPif1 and its mutants.
ATP hydrolysis of ToPif1 and its mutants with or without DNA effector (S18H11).
Ligand interaction between T6 and ToPif1 in the ToPif1‐G4T6/T8‐ ADP·AlF4 structure.
Ligand interaction between G7 and ToPif1 in the ToPif1‐GR17‐ ADP·AlF4 structure (PDB: 7BIL; Dai et al, 2021).
Ligand interaction between G21 and CsRecQ in CsRecQ‐ssDNA structure (PDB: 6CRM; Voter et al, 2018).


- A
Interactions of ToPif1 and the G4 layer I.
- B
The negative–negative repulsion interaction between E397 and the G7 of G4T6/T8 in the ToPif1 ternary complex structure. The electrostatic potential at ± 5 kTe −1 was colored in blue (basic/positive), white (neutral), and red (acidic/negative).
- C, D
Interaction of ToPif1 and G4 layers II and III, respectively. Molecular electrostatic potential map calculated with G4 DNA omitted from the co‐crystal structure (blue to red, ± 5 kTe −1).

Interaction between ToPif1 and the T6 of G4T6/T8 in the ToPif1‐G4T6/T8‐ADP·AlF4 ternary complex.
Superposition on domain 1A of structures in ToPif1‐G4T6/T8 and ToPif1‐GR17.
Interaction between ToPif1 and the G7 of GR17 in the ToPif1‐GR17‐ADP·AlF4 ternary complex.
Structural superposition of interacting residues for ToPif1 with the T6 of G4T6/T8 and the G7 of GR17.

- A
Stopped‐flow kinetics of the G4 (AP‐S16‐TelG4) unwinding activity of ToPif1 and the various modified proteins. The different unwinding curves represent an average of three to four independent experiments for each substrate. The solid line represents the fit of data according to equation (2).
- B
Bar plot of k cat/K d,app values in Table 2 (n = 3 biological replicates). The k cat/K d,app values of G4 in descending numerical order (front panel), and these are determined with the dsDNA (S26D17, back panel). Data are presented as means ± SD.
- C–F
The typical smFRET trajectories of antiparallel G4 (smG4AP‐424) unwinding catalyzed by different ToPif1 mutants based on single‐molecular FRET assays. The dashed magenta, black, and red lines represent the states of G4: fully folded, incompletely folded, and fully unfolded, respectively. The concentrations of the R355A (C), R135A (D), R150A (E), and R419A (F) mutants were 50 nM with 150‐μM ATP. The experimental conditions are described in Methods. Black arrows in the solid style indicate the time of adding proteins.

- A
Stopped‐flow kinetics of the antiparallel G4 (AP‐S16‐TelG4) unwinding activity of ToPif1 and its mutants. The different curves represent an average of three to four independent experiments for each substrate. The solid line represents the fit of data according to equation (2).
- B
E397A mutant‐stimulating effect determined with parallel G4 DNA.
- C–E
The typical FRET trajectories of antiparallel G4 (smG4AP‐424) unwinding catalyzed by different point mutations on E397 using single‐molecular FRET assays. The dashed magenta and red lines represent the fully folded and unfolded states of G4, respectively. The different unwinding curves represent an average of three to four independent experiments for each substrate. Black arrows in the solid style indicate the time of adding proteins.
- F
Error bar plot of unwinding time of E397A, E397L, and E397H determined from unfolding curves of (C), (D), and (E), respectively (n = 3 biological replicates). The experimental conditions are described in Materials and Methods and data are presented as means ± SD.
References
-
- Andis NM, Sausen CW, Alladin A, Bochman ML (2018) The WYL domain of the PIF1 helicase from the thermophilic bacterium Thermotoga elfii is an accessory single‐stranded DNA binding module. Biochemistry 57: 1108–1118 - PubMed
-
- Barlow JN, Conrath K, Steyaert J (2009) Substrate‐dependent modulation of enzyme activity by allosteric effector antibodies. Biochem Biophys Acta 1794: 1259–1268 - PubMed

