. 2022 Jun 20;11(12):1616.
doi: 10.3390/plants11121616.

Potential Impacts of Climate Change on the Habitat Suitability of the Dominant Tree Species in Greece

Affiliations

Potential Impacts of Climate Change on the Habitat Suitability of the Dominant Tree Species in Greece

Nikolaos M Fyllas et al. Plants (Basel). .

Abstract

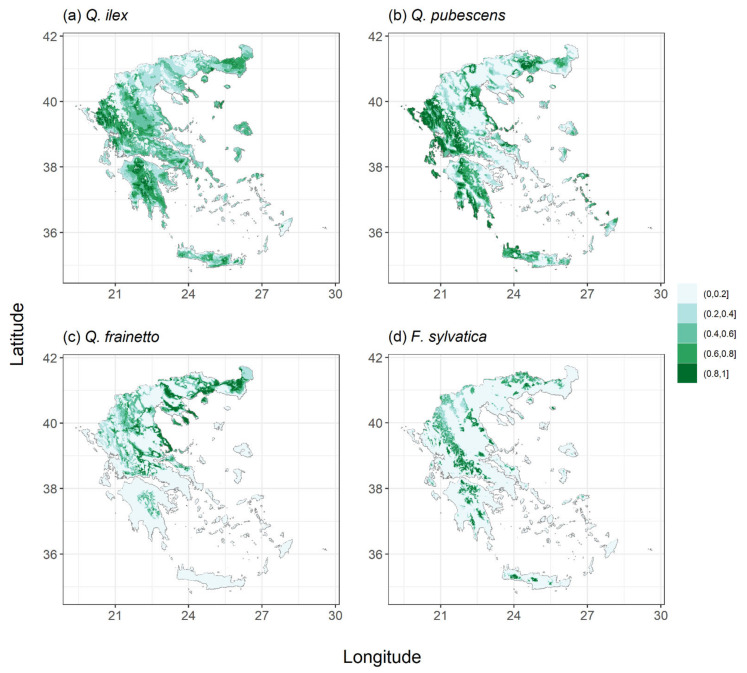
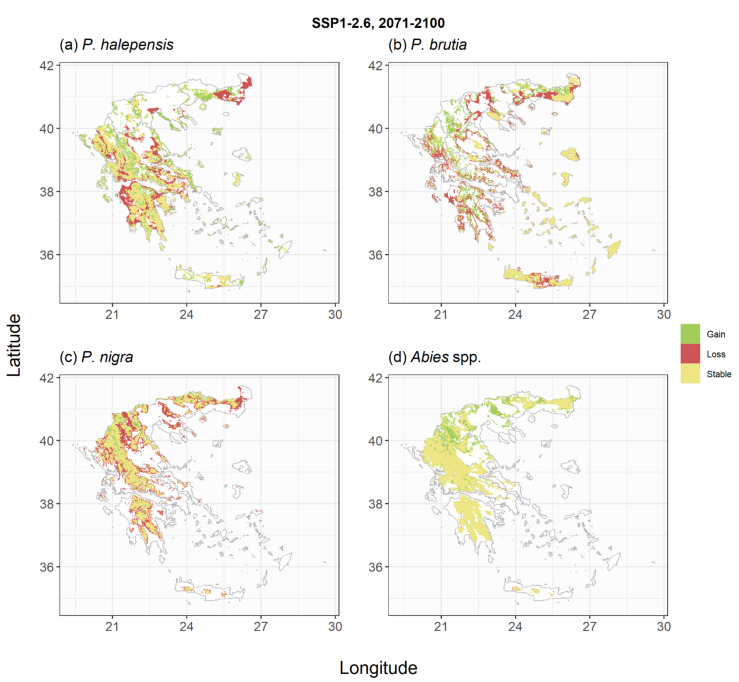
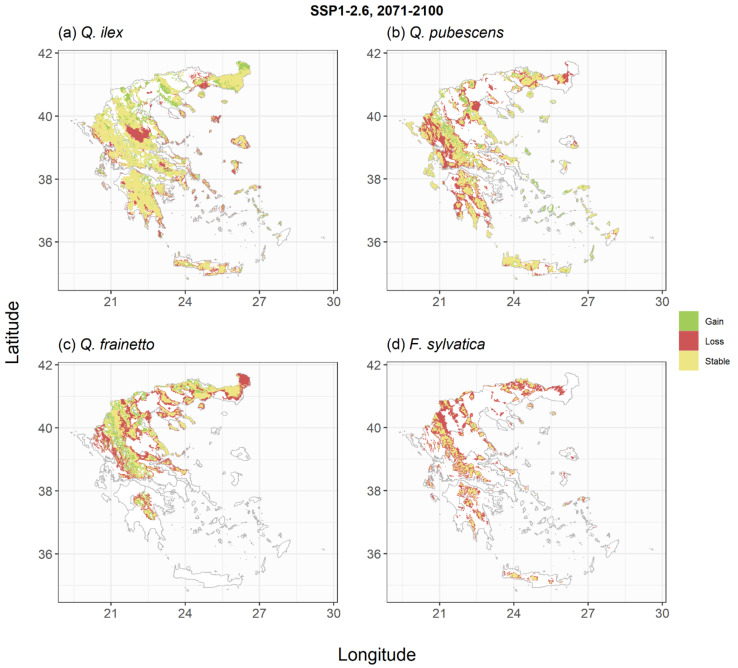
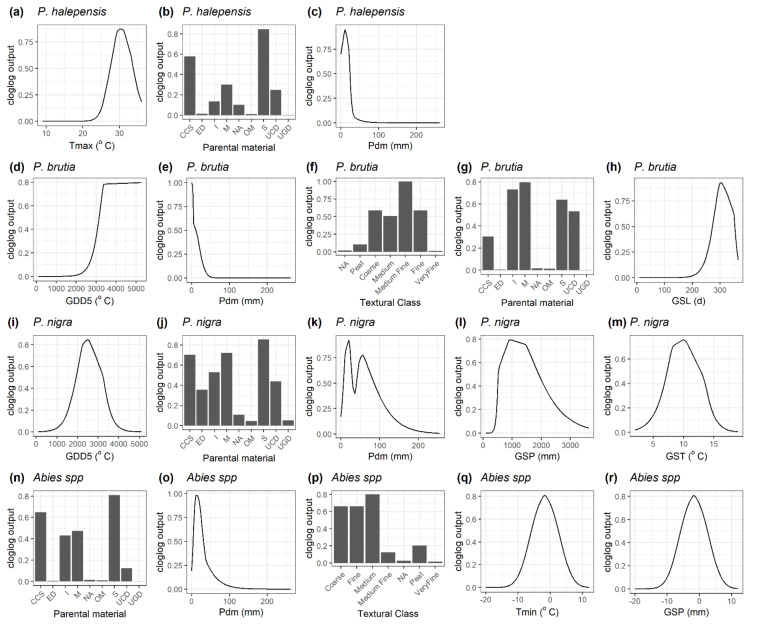
Climate change is affecting species distribution and ecosystem form and function. Forests provide a range of ecosystem services, and understanding their vulnerability to climate change is important for designing effective adaptation strategies. Species Distribution Modelling (SDM) has been extensively used to derive habitat suitability maps under current conditions and project species distribution shifts under climate change. In this study, we model the current and future habitat suitability of the dominant tree species in Greece (Abies cephalonica, Abies borisii-regis, Pinus brutia, Pinus halepensis, Pinus nigra, Quercus ilex, Quercus pubescens, Quercus frainetto and Fagus sylvatica), based on species-specific presence data from the EU-Forest database, enhanced with data from Greece that is currently under-represented in terms of tree species occurrence points. By including these additional presence data, areas with relatively drier conditions for some of the study species were included in the SDM development, yielding a potentially lower vulnerability under climate change conditions. SDMs were developed for each taxon using climate and soil data at a resolution of ~1 km2. Model performance was assessed under current conditions and was found to adequately simulate potential distributions. Subsequently, the models were used to project the potential distribution of each species under the SSP1-2.6 and SSP5-8.5 scenarios for the 2041-2070 and 2071-2100 time periods. Under climate change scenarios, a reduction in habitat-suitable areas was predicted for most study species, with higher elevation taxa experiencing more pronounced potential habitat shrinkages. An exception was the endemic A. cephalonica and its sister species A. borisii-regis, which, although currently found at mid and high elevations, seem able to maintain their potential distribution under most climate change scenarios. Our findings suggest that climate change could significantly affect the distribution and dynamics of forest ecosystems in Greece, with important ecological, economic and social implications, and thus adequate mitigation measures should be implemented.

Keywords: SSPs scenarios; maximum entropy; range shifts; species distribution modelling.


Conflict of interest statement

The authors declare no conflict of interest.

Figures

Figure A1
Figure A1
Two-dimensional bioclimatic envelopes of the studied species (green crosses and rectangles) as defined using the EU-Forest database [30], in contrast to the 2D envelope defined using the enhanced dataset with species presence in Greece (orange dots and rectangles). The limits of the rectangles are defined using the 0.025 and 0.975 quantiles for the mean daily minimum air temperature of the coldest month (Tmin) and the precipitation of the driest month (Pdm). For P. brutia, P. nigra, Abies spp. and Q. frainetto, the non-overlapping rectangles suggest that the species’ niche could have been extended in this study, including drier areas and decreasing the simulated species’ vulnerability to climate change. The study area is shaded in grey.
Figure A2
Figure A2
Habitat suitability maps of the studied conifer species under current climate conditions. The species-specific maps are also provided as GeoTIFF files in Supplementary File S1.
Figure A3
Figure A3
Habitat suitability maps of the studied broadleaf species under current climate conditions. The species-specific maps are also provided as GeoTIFF files in Supplementary File S1.
Figure A4
Figure A4
Shifts in habitat suitability of the studied conifer species under the SSP1-2.6 climate scenario for the period 2071–2100. Areas with green indicate regions that the species could expand, areas with yellow indicate regions that the species could have similar to current environmental conditions and areas with red indicate regions that would not be suitable under future conditions. The scenario- and species-specific maps are also provided as GeoTIFF files in Supplementary File S4.
Figure A5
Figure A5
Shifts in habitat suitability of the studied broadleaf species under the SSP1-2.6 climate scenario for the period 2071–2100. Areas with green indicate regions that the species could expand, areas with yellow indicate regions that the species could have similar to current environmental conditions and areas with red indicate regions that would not be suitable under future conditions. The scenario- and species-specific maps are also provided as GeoTIFF files in Supplementary File S4.
Figure A6
Figure A6
Shifts in habitat suitability of the studied conifer species under the SSP5-8.5 climate scenario for the period 2071–2100. Areas with green indicate regions that the species could expand, areas with yellow indicate regions that the species could have similar to current environmental conditions and areas with red indicate regions that would not be suitable under future conditions. The scenario- and species-specific maps are also provided as GeoTIFF files in Supplementary File S5.
Figure A7
Figure A7
Shifts in habitat suitability of the studied broadleaf species under the SSP5-8.5 climate scenario for the period 2071–2100. Areas with green indicate regions that the species could expand, areas with yellow indicate regions that the species could have similar to current environmental conditions and areas with red indicate regions that would not be suitable under future conditions. The scenario- and species-specific maps are also provided as GeoTIFF files in Supplementary File S5.
Figure A8
Figure A8
Barplot of changes (%) in habitat availability of the study species under the two climate change scenarios and reference periods. Species are grouped to conifers (green) and broadleaved (orange) and sorted based on their current elevation range of expansion from lower to higher elevations.
Figure 1
Figure 1
Response curves of the studied conifer species to each environmental variable maintained in the final maximum entropy model. Variables are sorted from left to right based on their relative contribution (decreasing order) (see also Table 1). Tmax: mean daily maximum air temperature of the warmest month (°C), Tmin: mean daily minimum air temperature of the coldest month (°C), Pa: total annual precipitation (mm), Pdm: precipitation of the driest month (mm), GDD5: heat sum of all days above 5 °C accumulated over a year (°C), GSL: length of the growing season (days), GST: mean temperature of all growing season days (°C), GSP: precipitation accumulated during the growing season (mm). Parental material classes include CCS: consolidated-clastic-sedimentary rocks, ED: eolian deposits, I: igneous rocks, M: metamorphic rocks, NA: no information, OM: organic materials, S: sedimentary rocks (chemically precipitated, evaporated or organogenic or biogenic in origin), UCD: unconsolidated deposits (alluvium, weathering residuum and slope deposits), UGD: unconsolidated glacial deposits/glacial drift. Texture (surface) dominant classes include NA: No information, Peat: No mineral texture: Coarse (18% < clay and >65% sand), Medium (18% < clay < 35% and ≥15% sand, or 18% < clay and 15% < sand < 65%), Medium fine (<35% clay and <15% sand), Fine (35% < clay < 60%), Very fine (clay > 60%).
Figure 2
Figure 2
Response curves of the studied broadleaved species to each environmental variable maintained in the final maximum entropy model. Variables are sorted from left to right based on their relative contribution (decreasing order) (see also Table 1). Tmax: mean daily maximum air temperature of the warmest month (°C), Tmin: mean daily minimum air temperature of the coldest month (°C), Pa: total annual precipitation (mm), Pdm: precipitation of the driest month (mm), GDD5: heat sum of all days above 5 °C accumulated over a year (°C), GSL: length of the growing season (days), GST: mean temperature of all growing season days (°C), GSP: precipitation accumulated during the growing season (mm). Parental material classes include CCS: consolidated-clastic-sedimentary rocks, ED: eolian deposits, I: igneous rocks, M: metamorphic rocks, NA: no information, OM: organic materials, S: sedimentary rocks (chemically precipitated, evaporated or organogenic or biogenic in origin), UCD: unconsolidated deposits (alluvium, weathering residuum and slope deposits), UGD: unconsolidated glacial deposits/glacial drift. Texture (surface) dominant classes include NA: No information, Peat: No mineral texture: Coarse (18% < clay and >65% sand), Medium (18% < clay < 35% and ≥15% sand, or 18% < clay and 15% < sand < 65%), Medium fine (<35% clay and <15% sand), Fine (35% < clay < 60%), Very fine (clay > 60%).
Figure 3
Figure 3
Shifts in habitat suitability of the studied conifer species under the SSP1-2.6 climate scenario for the period 2041–2070. Areas with green indicate regions that the species could expand, areas with yellow indicate regions that the species could have similar to current environmental conditions and areas with red indicate regions that would not be suitable under future conditions. The scenario- and species-specific maps are provided as GeoTIFF files in Supplementary File S2.
Figure 4
Figure 4
Shifts in habitat suitability of the studied broadleaf species under the SSP1-2.6 climate scenario for the period 2041–2070. Areas with green indicate regions that the species could expand, areas with yellow indicate regions that the species could have similar to current environmental conditions and areas with red indicate regions that would not be suitable under future conditions. The scenario- and species-specific maps are provided as GeoTIFF files in Supplementary File S2.
Figure 5
Figure 5
Shifts in habitat suitability of the studied conifer species under the SSP5-8.5 climate scenario for the period 2041–2070. Areas with green indicate regions that the species could expand, areas with yellow indicate regions that the species could have similar to current environmental conditions and areas with red indicate regions that would not be suitable under future conditions. The scenario- and species-specific maps are provided as GeoTIFF files in Supplementary File S3.
Figure 6
Figure 6
Shifts in habitat suitability of the studied broadleaf species under the SSP5-8.5 climate scenario for the period 2041–2070. Areas with green indicate regions that the species could expand, areas with yellow indicate regions that the species could have similar to current environmental conditions and areas with red indicate regions that would not be suitable under future conditions. The scenario- and species-specific maps are provided as GeoTIFF files in Supplementary File S3.

Similar articles

Cited by

References

    1. FAO . Global Forest Resources Assessment (Desk References) FAO; Rome, Italy: 2015.
    1. Grammatikopoulou I., Vačkářová D. The Value of Forest Ecosystem Services: A Meta-Analysis at the European Scale and Application to National Ecosystem Accounting. Ecosyst. Serv. 2021;48:101262. doi: 10.1016/j.ecoser.2021.101262. - DOI
    1. Canadell J.G., Raupach M.R. Managing Forests for Climate Change Mitigation. Science. 2008;320:1456–1457. doi: 10.1126/science.1155458. - DOI - PubMed
    1. Brienen R.J.W., Phillips O.L., Feldpausch T.R., Gloor E., Baker T.R., Lloyd J., Lopez-Gonzalez G., Monteagudo-Mendoza A., Malhi Y., Lewis S.L., et al. Long-Term Decline of the Amazon Carbon Sink. Nature. 2015;519:344–348. doi: 10.1038/nature14283. - DOI - PubMed
    1. Boisvenue C., Running S.W. Impacts of Climate Change on Natural Forest Productivity—Evidence since the Middle of the 20th Century. Glob. Chang. Biol. 2006;12:862–882. doi: 10.1111/j.1365-2486.2006.01134.x. - DOI

LinkOut - more resources