

Multi-Omics Reveal Additive Cytotoxicity Effects of Aflatoxin B1 and Aflatoxin M1 toward Intestinal NCM460 Cells
- PMID: 35737029
- PMCID: PMC9231300
- DOI: 10.3390/toxins14060368
Multi-Omics Reveal Additive Cytotoxicity Effects of Aflatoxin B1 and Aflatoxin M1 toward Intestinal NCM460 Cells
Abstract
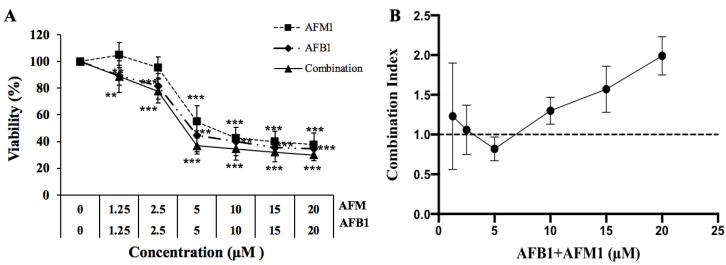
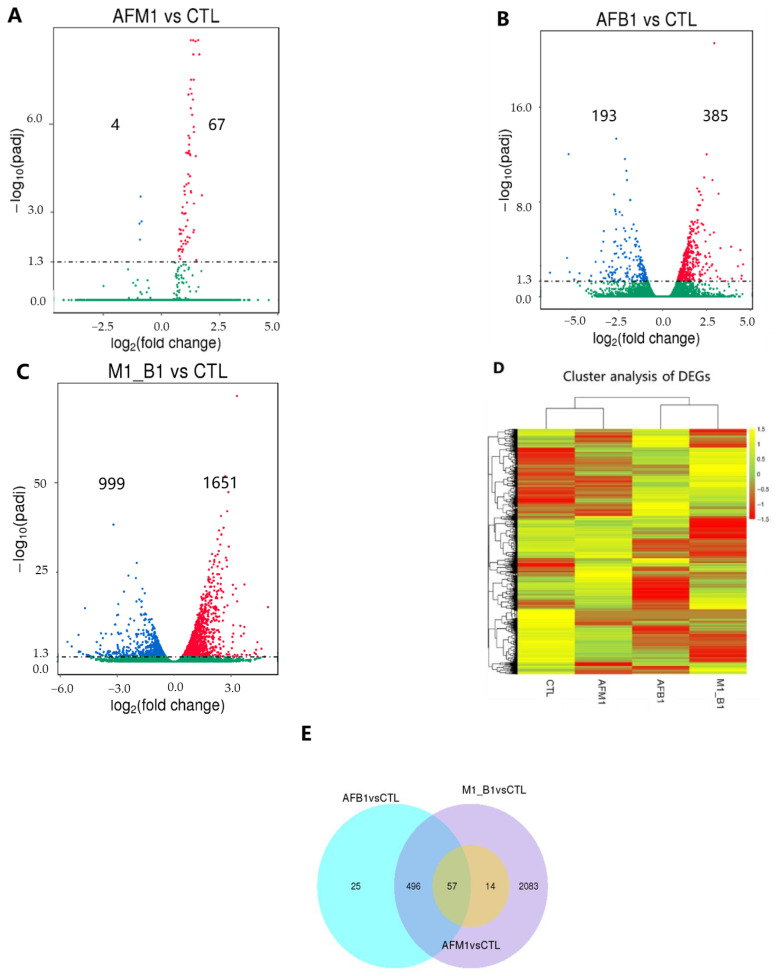
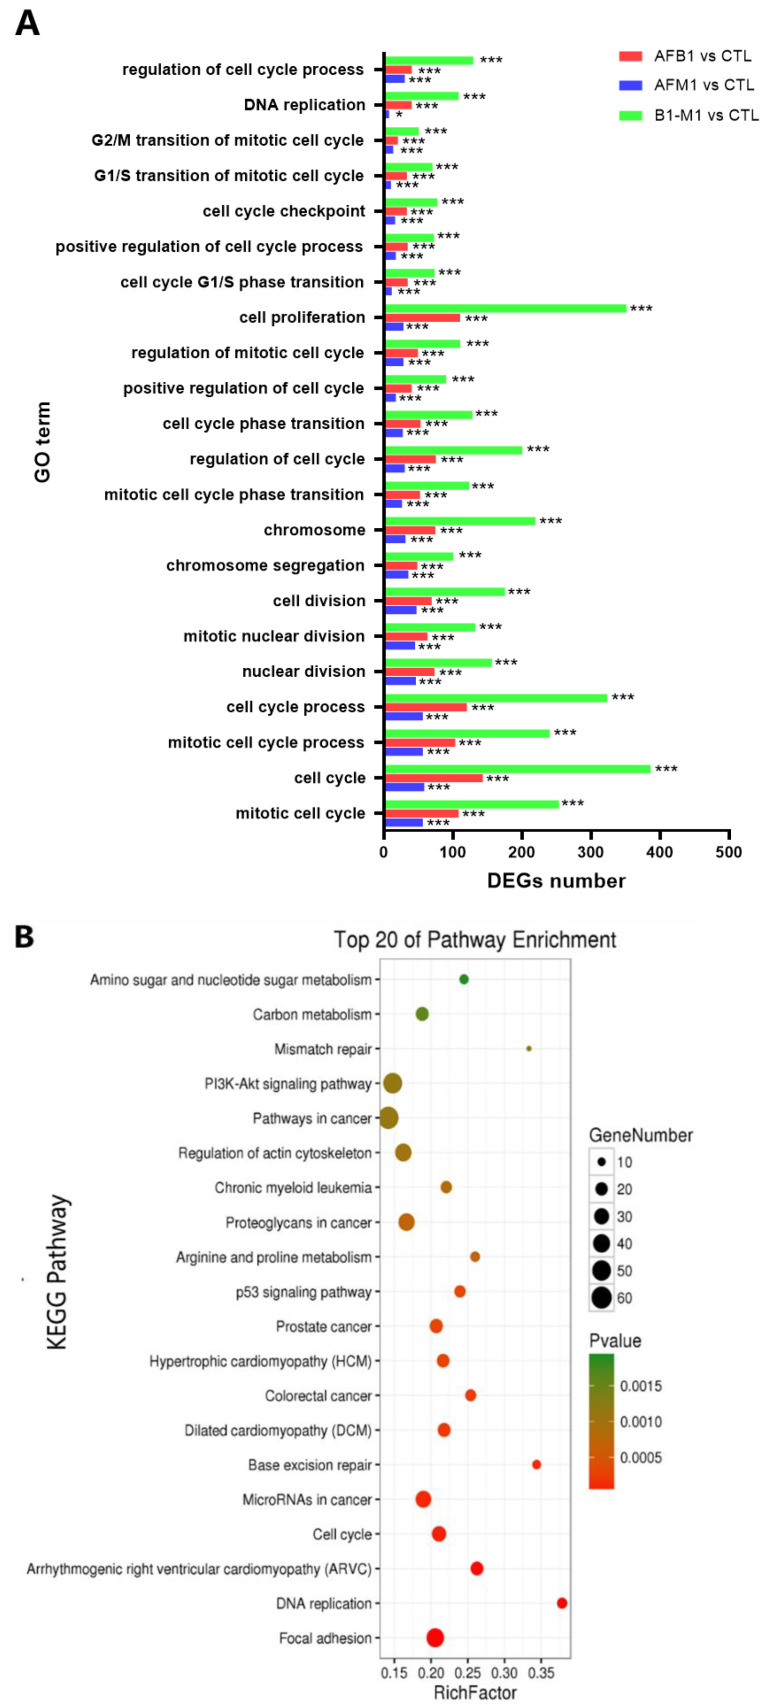
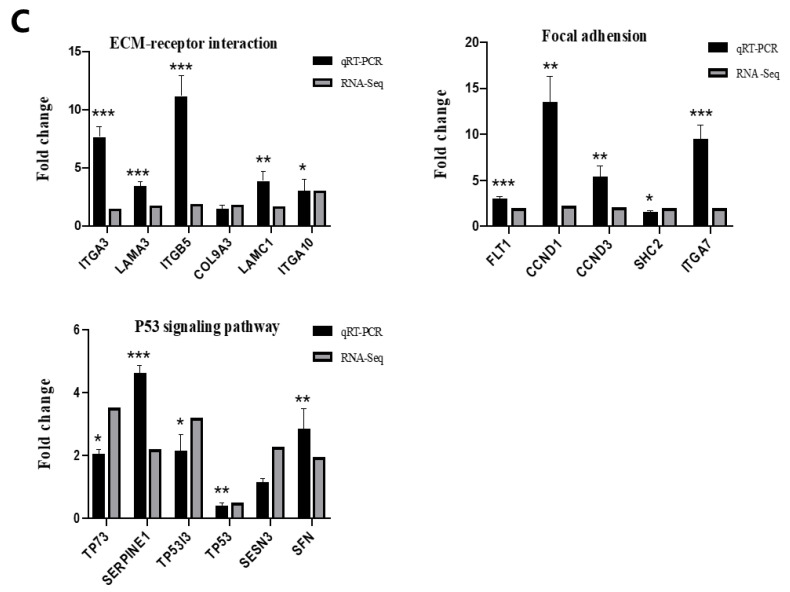
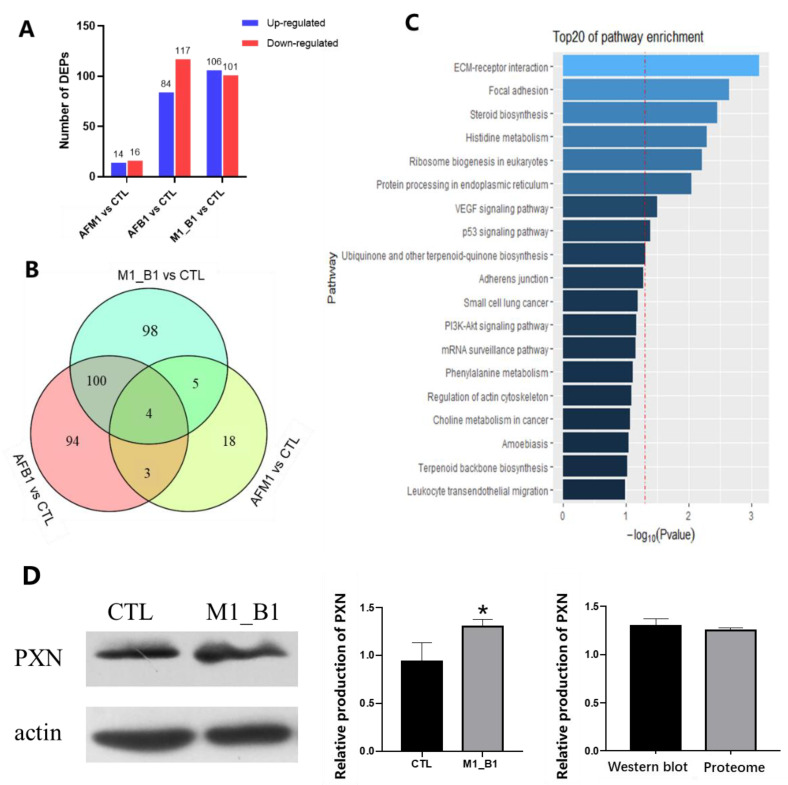
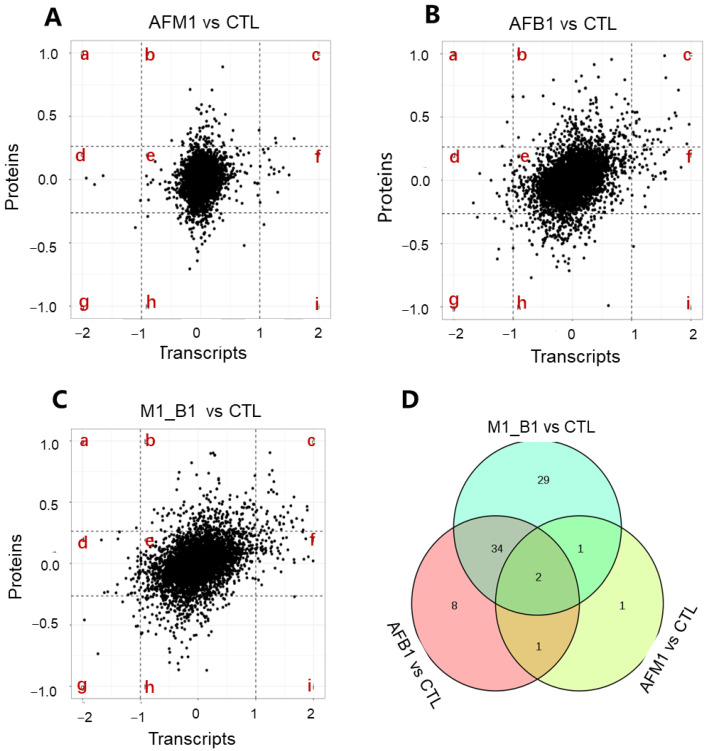
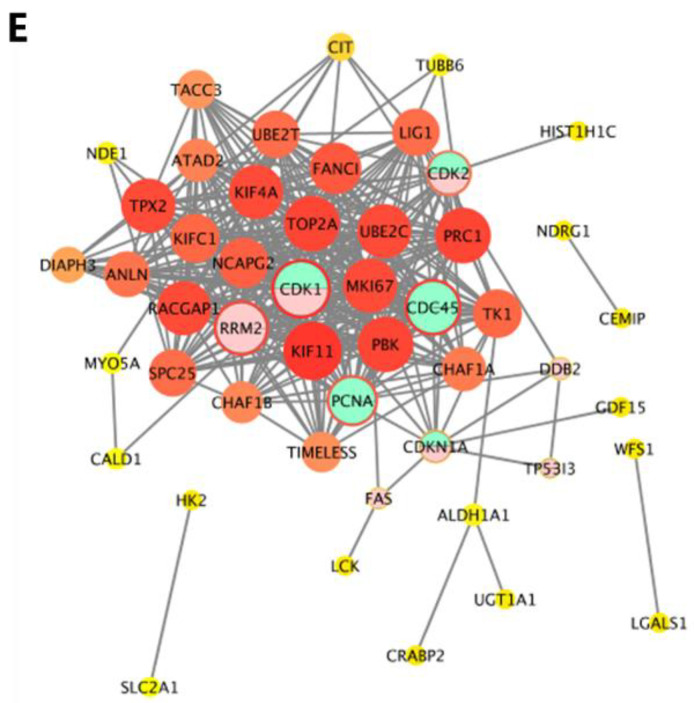
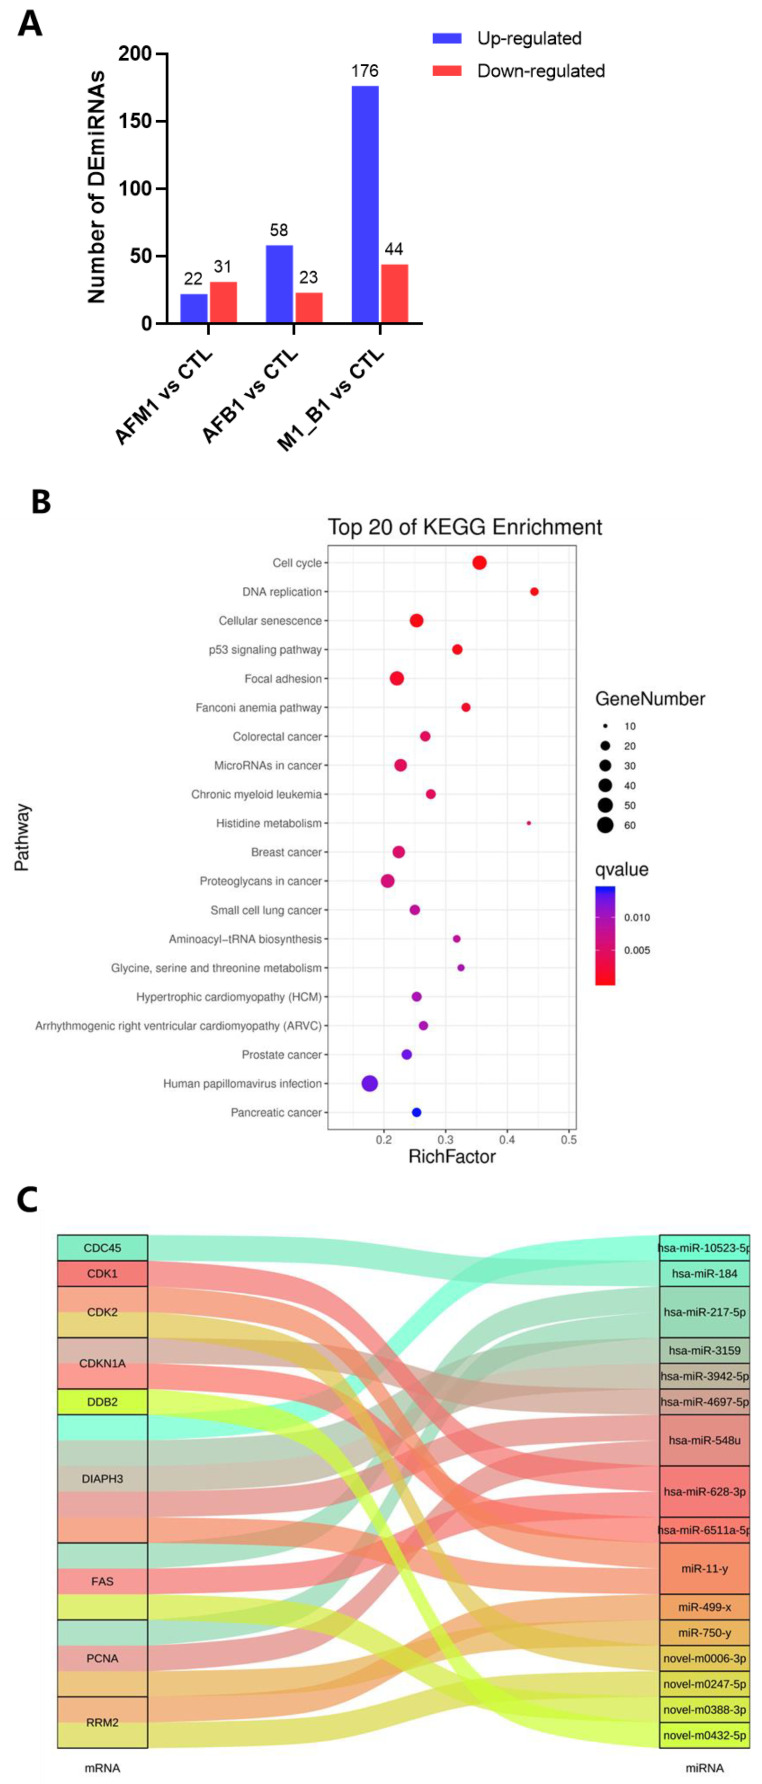
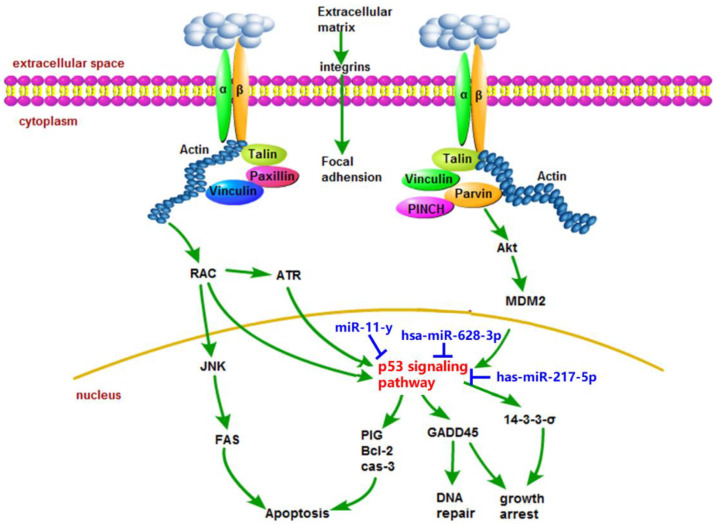
Aflatoxin B1 (AFB1) is a common crop contaminant, while aflatoxin M1 (AFM1) is implicated in milk safety. Humans are likely to be simultaneously exposed to AFB1 and AFM1; however, studies on the combined interactive effects of AFB1 and AFM1 are lacking. To fill this knowledge gap, transcriptomic, proteomic, and microRNA (miRNA)-sequencing approaches were used to investigate the toxic mechanisms underpinning combined AFB1 and AFM1 actions in vitro. Exposure to AFB1 (1.25-20 μM) and AFM1 (5-20 μM) for 48 h significantly decreased cell viability in the intestinal cell line, NCM460. Multi-omics analyses demonstrated that additive toxic effects were induced by combined AFB1 (2.5 μM) and AFM1 (2.5 μM) in NCM460 cells and were associated with p53 signaling pathway, a common pathway enriched by differentially expressed mRNAs/proteins/miRNAs. Specifically, based on p53 signaling, cross-omics showed that AFB1 and AFM1 reduced NCM460 cell viability via the hsa-miR-628-3p- and hsa-miR-217-5p-mediated regulation of cell surface death receptor (FAS), and also the hsa-miR-11-y-mediated regulation of cyclin dependent kinase 2 (CDK2). We provide new insights on biomarkers which reflect the cytotoxic effects of combined AFB1 and AFM1 toxicity.
Keywords: additive effects; aflatoxin B1; aflatoxin M1; multi-omics analyses.
Conflict of interest statement
The authors declare no conflict of interest.
Figures
Similar articles
-
Integrated Metabolomics and Lipidomics Analysis Reveals Lipid Metabolic Disorder in NCM460 Cells Caused by Aflatoxin B1 and Aflatoxin M1 Alone and in Combination.Toxins (Basel). 2023 Mar 31;15(4):255. doi: 10.3390/toxins15040255. Toxins (Basel). 2023. PMID: 37104193 Free PMC article.
-
Omics analysis revealed the intestinal toxicity induced by aflatoxin B1 and aflatoxin M1.Ecotoxicol Environ Saf. 2024 Jun 15;278:116336. doi: 10.1016/j.ecoenv.2024.116336. Epub 2024 Apr 30. Ecotoxicol Environ Saf. 2024. PMID: 38691883
-
Aflatoxin M1 contamination in raw bulk milk and the presence of aflatoxin B1 in corn supplied to dairy cattle in Japan.Shokuhin Eiseigaku Zasshi. 2008;49(5):352-5. doi: 10.3358/shokueishi.49.352. Shokuhin Eiseigaku Zasshi. 2008. PMID: 19029787
-
Aflatoxin B1 and M1: Biological Properties and Their Involvement in Cancer Development.Toxins (Basel). 2018 May 24;10(6):214. doi: 10.3390/toxins10060214. Toxins (Basel). 2018. PMID: 29794965 Free PMC article. Review.
-
Aflatoxin M1 in milk and dairy products: The state of the evidence for child growth impairment.Food Chem Toxicol. 2024 Nov;193:115008. doi: 10.1016/j.fct.2024.115008. Epub 2024 Sep 18. Food Chem Toxicol. 2024. PMID: 39304086 Review.
Cited by
-
Comparative metabolism of aflatoxin B1 in mouse, rat and human primary hepatocytes using HPLC-MS/MS.Arch Toxicol. 2023 Dec;97(12):3179-3196. doi: 10.1007/s00204-023-03607-z. Epub 2023 Oct 5. Arch Toxicol. 2023. PMID: 37794256 Free PMC article.
-
Warm and humid environment induces gut microbiota dysbiosis and bacterial translocation leading to inflammatory state and promotes proliferation and biofilm formation of certain bacteria, potentially causing sticky stool.BMC Microbiol. 2025 Jan 16;25(1):24. doi: 10.1186/s12866-024-03730-6. BMC Microbiol. 2025. PMID: 39819481 Free PMC article.
-
Algorithms and tools for data-driven omics integration to achieve multilayer biological insights: a narrative review.J Transl Med. 2025 Apr 10;23(1):425. doi: 10.1186/s12967-025-06446-x. J Transl Med. 2025. PMID: 40211300 Free PMC article. Review.
-
Combining Multiple Omics with Molecular Dynamics Reveals SCP2-Mediated Cytotoxicity Effects of Aflatoxin B1 in SW480 Cells.Toxins (Basel). 2024 Aug 24;16(9):375. doi: 10.3390/toxins16090375. Toxins (Basel). 2024. PMID: 39330833 Free PMC article.
-
Rapid LA-REIMS-based metabolic fingerprinting of serum discriminates aflatoxin-exposed from non-exposed pregnant women: a prospective cohort from the Butajira Nutrition, Mental Health, and Pregnancy (BUNMAP) Study in rural Ethiopia.Mycotoxin Res. 2024 Nov;40(4):681-691. doi: 10.1007/s12550-024-00558-x. Epub 2024 Sep 11. Mycotoxin Res. 2024. PMID: 39259493 Free PMC article.
References
-
- Dey D.K., Kang S.C. Aflatoxin B1 induces reactive oxygen species-dependent caspase-mediated apoptosis in normal human cells, inhibits Allium cepa root cell division, and triggers inflammatory response in zebrafish larvae. Sci. Total Environ. 2020;737:139704. doi: 10.1016/j.scitotenv.2020.139704. - DOI - PubMed
Publication types
MeSH terms
Substances
LinkOut - more resources
Full Text Sources
Research Materials
Miscellaneous
