. 2022 Jun 23;12(1):37.
doi: 10.1186/s13550-022-00909-8.

Alzheimer's disease pattern derived from relative cerebral flow as an alternative for the metabolic pattern using SSM/PCA

Affiliations

Alzheimer's disease pattern derived from relative cerebral flow as an alternative for the metabolic pattern using SSM/PCA

Débora E Peretti et al. EJNMMI Res. .

Abstract

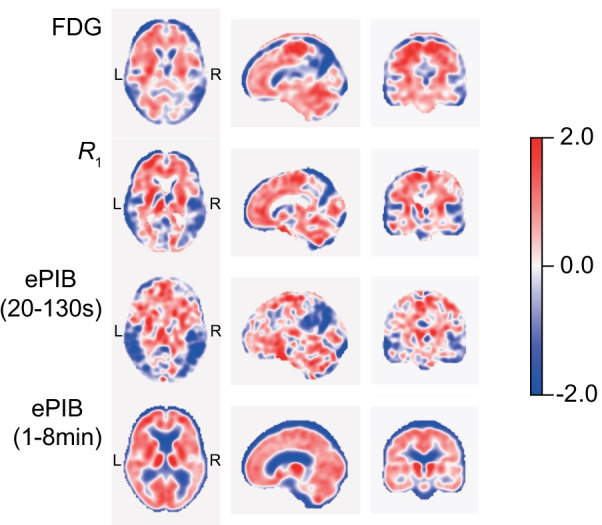
Background: 2-Deoxy-2-[18F]fluoroglucose (FDG) PET is an important tool for the identification of Alzheimer's disease (AD) patients through the characteristic neurodegeneration pattern that these patients present. Regional cerebral blood flow (rCBF) images derived from dynamic 11C-labelled Pittsburgh Compound B (PIB) have been shown to present a similar pattern as FDG. Moreover, multivariate analysis techniques, such as scaled subprofile modelling using principal component analysis (SSM/PCA), can be used to generate disease-specific patterns (DP) that may aid in the classification of subjects. Therefore, the aim of this study was to compare rCBF AD-DPs with FDG AD-DP and their respective performances. Therefore, 52 subjects were included in this study. Fifteen AD and 16 healthy control subjects were used to generate four AD-DP: one based on relative cerebral trace blood (R1), two based on time-weighted average of initial frame intervals (ePIB), and one based on FDG images. Furthermore, 21 subjects diagnosed with mild cognitive impairment were tested against these AD-DPs.

Results: In general, the rCBF and FDG AD-DPs were characterized by a reduction in cortical frontal, temporal, and parietal lobes. FDG and rCBF methods presented similar score distribution.

Conclusion: rCBF images may provide an alternative for FDG PET scans for the identification of AD patients through SSM/PCA.

Keywords: Alzheimer’s disease; Disease pattern; Relative cerebral blood flow; SSM/PCA.


Conflict of interest statement

The authors declare that they have no competing interests.

Figures

Fig. 1
Fig. 1
Disease Patterns. AD-DPs results from the comparison between HC and AD patients for FDG (first row), R1 (second row), ePIB(20–130 s) (third row), and ePIB(1–8 min) (fourth row). Blue and red colours indicate negative and positive voxel values, respectively. The closer to white, the closer the voxel value is to zero. All colour scales were adjusted to the same range
Fig. 2
Fig. 2
Joint Histograms of the disease patterns. Joint histograms of the FDG and R1 (top), ePIB(20–130 s) (middle), and ePIB(1–8 min) (bottom) DPs. The dashed line corresponds to the identity, and the solid line, to the linear regression of the data from the DPs. The bin counts are displayed in base 10 logarithmic amplitude scale
Fig. 3
Fig. 3
ROC Plots. ROC plot with the curves of FDG (solid black line, AUC = 0.93), R1 (dashed red, AUC = 0.86), ePIB(20–130 s) (dotted blue, AUC = 0.69), and ePIB(1–8 min) (dot-dashed green, AUC = 0.85)
Fig. 4
Fig. 4
Distribution of Scores per Method. Distribution of the subjects’ normalized scores from FDG (top left), R1 (top right), ePIB(20–130 s) (bottom left), and ePIB(1–8 min) (bottom right). Boxes represent the interquartile range of distribution, with the median per group showing as a full line, the whiskers expanding up to 1.5 times the interquartile range, and the outliers are presented as black dots. Coloured circles represent individual subjects’ scores within the groups. AD patients are depicted in red, MCI+ , in blue; MCI−, in green; and HC subjects, in purple. The dashed lines correspond to the threshold for classifying subjects as AD patients, and the stars represent the differences between groups that are statistically significant
Fig. 5
Fig. 5
Scatter and Bland–Altman Plots. Scatter plots (left column) of scores from R1 parametric images (top), ePIB(20–130 s) (middle), and ePIB(1–8 min) (bottom) images (y-axis), compared to FDG (x-axis). The dashed line represents the identity. Results from the linear regression applied to the data are shown in the upper left corner of the plots and as a solid line. Bland–Altman plots (right column) show the difference between the scores provided by R1 (top), ePIB(20–130 s) (middle), and ePIB(1–8 min) (bottom) and FDG. The solid line is at the average difference between the scores, and the dashed lines delimit the limits of agreement of the 95% interval (at mean ± 1.96 × standard deviation). Data points are coloured according to group: in red, the AD patients; in blue, the MCI+ ; in green, the MCI−; and in purple, the HC subjects

References

    1. Morbelli S, et al. Visual versus semi-quantitative analysis of 18F-FDG-PET in amnestic MCI: an European Alzheimer’s disease consortium (EADC) project. J Alzheimer’s Dis. 2015;44:815–826. doi: 10.3233/JAD-142229. - DOI - PubMed
    1. Teune LK, et al. Typical cerebral metabolic patterns in neurodegenerative brain diseases. Mov Disord. 2010;25:2395–2404. doi: 10.1002/mds.23291. - DOI - PubMed
    1. Jack CR, et al. NIA-AA research framework: toward a biological definition of Alzheimer’s disease. Alzheimer’s Dement. 2018;14:535–562. doi: 10.1016/j.jalz.2018.02.018. - DOI - PMC - PubMed
    1. Klunk WE, et al. Imaging brain amyloid in Alzheimer’s disease with pittsburgh compound-B. Ann Neurol. 2004;55:306–319. doi: 10.1002/ana.20009. - DOI - PubMed
    1. Jueptner M, Weiller C. Review: does measurement of regional cerebral blood flow reflect synaptic activity? implications for PET and fMRI. Neuroimage. 1995;2:148–156. doi: 10.1006/nimg.1995.1017. - DOI - PubMed

LinkOut - more resources