

Analysis of Uterine Blood Flow in Breeding Sows through the Estrus and Early Diestrus, and after Artificial Insemination
- PMID: 35737312
- PMCID: PMC9228517
- DOI: 10.3390/vetsci9060260
Analysis of Uterine Blood Flow in Breeding Sows through the Estrus and Early Diestrus, and after Artificial Insemination
Abstract
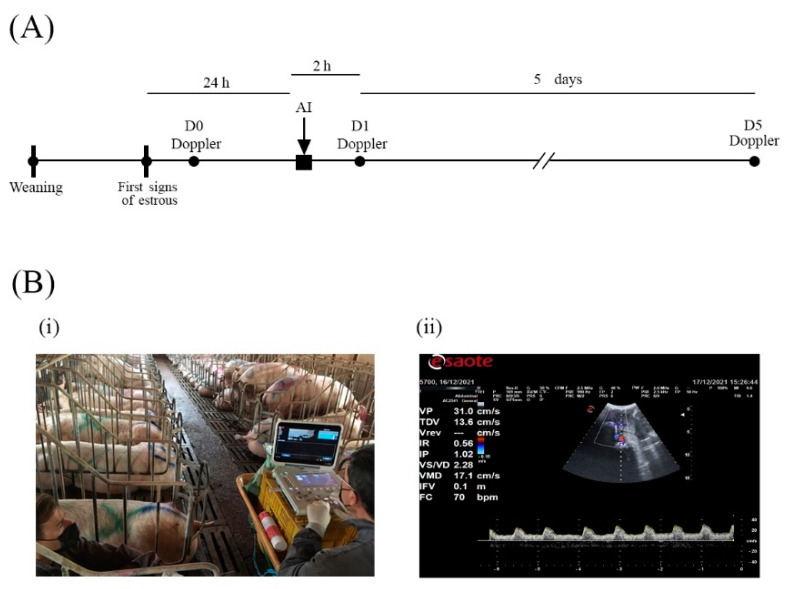
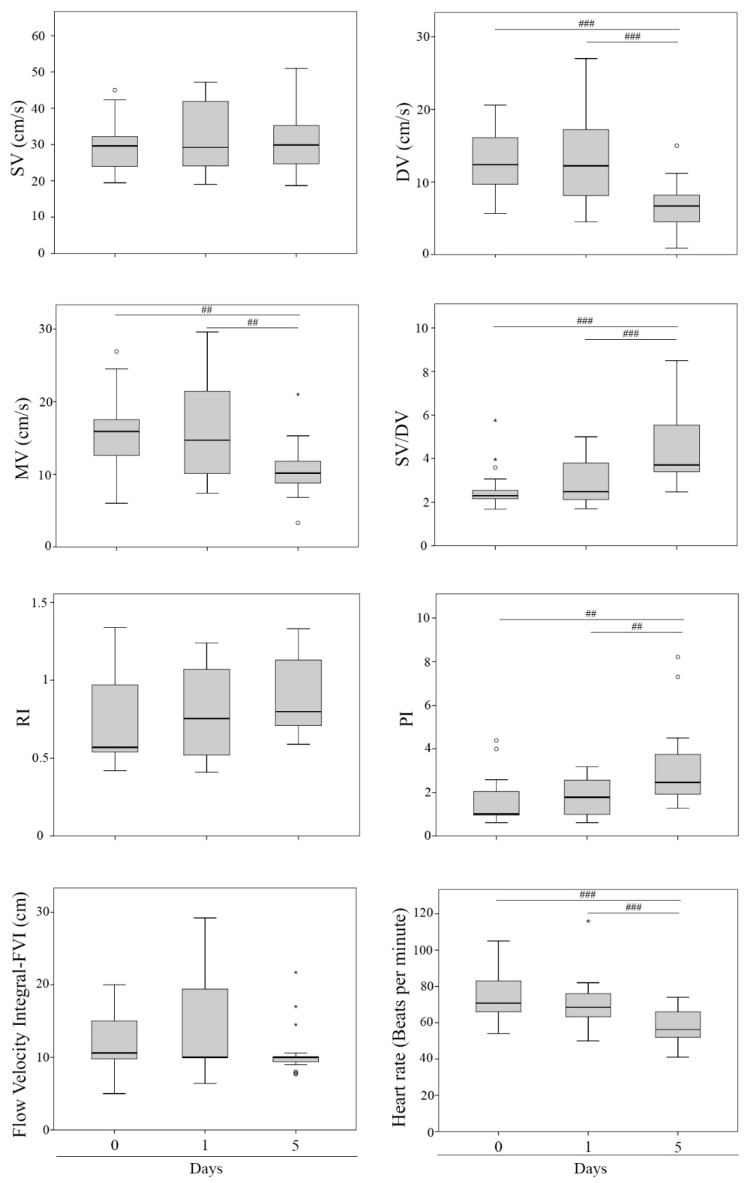
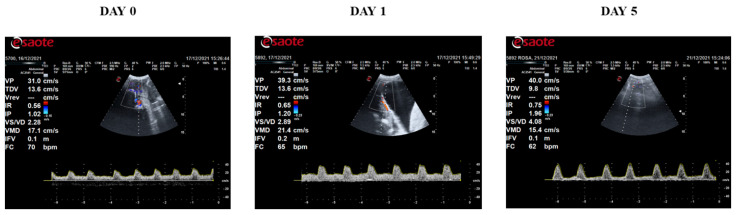
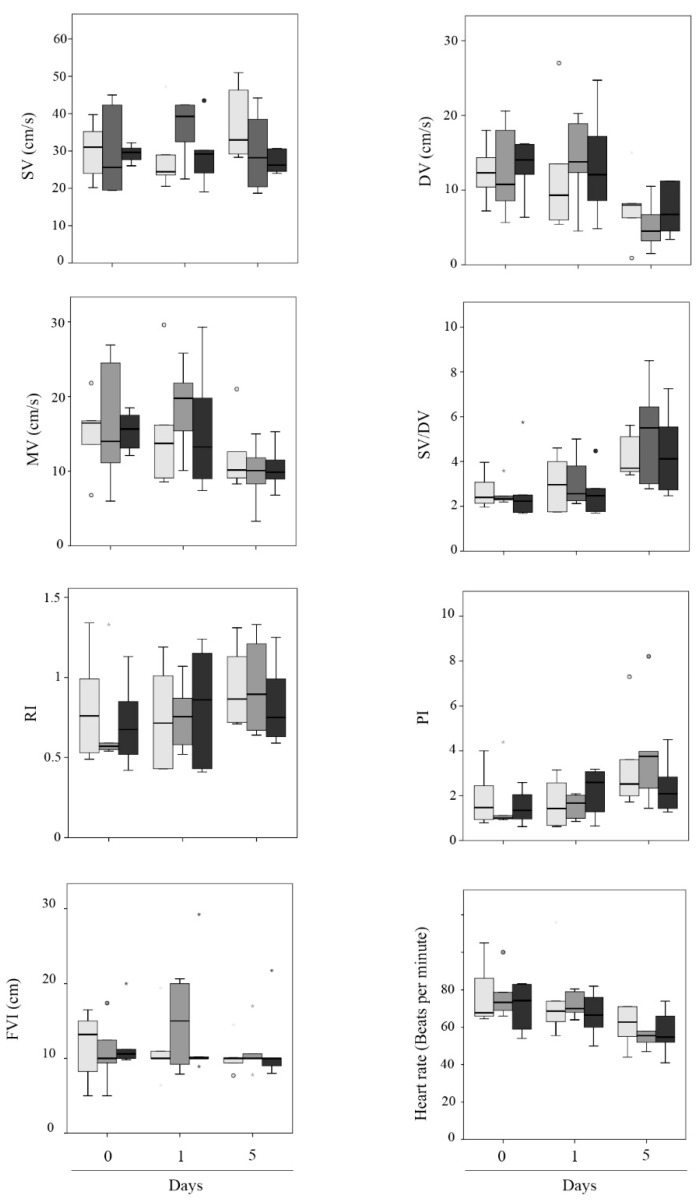
This study aimed to determine uterine blood flow indices by transabdominal Doppler ultrasound in sows (n = 18) under different conditions: (i) sows after estrus detection (day 0, D0); (ii) sows 2 h after artificial insemination (AI), performed 24 h after detection of estrus (day 1, D1); (iii) sows in early diestrus (day 5, D5). Moreover, three different types of seminal doses were used for AI depending on the ejaculate fraction included (F1: doses containing only the rich fraction of the ejaculate; F2: F1 + the transition fraction between rich and poor fractions; F3: F2 and poor fraction). The statistical analysis revealed significant differences in some indices regarding the period of analysis (D0, D1, and D5). Diastolic velocity and mean velocity showed lower values at D5 in comparison with D0 and D1 (p < 0.01). On the other hand, the pulsatility index and the relationship systolic velocity/diastolic velocity indicated higher values at D5 in comparison with D0 and D1 (p < 0.01). No differences were observed regarding the type of seminal dose used in any of the time points analyzed (p > 0.05). Neither insemination per se nor the type of ejaculate fraction used immediately modified the uterine vascularity, but some indices are affected by the stage of the estrus cycle (estrus vs. early diestrus).
Keywords: Doppler ultrasound; arterial blood flow; echography; imaging; porcine.
Conflict of interest statement
The authors declare no conflict of interest.
Figures
Similar articles
-
Different seminal ejaculated fractions in artificial insemination condition the protein cargo of oviductal and uterine extracellular vesicles in pig.Front Cell Dev Biol. 2023 Oct 6;11:1231755. doi: 10.3389/fcell.2023.1231755. eCollection 2023. Front Cell Dev Biol. 2023. PMID: 37868907 Free PMC article.
-
Artificial insemination of all ejaculated sperm fractions accelerates embryo development and increases the uterine vascularity in the pig.Theriogenology. 2024 Apr 15;219:32-38. doi: 10.1016/j.theriogenology.2024.02.017. Epub 2024 Feb 17. Theriogenology. 2024. PMID: 38382215
-
Should All Fractions of the Boar Ejaculate Be Prepared for Insemination Rather Than Using the Sperm Rich Only?Biology (Basel). 2022 Jan 28;11(2):210. doi: 10.3390/biology11020210. Biology (Basel). 2022. PMID: 35205077 Free PMC article.
-
Control of estrus and ovulation: Fertility to timed insemination of gilts and sows.Theriogenology. 2016 Oct 1;86(6):1460-1466. doi: 10.1016/j.theriogenology.2016.04.089. Epub 2016 May 14. Theriogenology. 2016. PMID: 27287469 Review.
-
Uterine activity, sperm transport, and the role of boar stimuli around insemination in sows.Theriogenology. 2005 Jan 15;63(2):500-13. doi: 10.1016/j.theriogenology.2004.09.027. Theriogenology. 2005. PMID: 15626413 Review.
Cited by
-
Assisted Reproductive Technologies (ARTs) in Domestic Mammals.Vet Sci. 2023 Apr 11;10(4):287. doi: 10.3390/vetsci10040287. Vet Sci. 2023. PMID: 37104442 Free PMC article.
References
Grants and funding
LinkOut - more resources
Full Text Sources
Miscellaneous
