. 2022 Jun 23;18(6):e1010209.
doi: 10.1371/journal.pcbi.1010209. eCollection 2022 Jun.

Image-based parameter inference for epithelial mechanics

Affiliations

Image-based parameter inference for epithelial mechanics

Goshi Ogita et al. PLoS Comput Biol. .

Abstract

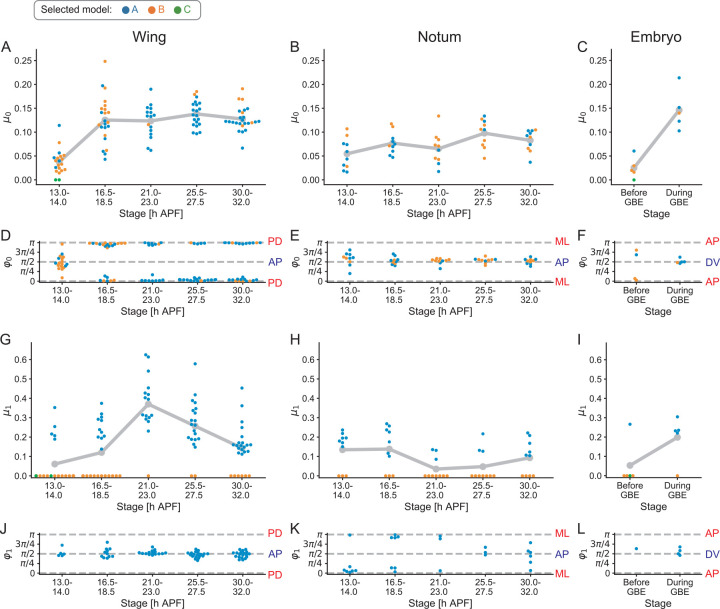
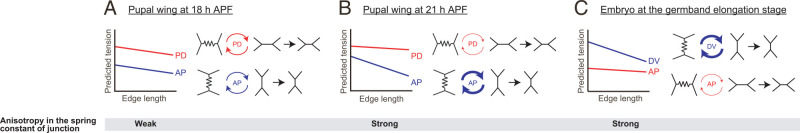
Measuring mechanical parameters in tissues, such as the elastic modulus of cell-cell junctions, is essential to decipher the mechanical control of morphogenesis. However, their in vivo measurement is technically challenging. Here, we formulated an image-based statistical approach to estimate the mechanical parameters of epithelial cells. Candidate mechanical models are constructed based on force-cell shape correlations obtained from image data. Substitution of the model functions into force-balance equations at the cell vertex leads to an equation with respect to the parameters of the model, by which one can estimate the parameter values using a least-squares method. A test using synthetic data confirmed the accuracy of parameter estimation and model selection. By applying this method to Drosophila epithelial tissues, we found that the magnitude and orientation of feedback between the junction tension and shrinkage, which are determined by the spring constant of the junction, were correlated with the elevation of tension and myosin-II on shrinking junctions during cell rearrangement. Further, this method clarified how alterations in tissue polarity and stretching affect the anisotropy in tension parameters. Thus, our method provides a novel approach to uncovering the mechanisms governing epithelial morphogenesis.


Conflict of interest statement

The authors have declared that no competing interests exist.

Figures

Fig 1
Fig 1. Image-based parameter estimation for epithelial mechanics.
(A) The structure of the monolayer epithelium. Epithelial cells adhere to each other via cell adhesion molecules such as cadherin (green). Actomyosin cables (red) run along the cell cortex in the plane of the adherens junction (AJ). (B) Forces acting along the AJ plane. Left: Junction tension. Right: Cell pressure. (C) Balance of tensions (T) and pressures (P) at a cell vertex indicated by a black dot. (D) Flowchart of the proposed method to estimate mechanical parameters from image data, in which cell contour is visualized. (E–L) Force-shape correlations obtained by Bayesian force/stress inference in epithelial tissue (E–H) and in foam (I–L). Bayesian force/stress inference yields maps of junction tension (E, I) and cell pressure (G, K), which are overlaid on input images (epithelial tissue: DE-cad-GFP in Drosophila pupal wing at 22 h APF, foam: a coarsening foam [73]). Each junction is classified by its orientation relative to the horizontal axis (semicircle; PD: proximal-distal and AP: anterior-posterior), and its inferred tension is plotted against its length (F, J). The inferred pressure is plotted against the cell/foam area (H, L). 〈A〉 represents the average cell area. (M) Table of a series of models, which are designated model A to model E in order of decreasing complexity. A schematic showing the dependence of tension on junction length and orientation and the tension function is shown for each model. Parameters are indicated in red. (N–Q) Results of parameter estimation from the Drosophila wing image shown in E. (N) The orientation of each junction relative to the PD axis of the wing is classified (semicircle), and its tension predicted from estimated parameters is plotted against its length. (O) Cell pressure predicted from estimated parameters is plotted against cell area. (P, Q) Correlation between predicted force values obtained by the parameter estimation method and inferred force values obtained by Bayesian force/stress inference. Predicted tensions and pressures (vertical axis) are plotted against inferred tensions and pressures (horizontal axis), respectively. The correlation coefficient is shown in the bottom right corner. Scale bar: 10 μm in (E).
Fig 2
Fig 2. Drosophila epithelial tissues examined in this study.
(A–C) Schematics of the adult fly (adapted from [69]) (A, B) and of the fly embryo at the germband elongation (GBE) stage (C). Orange rectangles indicate the regions studied in this study. Purple lines indicate the orientation of tissue tension. Schematics of junction are shown in the right. (A) The hinge is shaded gray. In this and all subsequent figures showing the wing, the vertical and horizontal directions are aligned with the AP and PD axes, respectively. (B) In this and all subsequent figures showing the notum, the vertical and horizontal directions are aligned with the AP and ML axes, respectively. (C) In this and all subsequent figures showing the embryo, the vertical and horizontal directions are aligned with the DV and AP axes, respectively. A cyan arrow indicates cell flow during GBE. (D–F) Schematics showing active cell rearrangement in the pupal wing (D), passive cell rearrangement in the pupal wing (E), and active cell rearrangement in the embryo at the GBE stage (F). In the left panels, red lines indicate the global myo-II polarity in tissues. In the right panels, red/pink arrows and purple arrows indicate junction tension and extrinsic pulling forces from the hinge, respectively. Line color represents the local myo-II concentration along the junction. Cells localize myo-II on PD junctions to resist extrinsic pulling forces from the hinge (red lines in D). The myo-II enrichment along the remodeling junctions is indicated by the change in line colors from pale pink to red along the vertical shrinking junction in E and from dark pink to red along the vertical shrinking junction in F.
Fig 3
Fig 3. In silico validation of the parameter estimation method.
(A) Schematic of a perfect model experiment. (B–E) Estimated values of parameters are plotted against their true values for λ0 (B; the line tension), μ0 (C; the anisotropy in the line tension), λ1 (D; the spring constant of junction), and μ1 (E; the anisotropy in the spring constant of junction). Estimated values of λ0 and λ1 were normalized by k and A0 = 1.0 as λ0=λ^0/k^A01.5,λ1=λ^1/k^A0, where q^ denotes the estimated value of q. A dashed line indicates y = x.
Fig 4
Fig 4. Evaluation of robustness to image processing error.
(A–P) A noise resistance test on the estimation of μ0 (A–D; the anisotropy in the line tension), λ1 (E–H; the spring constant of junction), μ1 (I–L; the anisotropy in the spring constant of junction) and k (M–P; the elastic modulus of cells). Parameters were estimated from the original data and noised data sets. Each dot shows the median value of the deviations of estimated parameters in 100 noised data sets (Materials and Methods) for each synthetic data (A, E, I, M) or each input image at the stage indicated in the pupal wing (B, F, J, N), pupal notum (C, G, K, O), and embryo (D, H, L, P). Dot colors represent a model used for parameter estimation.
Fig 5
Fig 5. Developmental changes in predicted tensions in Drosophila epithelial tissues.
(A–L) Junction tension predicted by estimated parameters is plotted against the junction length at the stage indicated in the pupal wing (A–E), pupal notum (F–J), and embryo (K, L). Estimated values of RT, μ0 and μ1 are shown in the upper right corner. A semicircle indicates the classification of junctions based on their orientation for each tissue (PD: proximal-distal, AP: anterior-posterior, ML: medio-lateral and DV: dorsoventral). (M–R) Developmental changes in the anisotropy of the predicted tension (RT; Materials and Methods) and its orientation (Θ). Each dot shows the value of RT (M–O) or Θ (P–R) in each sample at the stage indicated in the pupal wing (M, P), pupal notum (N, Q), and embryo (O, R). The gray line connects the average values of RT for each stage. Error bars indicate the s.d. Dot colors represent a model selected by AIC.
Fig 6
Fig 6. Developmental changes in tension anisotropy parameters in Drosophila epithelial tissues.
(A–L) Developmental changes in the estimated values of μ0 (A–C; the anisotropy in the line tension), φ0 (D–F; the orientation of anisotropy in the line tension), μ1 (G–I; the anisotropy in the spring constant of junction), and φ1 (J–L; the orientation of anisotropy in the spring constant of junction). Each dot shows the estimated value of a parameter in each sample at the stage indicated in the pupal wing (A, D, G, J), pupal notum (B, E, H, K), and embryo (C, F, I, L). The gray line connects the average values of μ0 and μ1 for each stage. Dot colors represent a model selected by AIC.
Fig 7
Fig 7. Summary of the results of parameter estimation.
(A–C) Schematics showing the results of parameter estimation in the pupal wing at 18 h APF (A), in the pupal wing at 21 h APF (B), and in the embryo at the GBE stage (C). Line color represents junctions along the specific axis of the tissue and the arrow width represents the magnitude of the feedback. The results of parameter estimation indicated that the positive feedback between junction tension and shrinkage is strengthened at remodeling junctions during passive cell rearrangement in the pupal wing (B) and active cell rearrangement in the embryo (C) but not active cell rearrangement in the pupal wing (A).
Fig 8
Fig 8. Effect of alterations in tissue stretching of the wing and body polarity of the embryo on the anisotropy of tension parameters.
(A, B) Junction tension predicted by estimated parameters is plotted against the junction length for control and hinge-severed wings at 24 h APF. A semicircle indicates the classification of the junction based on its orientation. Insets in A and B are enlarged images of DE-cad-GFP in control and hinge-severed wings at 24 h APF. (C–H) RT (C; the anisotropy of the predicted tension), μ0 (D; the anisotropy in the line tension), μ1 (E; the anisotropy in the spring constant of junction), Θ (F; the orientation in anisotropy of the predicted tension), φ0 (G; the orientation of anisotropy in the line tension), and φ1 (H; the orientation of anisotropy in the spring constant of junction) from time-lapse images of control (black circles) and hinge-severed (open circles) wings. The black and gray lines connect the average estimated values of parameters for each stage in control and hinge-severed wings, respectively. (I, J) Junction tension predicted by estimated parameters is plotted against the junction length for wild-type and runt3 embryos. Insets in I and J are enlarged images of DE-cad-GFP in wild-type and runt3 embryos. (K–P) The anisotropy of the predicted tension (RT; K), μ0 (L), μ1 (M), Θ (N), φ0 (O), and φ1 (P) in wild-type (black circles) and runt3 (open circles) embryos at the GBE stage. Error bars indicate the s.d. Scale bars: 10 μm in (A, B) and 10 μm in (I, J).

References

    1. Lenne P-F, Munro E, Heemskerk I, Warmflash A, Bocanegra-Moreno L, Kishi K, et al.. Roadmap for the multiscale coupling of biochemical and mechanical signals during development. Phys Biol. 2021;18: 041501. doi: 10.1088/1478-3975/abd0db - DOI - PMC - PubMed
    1. Chu C-W, Masak G, Yang J, Davidson LA. From biomechanics to mechanobiology: Xenopus provides direct access to the physical principles that shape the embryo. Curr Opin Genet Dev. 2020;63: 71–77. doi: 10.1016/j.gde.2020.05.011 - DOI - PMC - PubMed
    1. Paci G, Mao Y. Forced into shape: Mechanical forces in Drosophila development and homeostasis. Semin Cell Dev Biol. 2021. doi: 10.1016/j.semcdb.2021.05.026 - DOI - PMC - PubMed
    1. Chan CJ, Heisenberg C-P, Hiiragi T. Coordination of Morphogenesis and Cell-Fate Specification in Development. Curr Biol. 2017;27: R1024–R1035. doi: 10.1016/j.cub.2017.07.010 - DOI - PubMed
    1. Trinh D-C, Alonso-Serra J, Asaoka M, Colin L, Cortes M, Malivert A, et al.. How Mechanical Forces Shape Plant Organs. Curr Biol. 2021;31: R143–R159. doi: 10.1016/j.cub.2020.12.001 - DOI - PubMed

Publication types