

Antigenic cartography of SARS-CoV-2 reveals that Omicron BA.1 and BA.2 are antigenically distinct
- PMID: 35737747
- PMCID: PMC9273038
- DOI: 10.1126/sciimmunol.abq4450
Antigenic cartography of SARS-CoV-2 reveals that Omicron BA.1 and BA.2 are antigenically distinct
Abstract
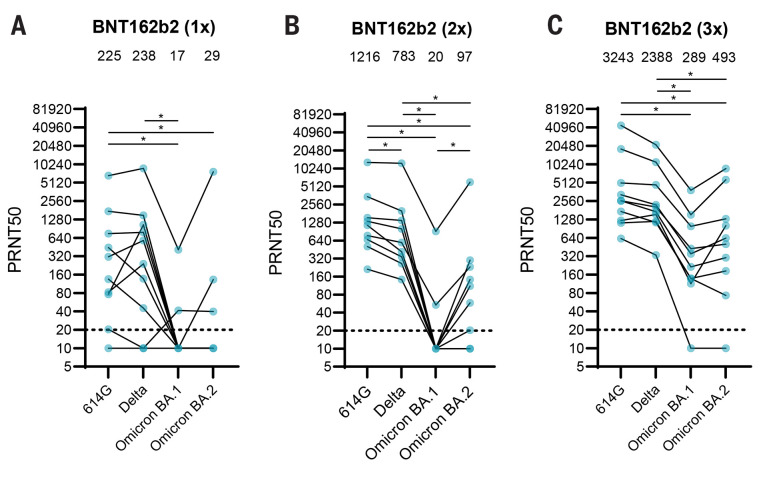
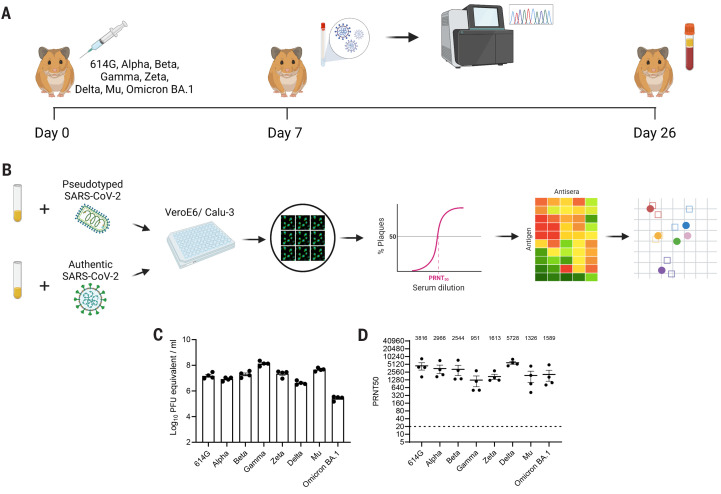
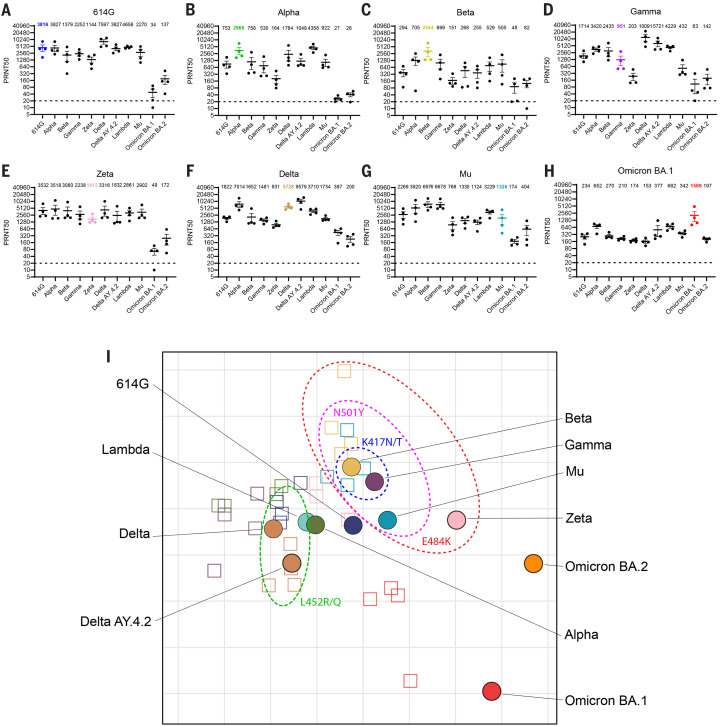
The emergence and rapid spread of SARS-CoV-2 variants may affect vaccine efficacy substantially. The Omicron variant termed BA.2, which differs substantially from BA.1 based on genetic sequence, is currently replacing BA.1 in several countries, but its antigenic characteristics have not yet been assessed. Here, we used antigenic cartography to quantify and visualize antigenic differences between early SARS-CoV-2 variants (614G, Alpha, Beta, Gamma, Zeta, Delta, and Mu) using hamster antisera obtained after primary infection. We first verified that the choice of the cell line for the neutralization assay did not affect the topology of the map substantially. Antigenic maps generated using pseudo-typed SARS-CoV-2 on the widely used VeroE6 cell line and the human airway cell line Calu-3 generated similar maps. Maps made using authentic SARS-CoV-2 on Calu-3 cells also closely resembled those generated with pseudo-typed viruses. The antigenic maps revealed a central cluster of SARS-CoV-2 variants, which grouped on the basis of mutual spike mutations. Whereas these early variants are antigenically similar, clustering relatively close to each other in antigenic space, Omicron BA.1 and BA.2 have evolved as two distinct antigenic outliers. Our data show that BA.1 and BA.2 both escape vaccine-induced antibody responses as a result of different antigenic characteristics. Thus, antigenic cartography could be used to assess antigenic properties of future SARS-CoV-2 variants of concern that emerge and to decide on the composition of novel spike-based (booster) vaccines.
Figures

References
-
- Numerical data from WHO Coronavirus (COVID-19) Dashboard, found at https://covid19.who.int
-
- Korber B., Fischer W. M., Gnanakaran S., Yoon H., Theiler J., Abfalterer W., Hengartner N., Giorgi E. E., Bhattacharya T., Foley B., Hastie K. M., Parker M. D., Partridge D. G., Evans C. M., Freeman T. M., de Silva T. I., McDanal C., Perez L. G., Tang H., Moon-Walker A., Whelan S. P., LaBranche C. C., Saphire E. O., Montefiori D. C.; Sheffield COVID-19 Genomics Group , Tracking Changes in SARS-CoV-2 Spike: Evidence that D614G Increases Infectivity of the COVID-19 Virus. Cell 182, 812–827.e19 (2020). 10.1016/j.cell.2020.06.043 - DOI - PMC - PubMed
-
- Campbell F., Archer B., Laurenson-Schafer H., Jinnai Y., Konings F., Batra N., Pavlin B., Vandemaele K., Van Kerkhove M. D., Jombart T., Morgan O., le Polain de Waroux O., Increased transmissibility and global spread of SARS-CoV-2 variants of concern as at June 2021. Euro Surveill. 26, ••• (2021). 10.2807/1560-7917.ES.2021.26.24.2100509 - DOI - PMC - PubMed
-
- Frampton D., Rampling T., Cross A., Bailey H., Heaney J., Byott M., Scott R., Sconza R., Price J., Margaritis M., Bergstrom M., Spyer M. J., Miralhes P. B., Grant P., Kirk S., Valerio C., Mangera Z., Prabhahar T., Moreno-Cuesta J., Arulkumaran N., Singer M., Shin G. Y., Sanchez E., Paraskevopoulou S. M., Pillay D., McKendry R. A., Mirfenderesky M., Houlihan C. F., Nastouli E., Genomic characteristics and clinical effect of the emergent SARS-CoV-2 B.1.1.7 lineage in London, UK: A whole-genome sequencing and hospital-based cohort study. Lancet Infect. Dis. 21, 1246–1256 (2021). 10.1016/S1473-3099(21)00170-5 - DOI - PMC - PubMed
Publication types
MeSH terms
Substances
Supplementary concepts
Grants and funding
LinkOut - more resources
Full Text Sources
Other Literature Sources
Medical
Research Materials
Miscellaneous
