. 2022 Jun 24;376(6600):eabh2841.
doi: 10.1126/science.abh2841. Epub 2022 Jun 24.

Tumor necrosis factor induces pathogenic mitochondrial ROS in tuberculosis through reverse electron transport

Affiliations

Tumor necrosis factor induces pathogenic mitochondrial ROS in tuberculosis through reverse electron transport

Francisco J Roca et al. Science. .

Abstract

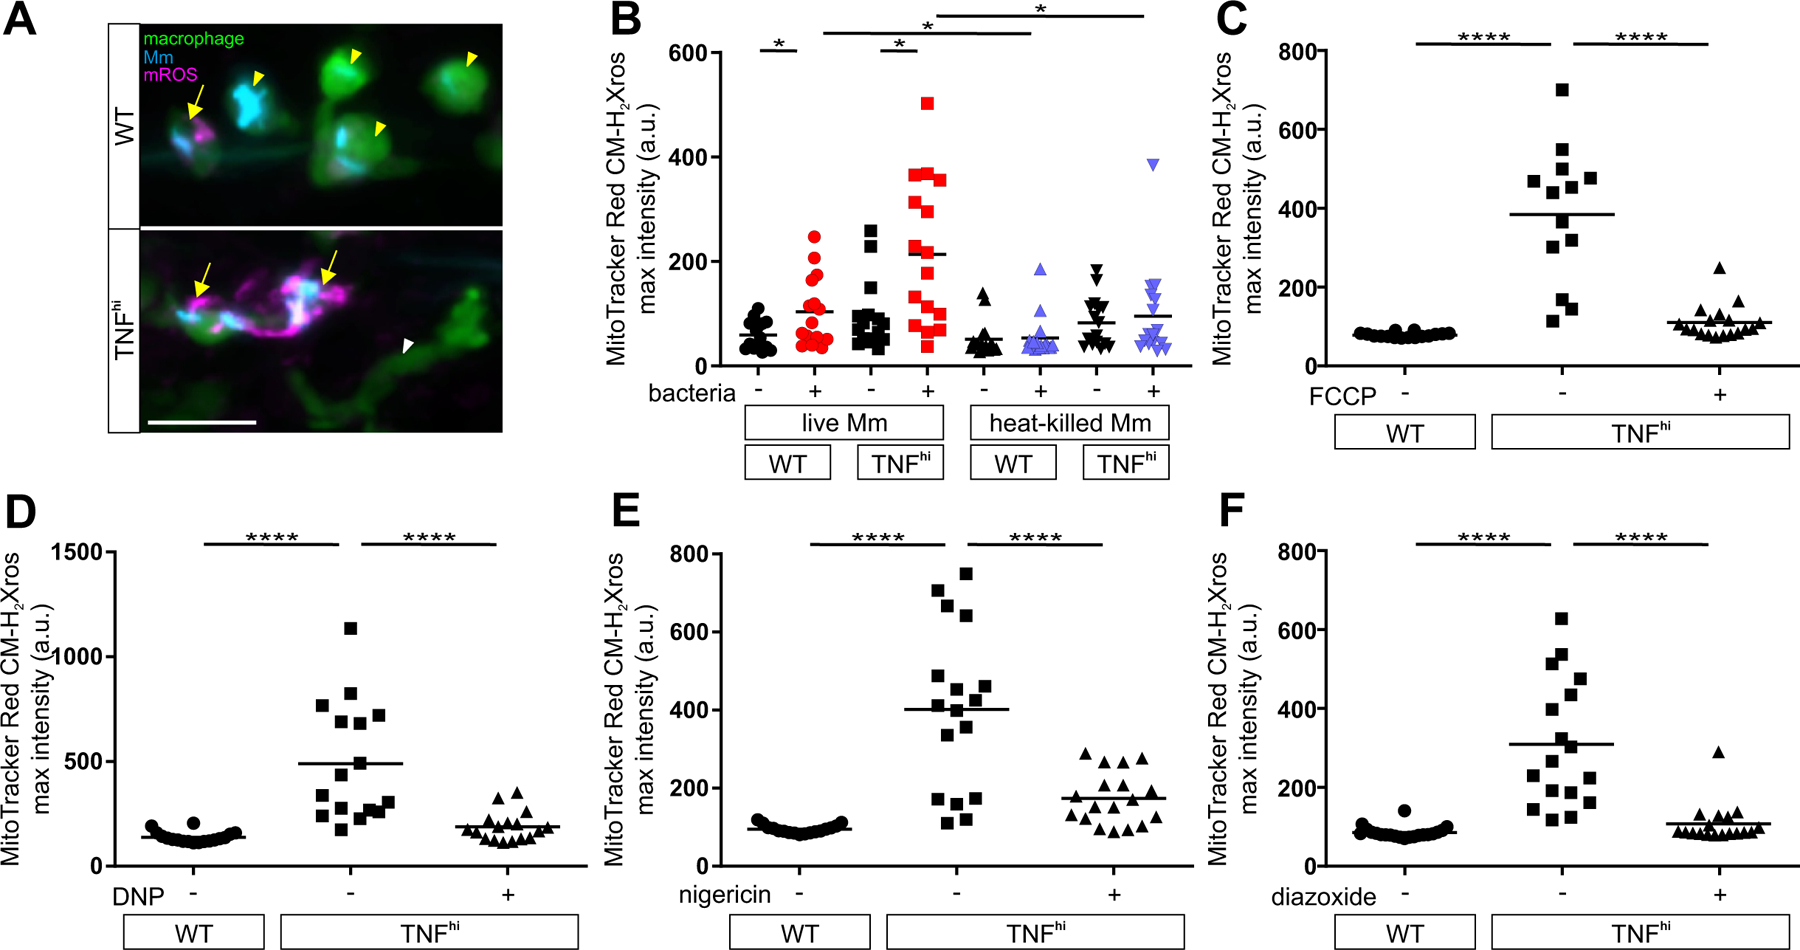
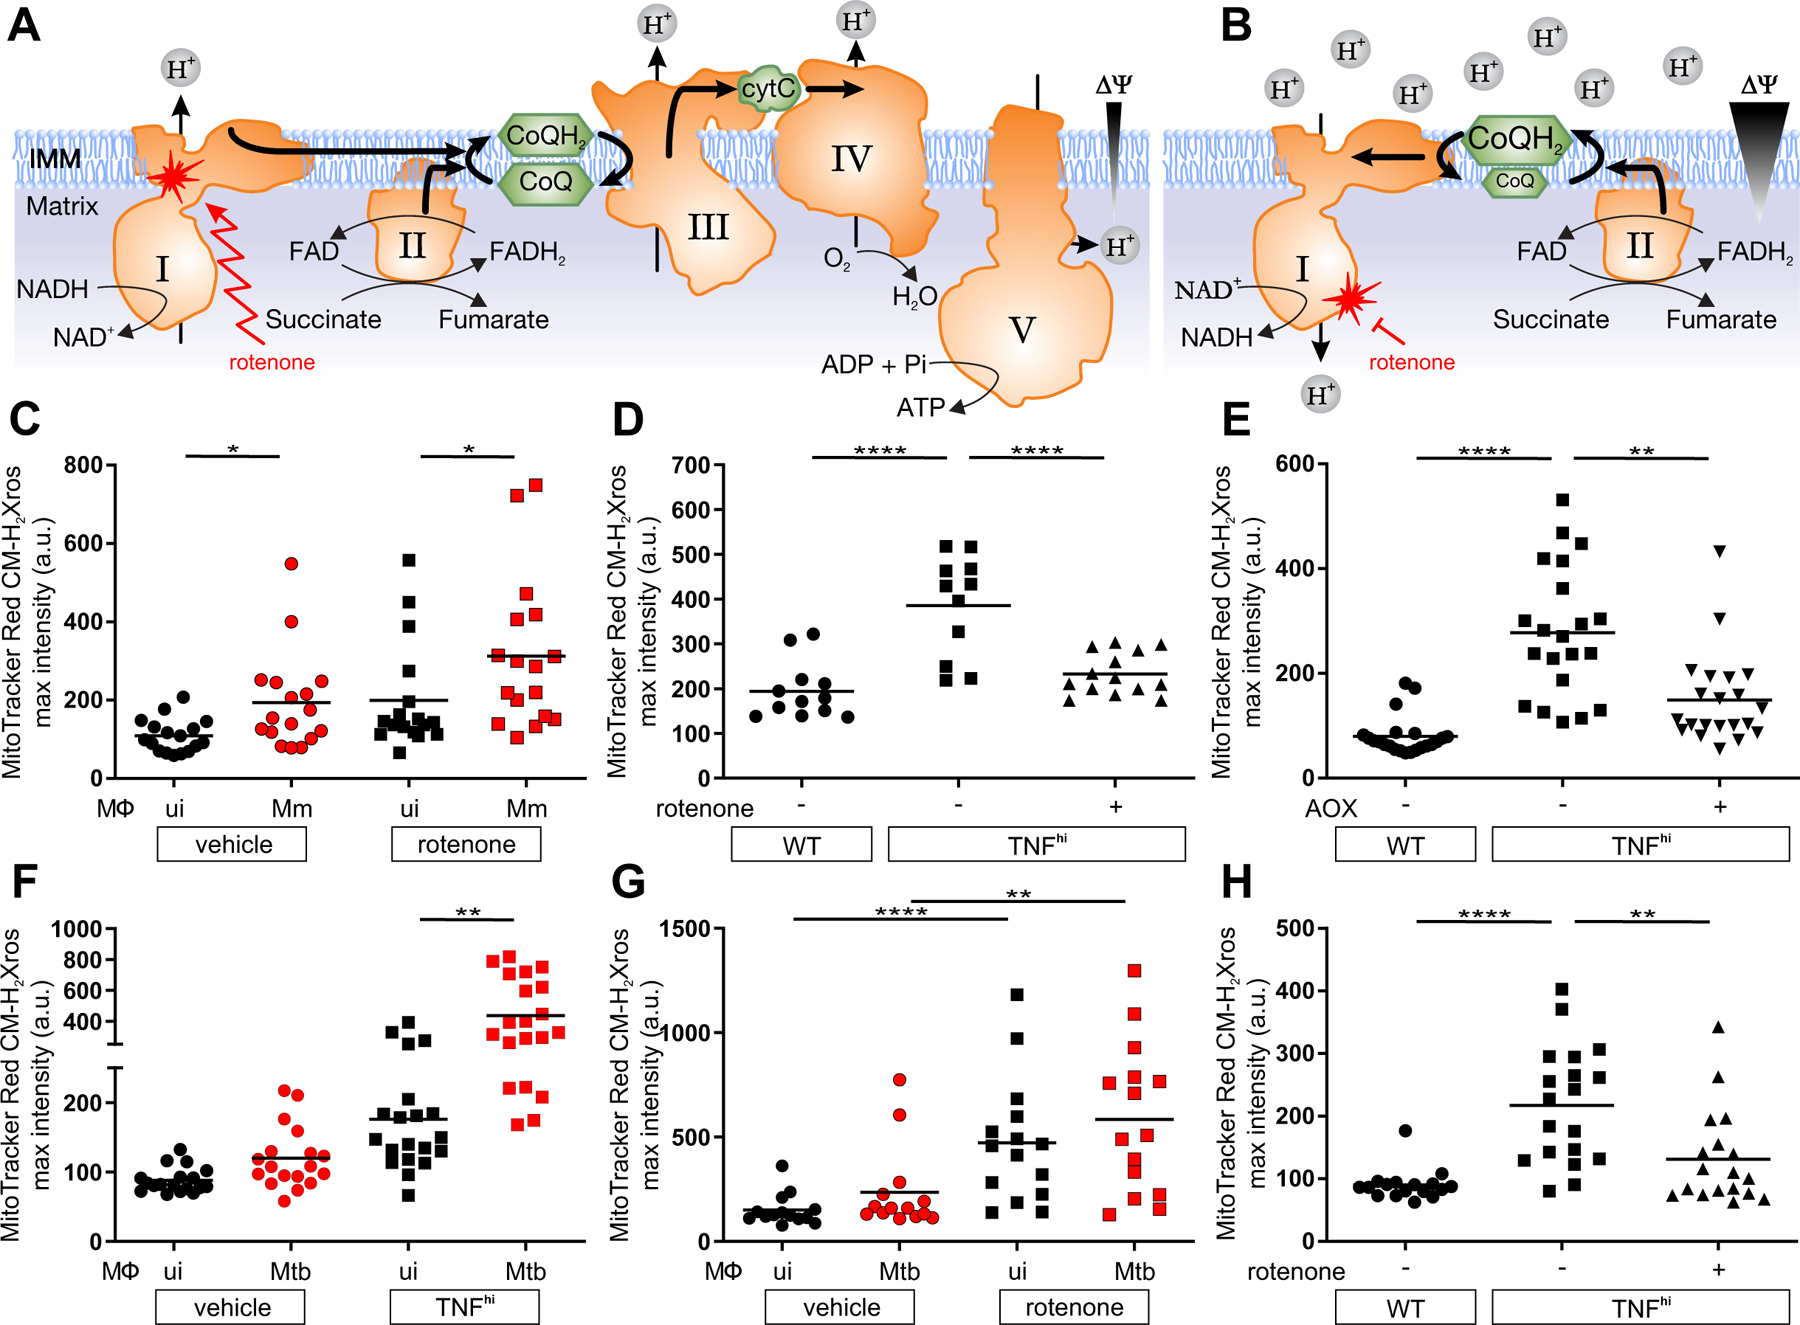
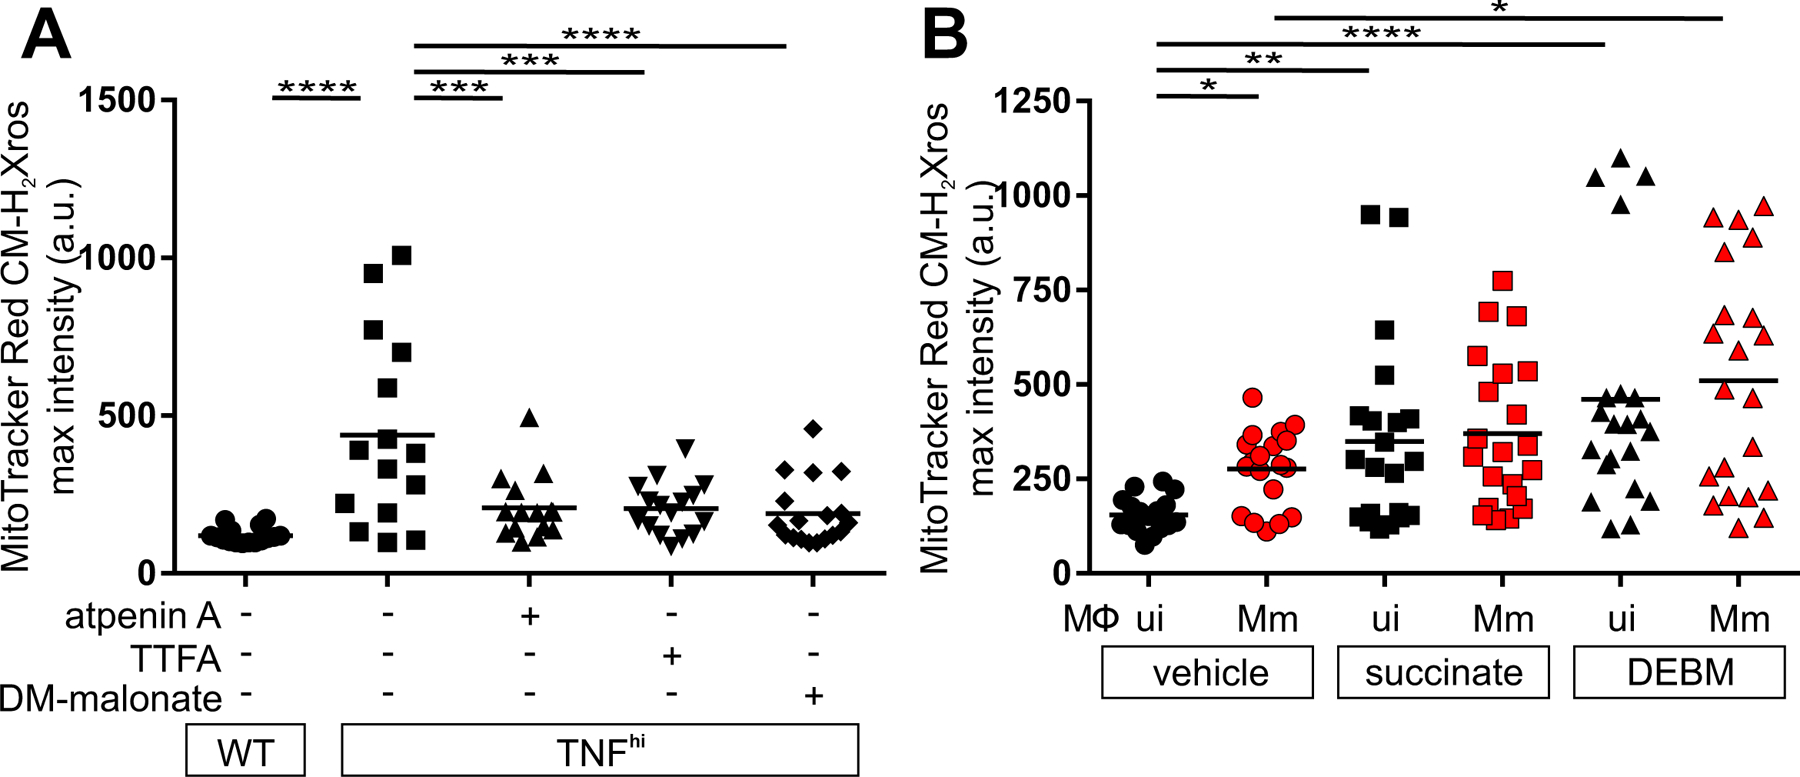
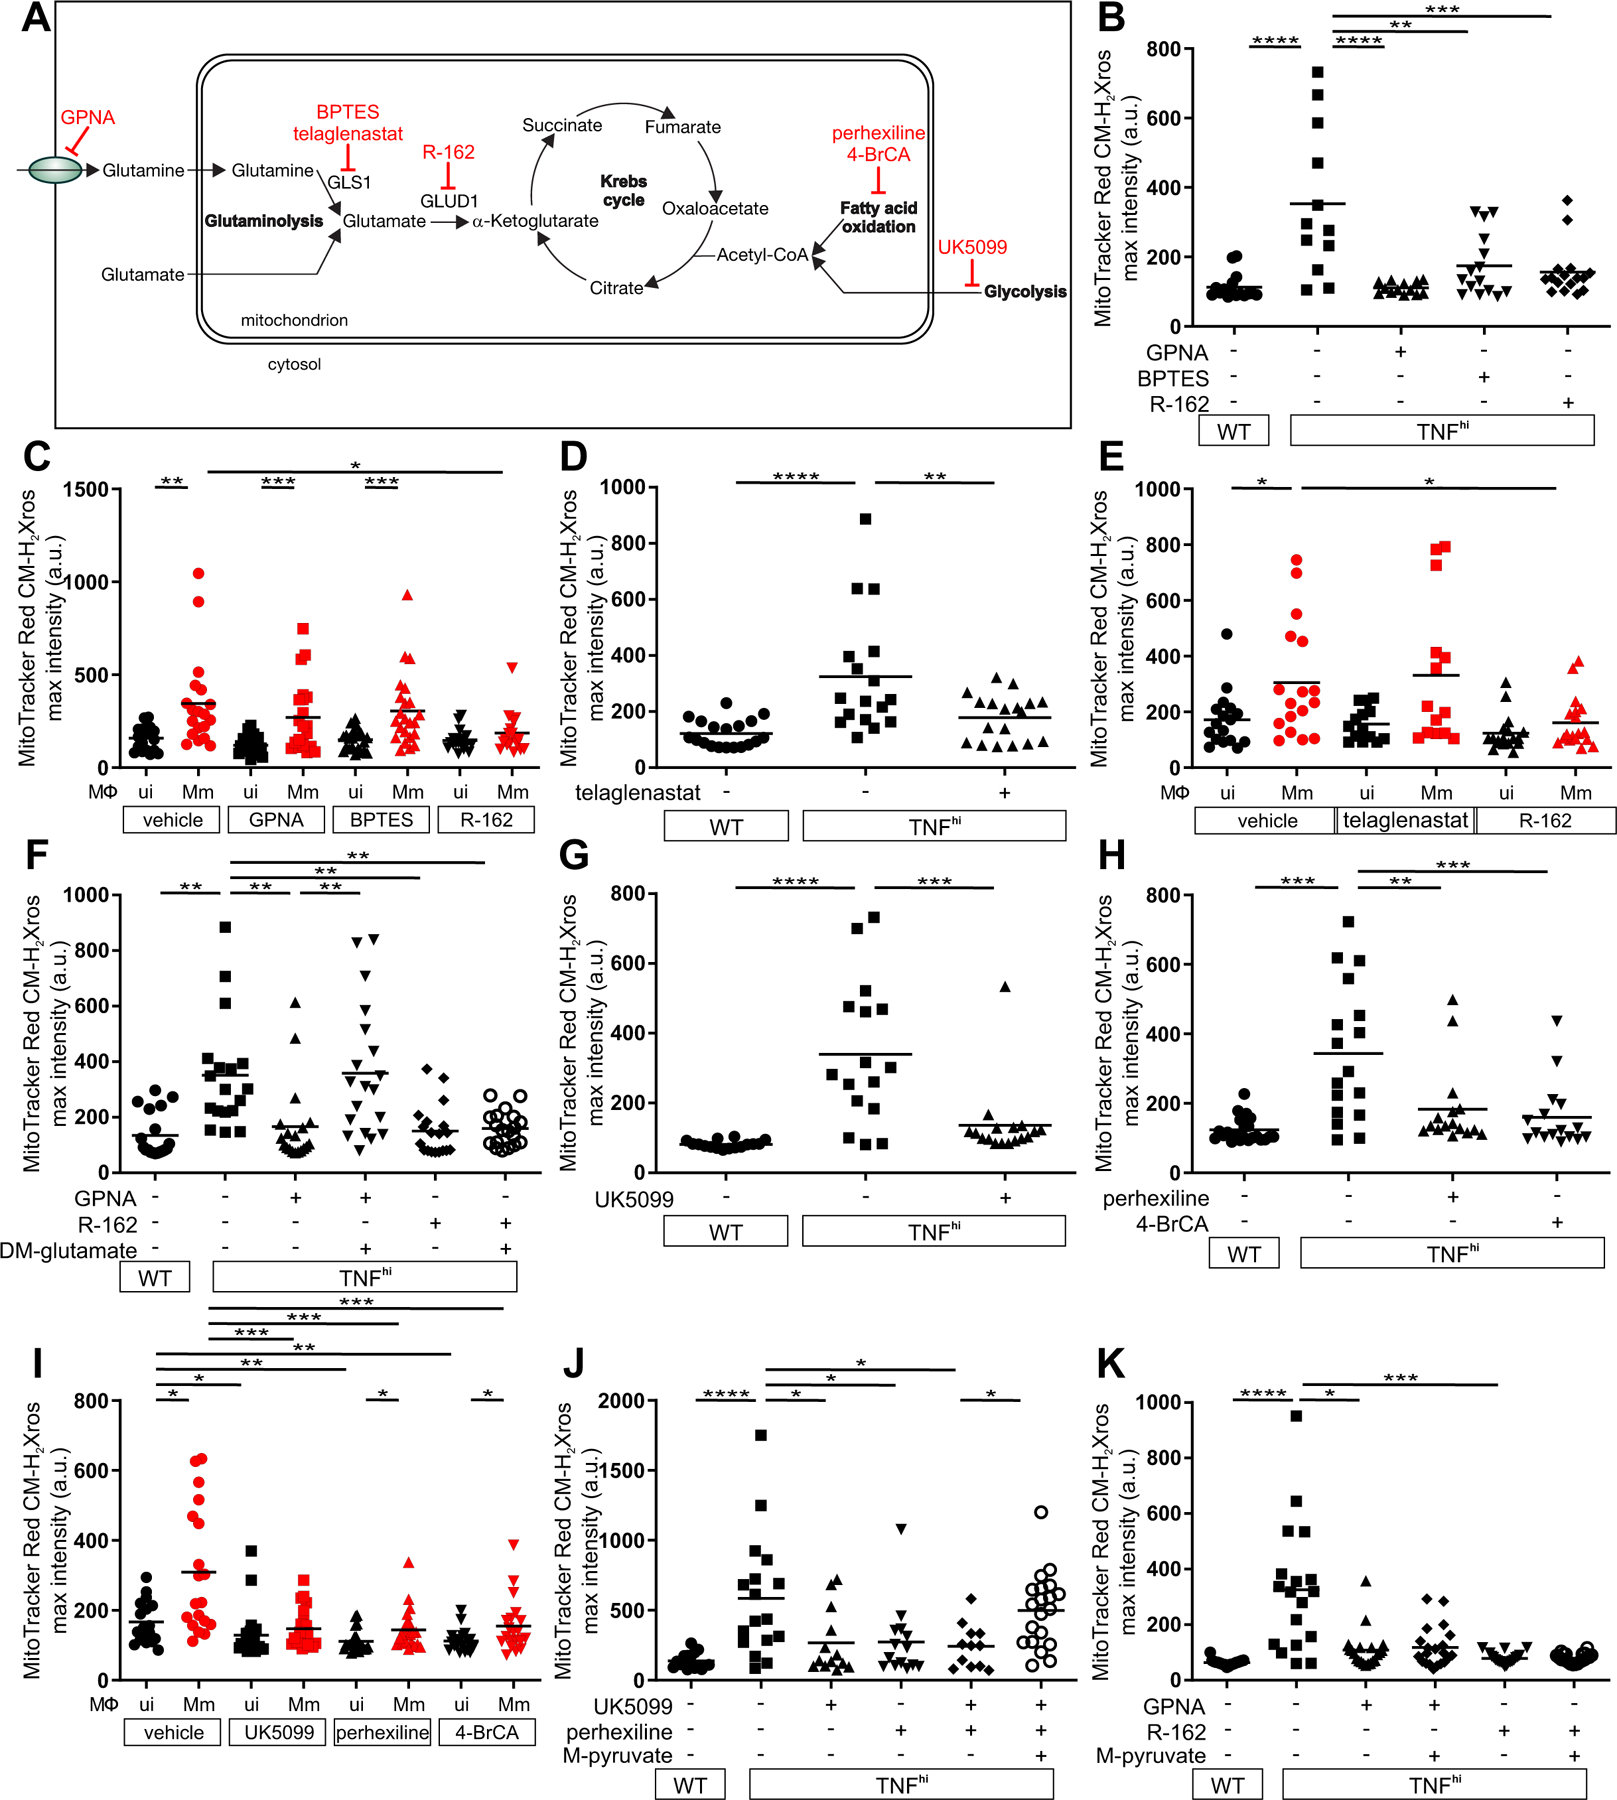
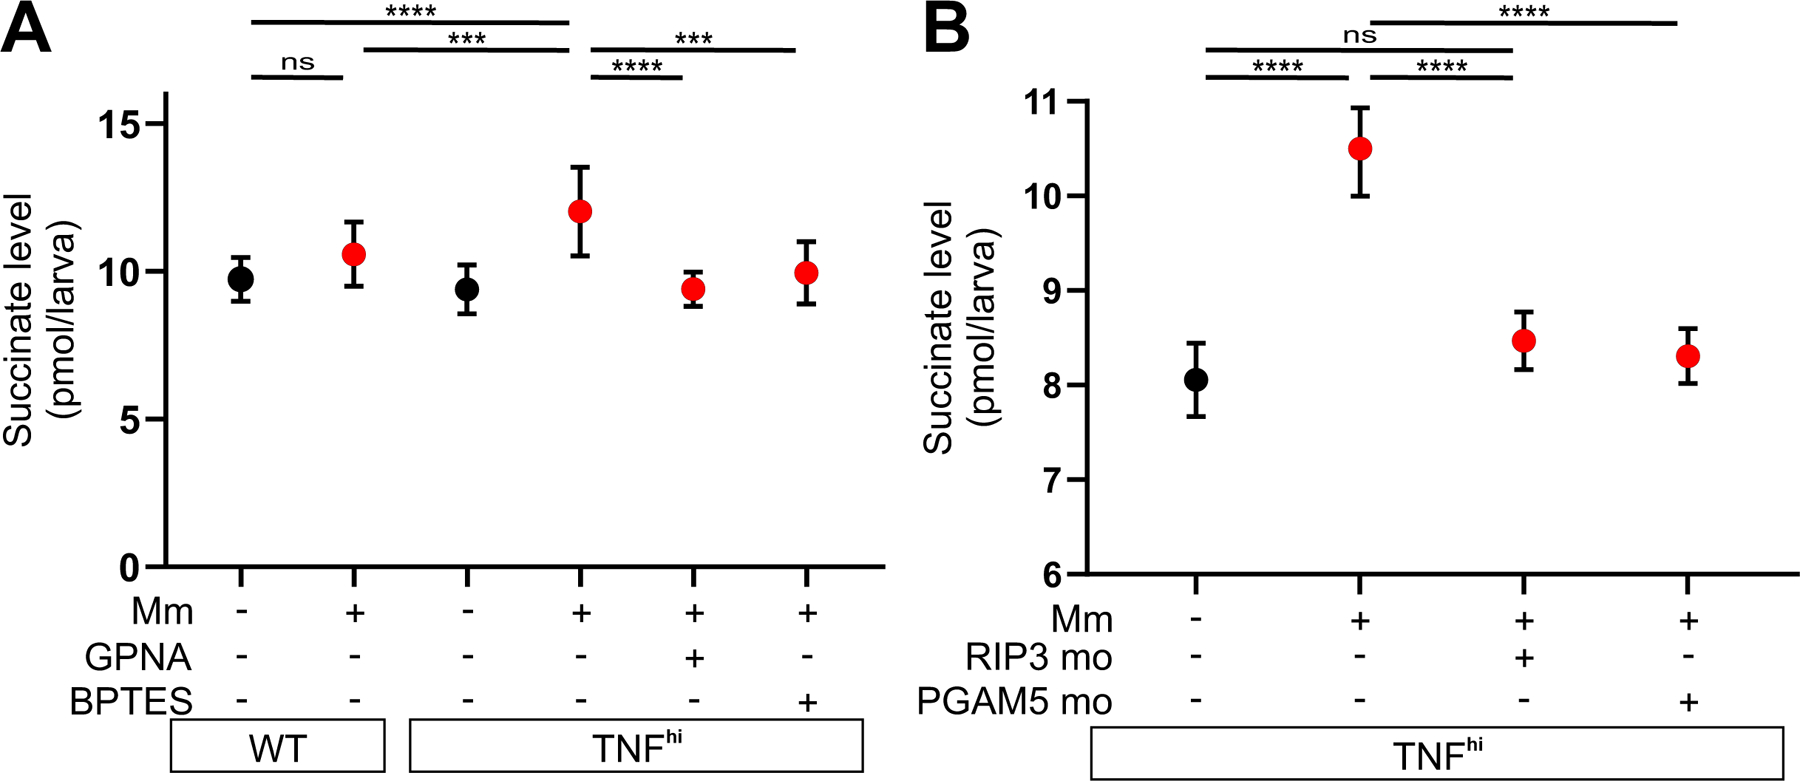
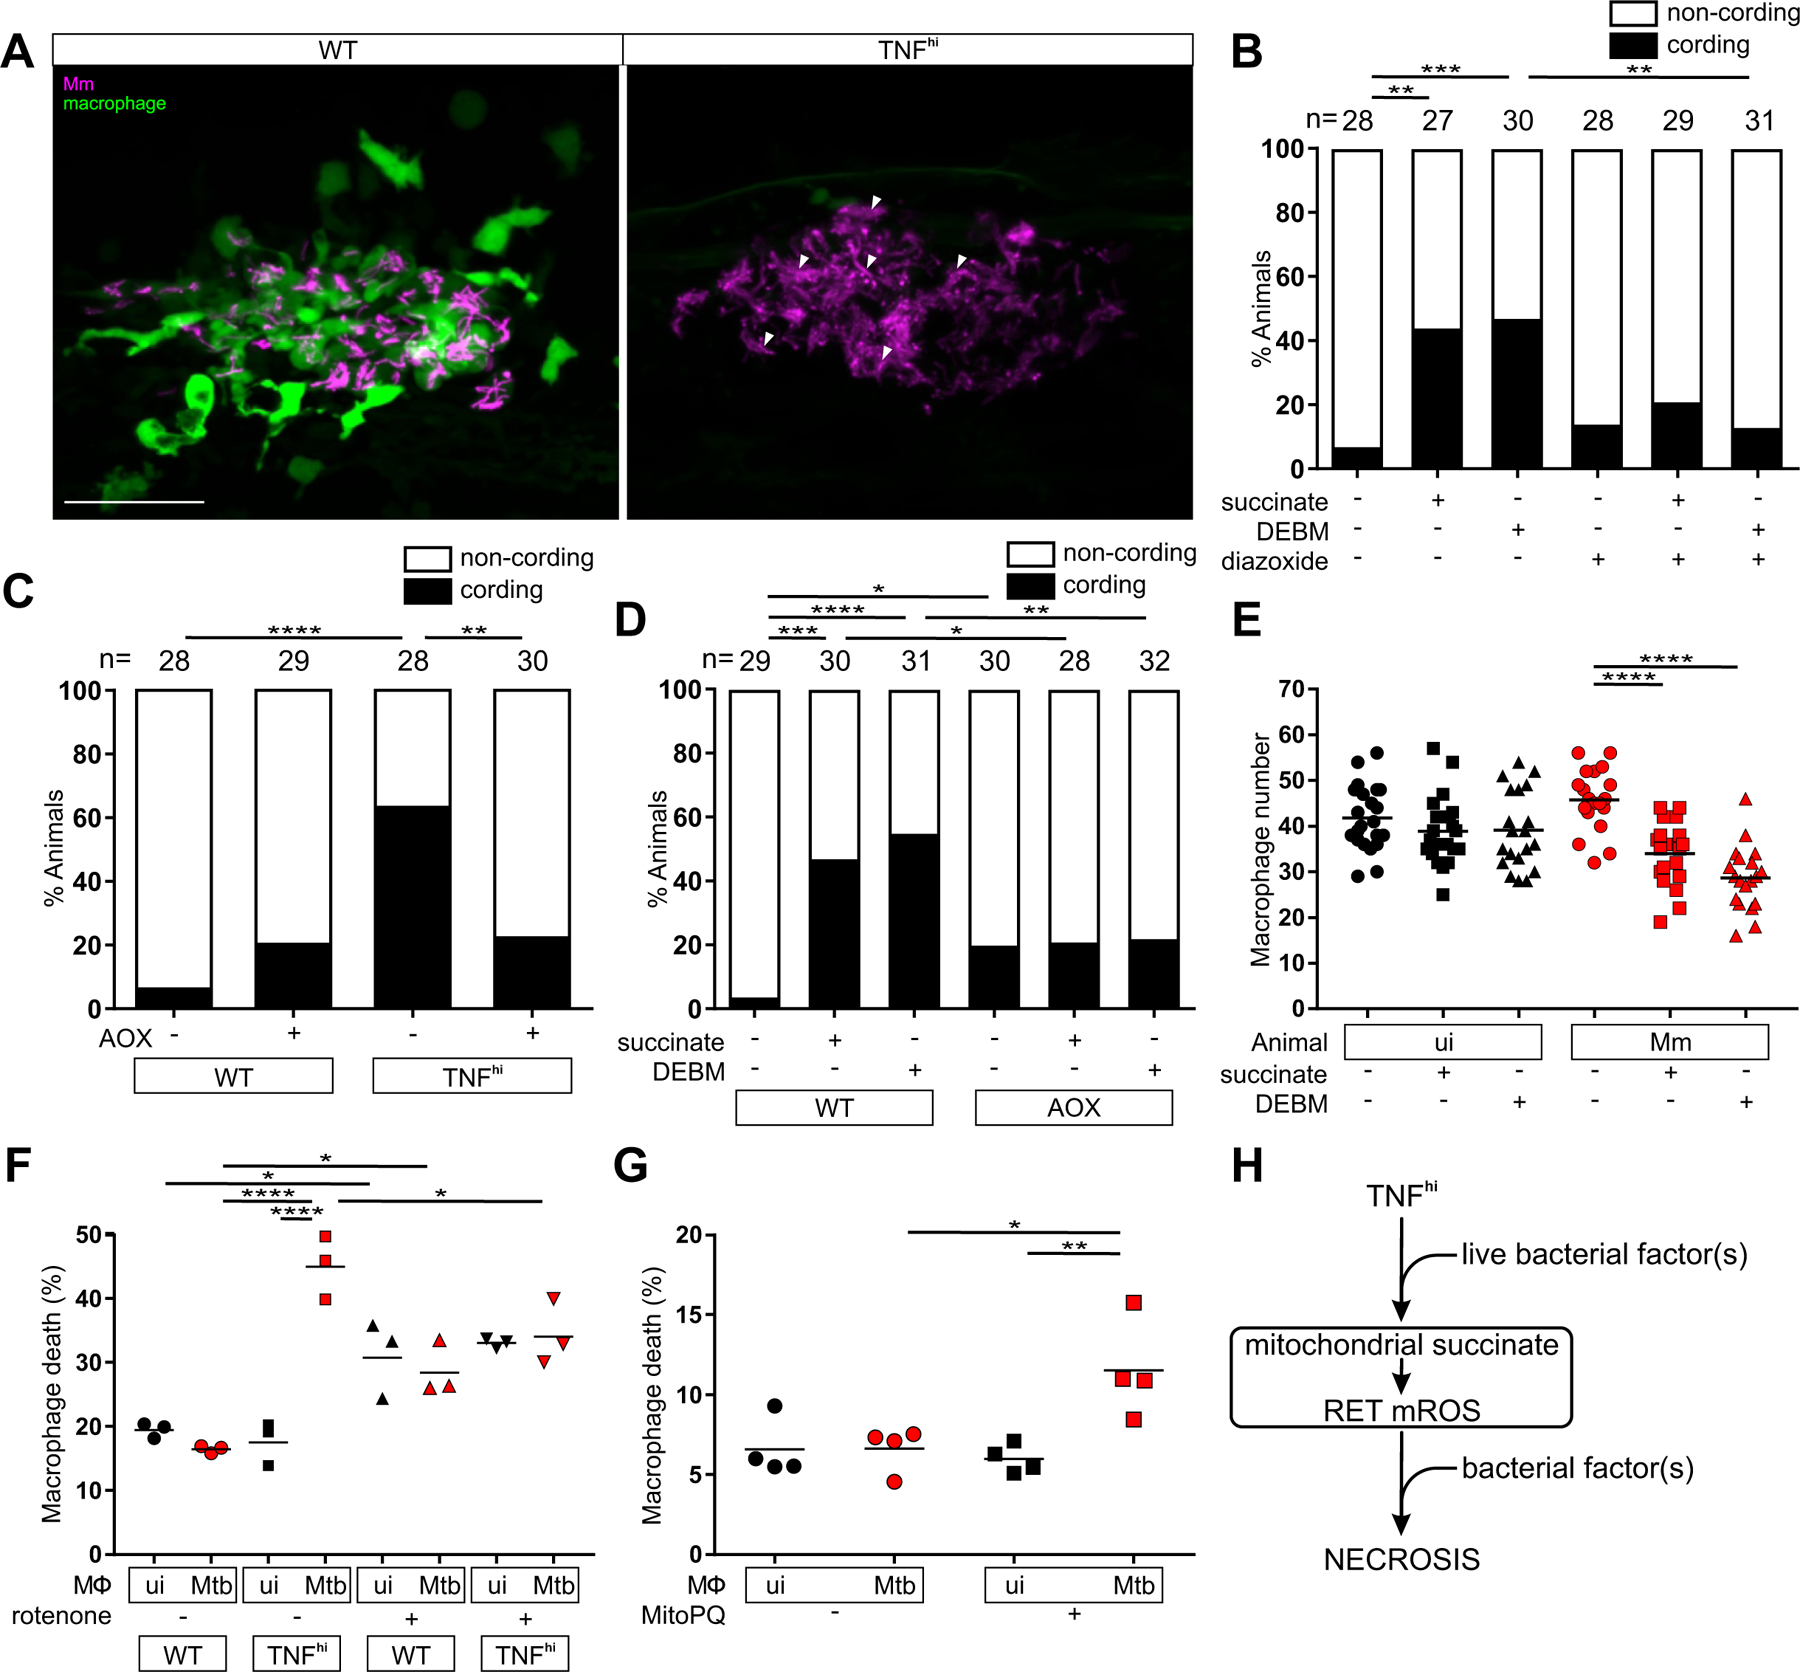
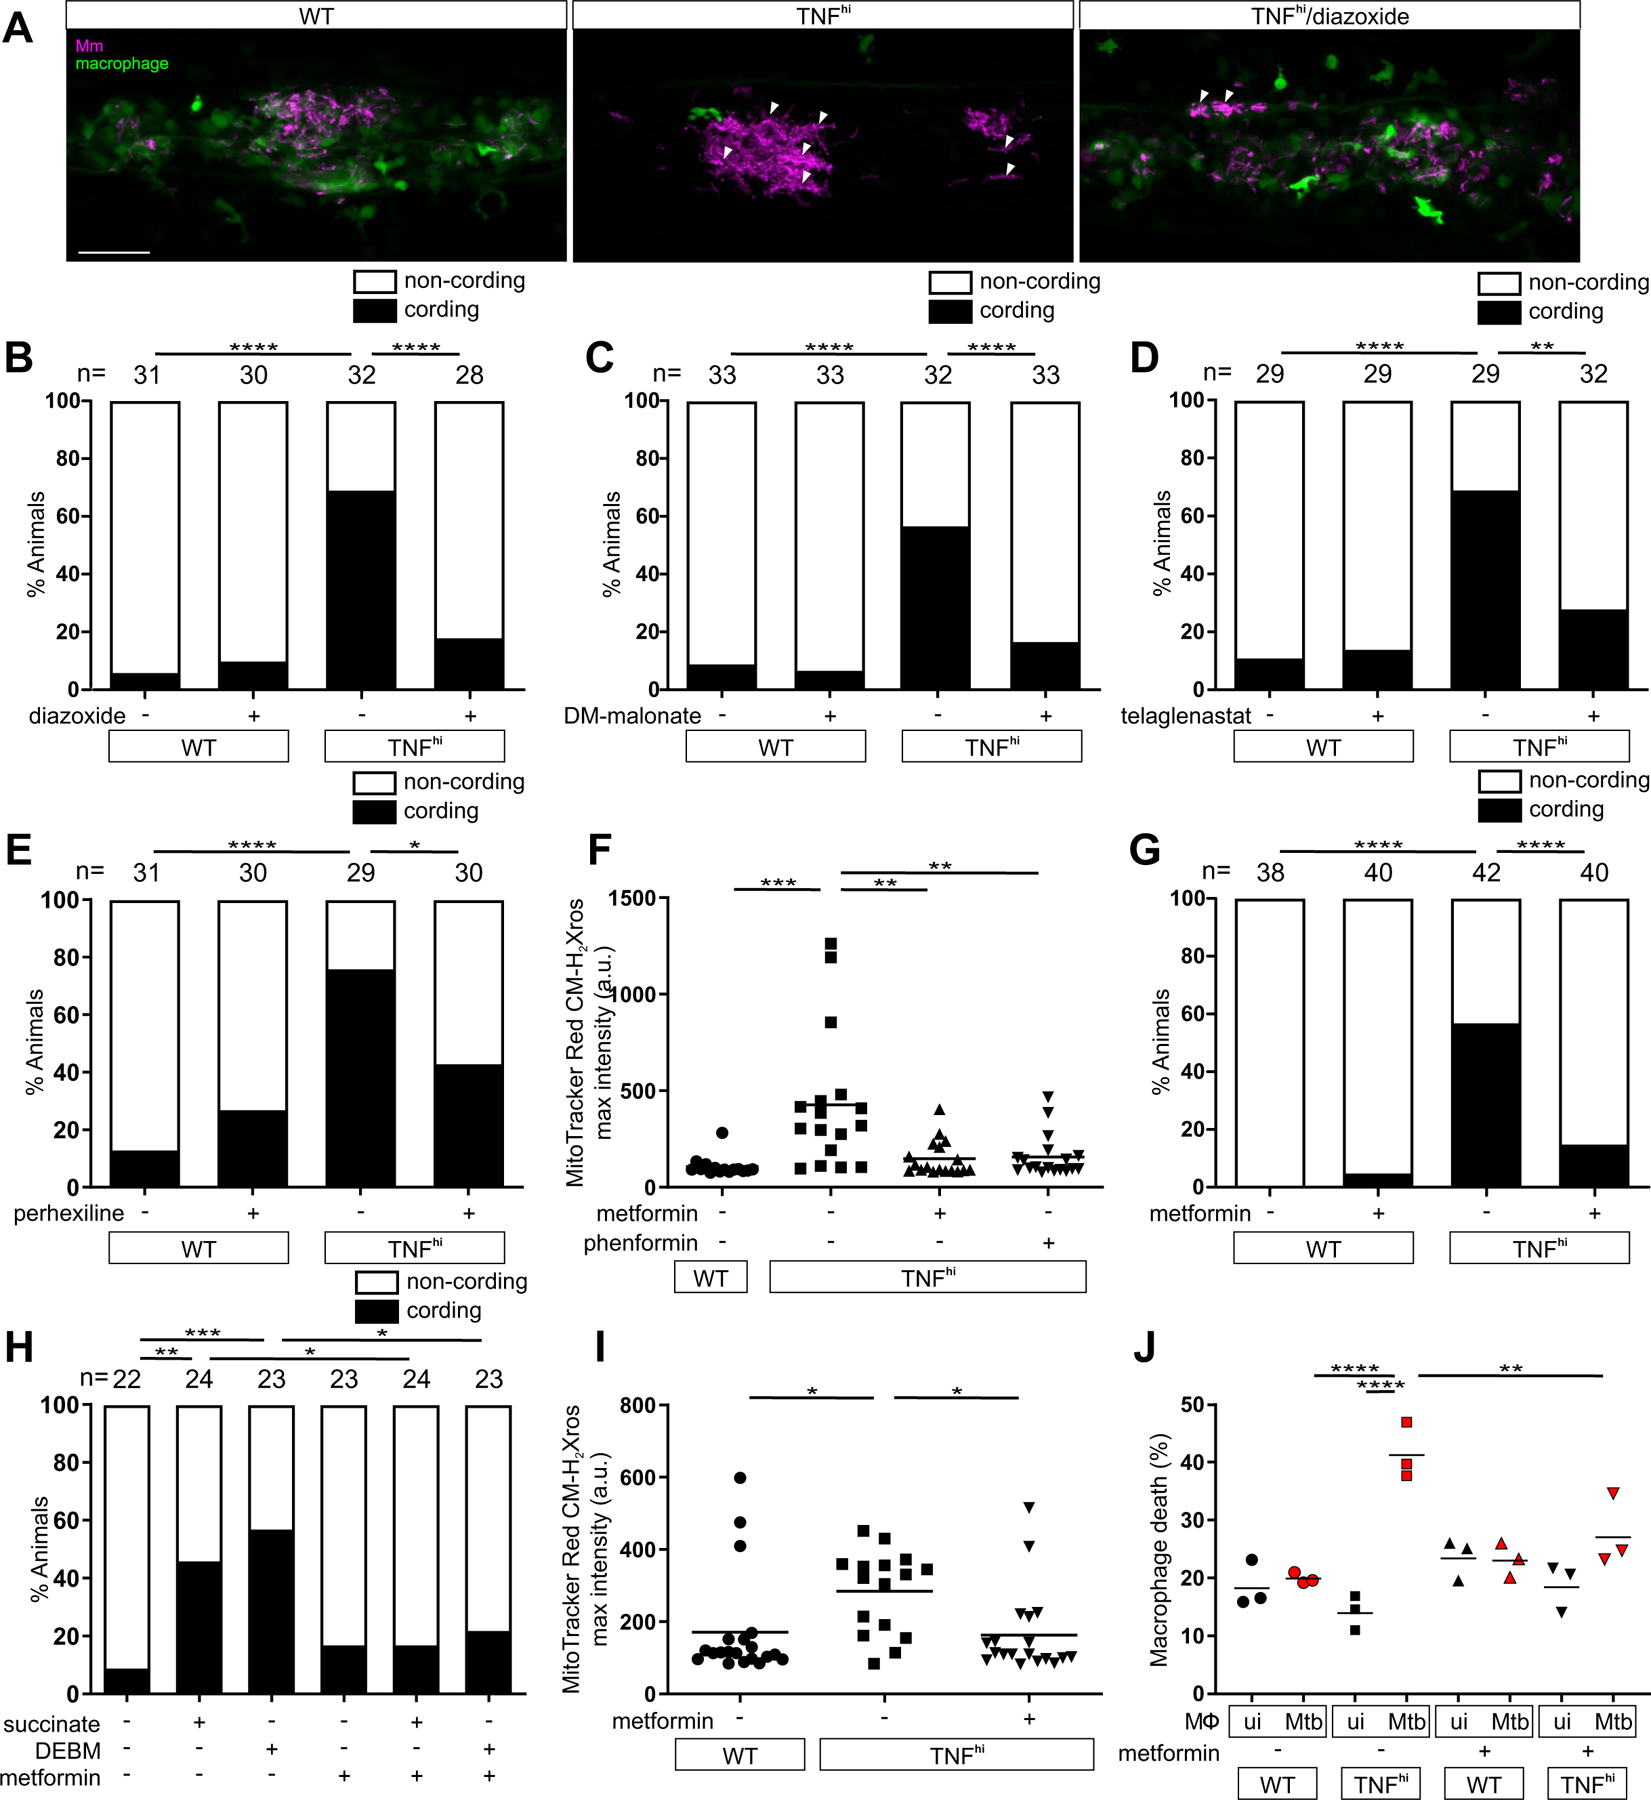
Tumor necrosis factor (TNF) is a critical host resistance factor against tuberculosis. However, excess TNF produces susceptibility by increasing mitochondrial reactive oxygen species (mROS), which initiate a signaling cascade to cause pathogenic necrosis of mycobacterium-infected macrophages. In zebrafish, we identified the mechanism of TNF-induced mROS in tuberculosis. Excess TNF in mycobacterium-infected macrophages elevates mROS production by reverse electron transport (RET) through complex I. TNF-activated cellular glutamine uptake leads to an increased concentration of succinate, a Krebs cycle intermediate. Oxidation of this elevated succinate by complex II drives RET, thereby generating the mROS superoxide at complex I. The complex I inhibitor metformin, a widely used antidiabetic drug, prevents TNF-induced mROS and necrosis of Mycobacterium tuberculosis-infected zebrafish and human macrophages; metformin may therefore be useful in tuberculosis therapy.


Conflict of interest statement

Competing interests: The authors declare that they have no competing interests. To facilitate open access, the authors have applied a CC BY public copyright license to any Author Accepted Manuscript version arising from this submission.

Figures

Figure 1:
Figure 1:. ETC-derived mROS drive necrosis of Mm-infected macrophages in TNF-high conditions.
(A) Representative pseudocolored confocal images of wild-type (WT) or TNFhi larvae with YFP-expressing macrophages (green), 1 day post infection (dpi) with EBFP2-expresssing Mm (blue), showing MitoTracker Red CM-H2Xros (magenta) fluorescence. White arrowheads, uninfected macrophages; yellow arrowheads, infected macrophages; yellow arrows, infected macrophages positive for mROS. Scale bar: 20 μm. (B) Quantification of mROS in wild-type or TNFhi larvae 9 hours post-injection of live or heat-killed Mm. Each point represents the mean maximum intensity fluorescence of MitoTracker Red CM-H2Xros per fish. Black symbols represent macrophages that do not contain bacteria. Red and purple symbols represent Mm-infected and heat-killed Mm-containing macrophages, respectively, in the same animal. Horizontal bars, means; *P<0.05 (one-way ANOVA with uncorrected Dunn’s post-test for differences between macrophages in the same animal and with Tukey’s post-test for differences between treatments). Representative of two independent experiments. (C to F) Quantification of mROS in larvae 1 dpi with Mm that are wild-type, TNFhi treated with (C) FCCP, (D) DNP, (E) nigericin, or (F) diazoxide, or vehicle. Horizontal bars represent means; ****P<0.0001 (one-way ANOVA with Tukey’s post-test). Representative of two-to-three independent experiments.
Figure 2:
Figure 2:. TNF induces RET mROS at complex I in mycobacterium-infected macrophages.
(A and B) Illustrations of mROS production at complex I during (A) forward electron transport and (B) reverse electron transport. ΔΨ, membrane potential; IMM, inner mitochondrial membrane; I-V, complexes I-V; zigzag arrows, induction; red blunted arrows, inhibition. (C to H) Quantification of mROS in larvae 1 dpi with Mm (C to E) or Mtb (F to H) that are (C) wild-type treated with vehicle or rotenone, (D) wild-type (WT), TNFhi treated with rotenone or vehicle, (E) wild-type, TNFhi, or TNFhi expressing AOX, (F) wild-type or TNFhi, (G) wild-type treated with rotenone or vehicle, (H) wild-type, or TNFhi treated with rotenone or vehicle. Horizontal bars represent means; *P<0.05, **P<0.01, ****P<0.0001 (one-way ANOVA with Dunn’s post-test (C, G, and H), Tukey’s post-test (D and E) or uncorrected Dunn’s post-test (F)). Black and red symbols in (C, F, and G) represent uninfected (ui) and infected macrophages, respectively, in the same animals. (C to G) representative of two-to-three independent experiments; (H) data from a single experiment.
Figure 3:
Figure 3:. TNF increases succinate in mycobacterium-infected macrophages.
Quantification of mROS in larvae 1 dpi with Mm that are (A) wild-type (WT), or TNFhi treated with atpenin A, TTFA, DM-malonate, or vehicle (B) wild-type treated with succinate, DEBM, or vehicle. Horizontal bars represent means; *P<0.05; **P<0.01, ****P<0.0001 (one-way ANOVA with Tukey’s post-test (A) or Dunn’s post-test (B)). Black and red symbols in (B) represent uninfected (ui) and Mm-infected (Mm) macrophages, respectively, in the same animal. (A and B) representative of two-to-three independent experiments.
Figure 4:
Figure 4:. TNF-induced glutamine cellular uptake and increased glutaminolysis is responsible for RET and mROS production in mycobacterium-infected macrophages.
(A) Illustration of main metabolic pathways fueling the Krebs cycle with inhibitors used (truncated red arrows). (B to K) Quantification of mROS in larvae 1 dpi with Mm that are (B) wild-type (WT) or TNFhi treated with GPNA, BPTES, R-162, or vehicle, (C) wild-type treated with GPNA, BPTES, R-162, or vehicle, (D) wild-type or TNFhi treated with telaglenastat or vehicle, (E) wild-type treated with telaglenastat, R-162, or vehicle, (F) wild-type or TNFhi treated with vehicle, or GPNA or R-162 alone or in combination with DM-glutamate, (G) wild-type or TNFhi treated with UK5099 or vehicle, (H) wild-type, or TNFhi treated with perhexiline, 4-BrCA, or vehicle, (I) wild-type treated with UK5099, perhexiline, 4-BrCA, or vehicle, (J and K) wild-type or TNFhi treated with vehicle, or UK5099 or perhexiline (J), or GPNA or R-162 (K) alone or in combination with M-pyruvate. Horizontal bars represent means; *P<0.05; **P<0.01, ***P<0.001, ****P<0.0001 (one-way ANOVA with Tukey’s post-test (B, D, F to H, J and K), Dunn’s post-test (C, E, and I)). Black and red symbols in (C, E, and I) represent uninfected (ui) and Mm-infected (Mm) macrophages, respectively, in the same animals. (B to D and G to I), representative of two-to-three independent experiments; (E, F, J, and K); data from a single experiment.
Figure 5:
Figure 5:. TNF-induced glutaminolysis increases succinate levels in mycobacterium-infected macrophages in a RIP3- and PGAM5-dependent manner.
(A and B) Quantification of succinate in zebrafish larvae 1 dpi with Mm or mock-injected, that are (A) wild-type (WT) or TNFhi treated with GPNA, BPTES, or vehicle and (B) TNFhi, TNFhi RIP3 morphants, or TNFhi PGAM5 morphants. Each point represents the mean of four independent experiments in A and two independent experiments in B. Horizontal bars represent pooled SD. ***P<0.001, ****P<0.0001 (one-way ANOVA with Tukey’s post-test).
Figure 6:
Figure 6:. TNF-mediated increased glutamine cellular uptake in mycobacterium-infected increases succinate oxidation, mROS and necrosis.
(A) Representative pseudocolored confocal images of 5 dpi granulomas in wild-type (WT) or TNFhi larvae with YFP-expressing macrophages (green) infected with tdTomato-expressing Mm (magenta). Arrowheads, extracellular cording bacteria. Scale bar: 50 μm. (B) Bacterial cording in wild-type larvae 5 dpi with Mm, treated with vehicle, or succinate or DEBM alone or in combination with diazoxide; **P<0.01, ***P<0.001 (Fisher’s exact test). (C) Bacterial cording 5 dpi with Mm in wild-type and TNFhi larvae and wild-type and TNFhi larvae expressing AOX; **P<0.01, ****P<0.0001 (Fisher’s exact test). (D) Bacterial cording 5 dpi wild-type or AOX-expressing larvae infected with Mm and treated with succinate, DEBM, or vehicle; *P<0.05; **P<0.01, ***P<0.001, ****P<0.0001 (Fisher’s exact test). (E) Number of trunk macrophages in Mm-infected (Mm) larvae and mock-injected (ui) larvae 1 dpi. Horizontal bars represent means; ****P<0.0001 (one-way ANOVA with Dunn’s post-test). (F and G) Percentage of dead THP-1 macrophages at 5 hours post-TNF, treated with (F) rotenone or vehicle starting 1 hour before TNF addition or (G) MitoParaquat (MitoPQ) or vehicle for 5 hours. Black and red symbols represent uninfected (ui) and Mtb-infected macrophages (Mtb), respectively, within the same treatment well. Horizontal bars represent means; *P<0.05, **P<0.01, ****P<0.0001 (one-way ANOVA with Tukey’s post-test). (H) Schematic diagram showing the role of TNF, mROS and mycobacterial factor(s) in TNF-mediated necrosis of mycobacterium-infected macrophages. (C, D to E, and G) representative of two independent experiments; (B and F) data from a single experiment.
Figure 7:
Figure 7:. Currently available drugs can intercept TNF-induced mROS production and inhibit necrosis of mycobacterium-infected macrophages.
Representative pseudocolored confocal images of 5 dpi granulomas in larvae with yellow fluorescent macrophages (green) that are wild-type (WT), or TNFhi treated with diazoxide or vehicle, infected with red fluorescent Mm (magenta). Arrowheads, extracellular cording bacteria. Scale bar: 50 μm. (B to E) Bacterial cording in wild-type or TNFhi larvae 5 dpi with Mm, treated with vehicle or (B) diazoxide, (C) DM-malonate, (D) telaglenastat, or (E) perhexiline. *P<0.05; **P<0.01, ****P<0.0001 (Fisher’s exact test). (F) Quantification of mROS in wild-type or TNFhi larvae 1dpi with Mm, treated with metformin, phenformin, or vehicle. Horizontal bars represent means; **P<0.01; ***P<0.001 (one-way ANOVA with Tukey’s post-test). (G) Bacterial cording in wild-type or TNFhi larvae 5 dpi with Mm, treated with metformin or vehicle. ****P<0.0001 (Fisher’s exact test). (H) Bacterial cording in wild-type larvae 5 dpi with Mm, treated with vehicle, or succinate or DEBM alone or in combination with metformin. *P<0.05; **P<0.01, ***P<0.001 (Fisher’s exact test). (I) Quantification of mROS in wild-type or TNFhi 1 dpi with Mtb, treated with metformin or vehicle. Horizontal bars represent means; *P<0.05 (one-way ANOVA with Tukey’s post-test). (J) Percentage of dead THP-1 macrophages at 5 hours post-TNF, treated with metformin or vehicle starting 1 hour before TNF addition. Black and red symbols represent uninfected (ui) and Mtb-infected macrophages (Mtb), respectively, within the same treatment well. Horizontal bars represent means; **P<0.01, ****P<0.0001 (one-way ANOVA with Tukey’s post-test). (B to G, and I) representative of two independent experiments; (H and J) data from a single experiment.

References

    1. Keane J et al., Tuberculosis associated with infliximab, a tumor necrosis factor alpha-neutralizing agent. N Engl J Med 345, 1098–1104 (2001). - PubMed
    1. Behr MA, Edelstein PH, Ramakrishnan L, Is Mycobacterium tuberculosis infection life long? BMJ 367, l5770 (2019). - PMC - PubMed
    1. Whitworth LJ et al., Elevated cerebrospinal fluid cytokine levels in tuberculous meningitis predict survival in response to dexamethasone. PNAS 118(10):e2024852118. doi: 10.1073/pnas.2024852118 (2021). - DOI - PMC - PubMed
    1. Tobin DM et al., Host genotype-specific therapies can optimize the inflammatory response to mycobacterial infections. Cell 148, 434–446 (2012). - PMC - PubMed
    1. Roca FJ, Ramakrishnan L, TNF dually mediates resistance and susceptibility to mycobacteria via mitochondrial reactive oxygen species. Cell 153, 521–534 (2013). - PMC - PubMed

MeSH terms