. 2022 Jun 28;119(26):e2111506119.
doi: 10.1073/pnas.2111506119. Epub 2022 Jun 22.

Glycan degradation promotes macroautophagy

Affiliations

Glycan degradation promotes macroautophagy

Alice D Baudot et al. Proc Natl Acad Sci U S A. .

Abstract

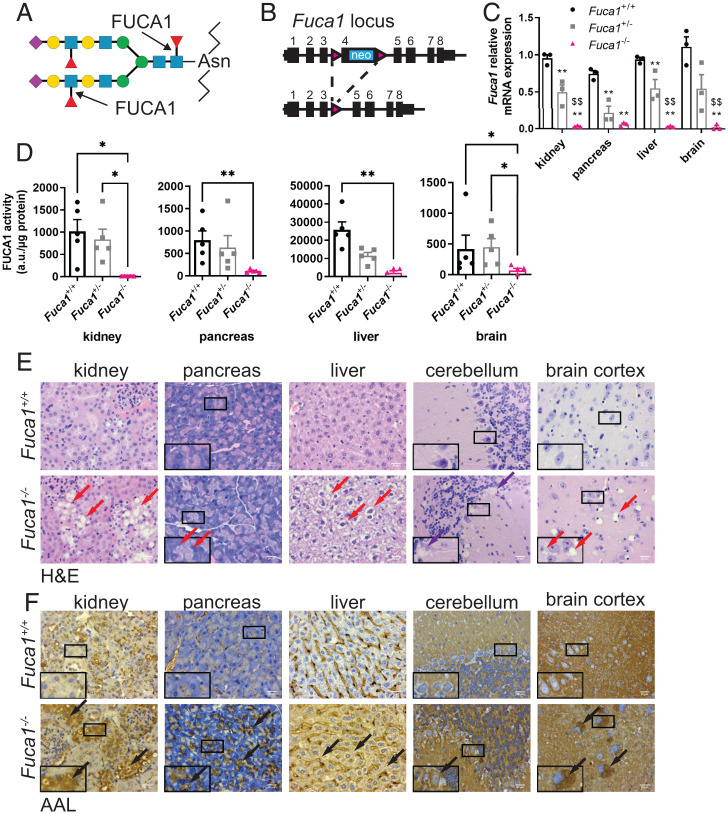
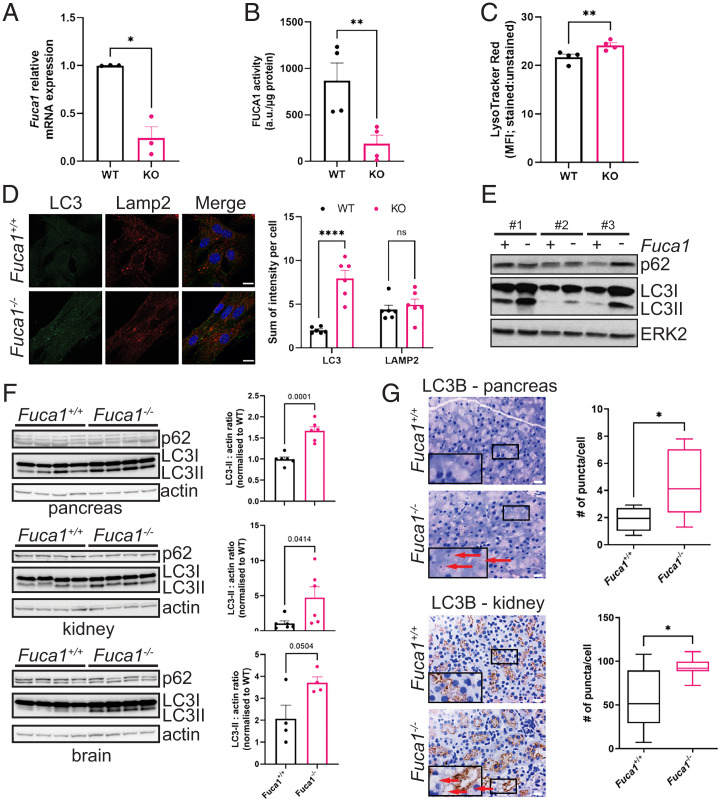
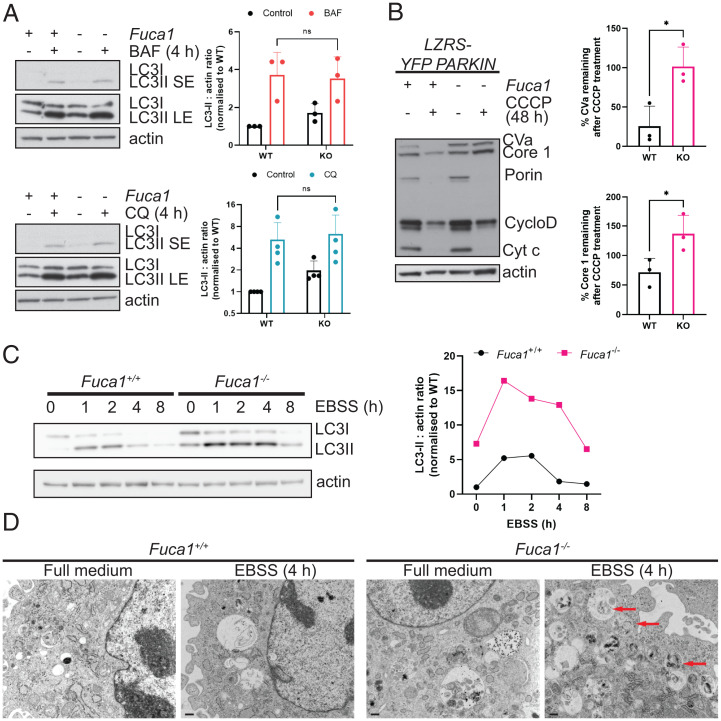
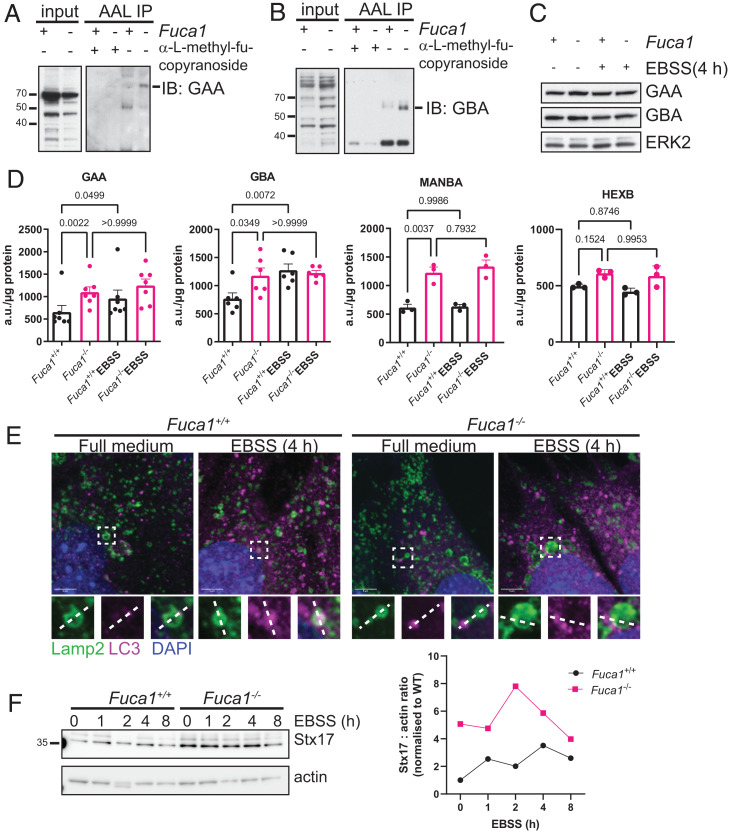
Macroautophagy promotes cellular homeostasis by delivering cytoplasmic constituents to lysosomes for degradation [Mizushima, Nat. Cell Biol. 20, 521-527 (2018)]. However, while most studies have focused on the mechanisms of protein degradation during this process, we report here that macroautophagy also depends on glycan degradation via the glycosidase, α-l-fucosidase 1 (FUCA1), which removes fucose from glycans. We show that cells lacking FUCA1 accumulate lysosomal glycans, which is associated with impaired autophagic flux. Moreover, in a mouse model of fucosidosis-a disease characterized by inactivating mutations in FUCA1 [Stepien et al., Genes (Basel) 11, E1383 (2020)]-glycan and autophagosome/autolysosome accumulation accompanies tissue destruction. Mechanistically, using lectin capture and mass spectrometry, we identified several lysosomal enzymes with altered fucosylation in FUCA1-null cells. Moreover, we show that the activity of some of these enzymes in the absence of FUCA1 can no longer be induced upon autophagy stimulation, causing retardation of autophagic flux, which involves impaired autophagosome-lysosome fusion. These findings therefore show that dysregulated glycan degradation leads to defective autophagy, which is likely a contributing factor in the etiology of fucosidosis.

Keywords: fucosidosis; lysosomes; macroautophagy; α-l-fucosidase 1.


Conflict of interest statement

The authors declare no competing interest.

Figures

Fig. 1.
Fig. 1.
Generation of a mouse model of fucosidosis. (A) Schematic showing that FUCA1 cleaves both terminal fucose and core fucose linked to an N-acetylglucosamine (purple diamond: N-acetylneuraminic acid; yellow circle: galactose; blue square: N-acetylglucosamine; green circle: mannose; red triangle: fucose). (B) Schematic representation of the Fuca1-targeted allele and the mutated allele after Cre recombination. (C) Relative Fuca1 mRNA expression from different organs was determined by qRT-PCR (three mice per genotype). Results are represented as mean ± SEM (two-way ANOVA with Bonferroni correction. Fuca1+/+ vs. Fuca1+/− or Fuca1−/− **P < 0.01. Fuca1+/− vs. Fuca1−/− $$P < 0.01). (D) FUCA1 activity was measured from lysates of the indicated organs (five mice per genotype, mean ± SEM) and expressed as arbitrary units (a.u.) per microgram of protein (Kruskal–Wallis test; *P < 0.05, **P < 0.01). (E and F) Organ sections of both Fuca1+/+ (Upper) and Fuca1/− (Lower) mice were stained with H&E (E) and AAL (F). Red arrows indicate cytoplasmic vacuolation, purple arrows indicate Purkinje cell loss, black arrows indicate accumulation of glycan species in the specified tissues. Pictures were taken using a Zeiss AX10 microscope with a 40× objective. The images shown are representative of changes observed in six mice (aged between 90 and 220 d). (Scale bars, 20 µm.) Insets are magnified (2×) crops from the same images to show specific staining.
Fig. 2.
Fig. 2.
FUCA1 loss modulates autophagy both in vitro and in vivo. (A) Primary Fuca1flox/flox MEFs were infected with a retrovirus expressing the Cre recombinase (KO) or a retrovirus control empty vector (WT). Fuca1 relative mRNA expression was determined by qRT-PCR and expressed as the mean of three independent experiments ± SEM (two-tailed paired t test *P = 0.0238). (B) FUCA1 activity was measured and expressed as the mean of three independent experiments ± SEM (two-tailed paired t test **P = 0.0073). (C) LysoTracker red staining was analyzed by flow cytometry and expressed as the mean fluorescence intensity (MFI) ratio of stained versus unstained samples (four independent experiments ± SEM; two-tailed paired t test **P = 0.0046). (D) Fuca1flox/flox CTRL (WT) and Fuca1flox/flox CRE (KO) MEFs were analyzed by immunofluorescence using antibodies directed against LC3B and Lamp2. Nuclei were stained with DAPI. Staining was quantified from six different pictures and expressed as the sum of intensity per cell ± SEM (two-way ANOVA, Sidak’s multiple comparison test: LC3 ****P < 0.0001; LAMP2 n.s.). (Scale bar, 20 µm.) (E) Primary Fuca1flox/flox MEFs isolated from three different embryos were infected with a Cre recombinase retrovirus (Fuca1-) or a retrovirus control empty vector (Fuca1+). LC3B and p62 expression were assessed by immunoblot. Total ERK was used as a loading control. (F) Pancreas, kidney, and brain samples from Fuca1+/+ and Fuca1−/− mice were lysed, and LC3B and p62 analyzed by immunoblot. Representative immunoblot obtained from four mice per genotype is shown. Actin was used as a loading control. LC3II : actin ratio was quantified by densitometry using four to six different samples per genotype (two-tailed unpaired t test; pancreas ***P = 0.0001, kidney *P = 0.0414, brain P = 0.0504). (G) LC3B IHC of pancreas and kidney of Fuca1+/+ and Fuca1−/− mice. LC3+ puncta in pictures (red arrows) were quantified for Fuca1+/+ pancreas (n = 6) and kidney (n = 10), and Fuca1−/− pancreas (n = 6) and kidney (n = 9). (Scale bar, 20 µm.) Insets are magnified (2×) crops from the same images to show specific staining. Box plots represent the quantification of LC3 puncta per cell (Mann–Whitney test; pancreas *P = 0.026, kidney *P = 0.0124).
Fig. 3.
Fig. 3.
FUCA1 loss impairs autophagy flux. (A) Immortalized Fuca1flox/flox MEFs were infected with a retrovirus expressing the Cre recombinase (KO) or a retrovirus control empty vector (WT) and treated with 100 nM BAF or 10 µM CQ for 4 h. Cell lysates were analyzed by immunoblotting using antibodies directed against LC3B and actin, which was used as a loading control. The immunoblot shown is representative of the results observed in three to four independent experiments, and quantified (Right) ± SEM (two-way ANOVA, Sidak’s multiple comparison test: n.s.). LE, long exposure; SE, short exposure. (B) Fuca1+/+ and Fuca1−/− MEFs were infected with a retrovirus expressing YFP-Parkin (LZRS-YFP-PARKIN). Cells were then treated with 12.5 μM CCCP for 48 h. Cell lysates were analyzed using the MitoProfile Membrane integrity WB Antibody Mix. Actin was used as a loading control. The immunoblot shown is representative of the results observed in three independent experiments. The percentage of remaining CVa and Core 1 in Fuca1 WT and KO MEFs upon CCCP treatment is quantified ± SEM (two-tailed unpaired t test, CVa *P = 0.021, Core 1 *P = 0.0445). (C) Immortalized Fuca1+/+ and Fuca1−/− MEFs were incubated in EBSS for the indicated time period. Cell lysates were analyzed by Western blot using LC3B and actin antibodies. The LC3II : actin ratio is plotted on the right. (D) Primary Fuca1+/+ and Fuca1−/− MEFs were incubated in EBSS for 4 h. Electron microscopy images show autophagic degradative vacuoles (red arrows). (Scale bars, 500 nm.)
Fig. 4.
Fig. 4.
FUCA1 regulates fucosylation status and activities of lysosomal enzymes, and promotes autophagosome–lyosome fusion. (AD) Primary Fuca1flox/flox MEFs were infected with a retrovirus expressing the Cre recombinase (Fuca1−/−) or a retrovirus control empty vector (Fuca1+/+). Cell lysates were immunoprecipitated using biotinylated AAL, preincubated with methyl-α-l-fucopyranoside as a control (A and B). Eluted proteins were then loaded on a gel for immunoblotting analysis using antibodies directed against GAA (A) and GBA (B). Whole-cell lysates (input) were analyzed using the same antibodies. (C) Primary Fuca1+/+ and Fuca1−/− MEFs were incubated in EBSS for 4 h. Cell lysates were analyzed by Western blot using antibodies against GAA, GBA, and ERK2, which was used as a loading control. (D) GAA, GBA, MANBA, and HEXB enzymatic activities were assessed in Fuca1+/+ and Fuca1−/− MEFs under baseline and starvation conditions, and expressed as arbitrary units (a.u.) per microgram of total protein (n = 3 independent experiments, one-way ANOVA with Bonferroni multiple comparison test). (E) Subcellular localization of LC3B and Lamp2 was visualized in immortalized Fuca1+/+ and Fuca1−/− MEFs under baseline conditions and after 4-h EBSS starvation by confocal microscopy. Nuclei were stained with DAPI. (Scale bars, 5 µm.) Regions of interest are highlighted in white boxes. (F) Immortalized Fuca1+/+ and Fuca1−/− MEFs were incubated in EBSS for the indicated time period. Cell lysates were analyzed by Western blot using Stx17 and actin antibodies. The Stx17 : actin ratio is plotted on the right.

References

    1. Mizushima N., A brief history of autophagy from cell biology to physiology and disease. Nat. Cell Biol. 20, 521–527 (2018). - PubMed
    1. Axe E. L., et al. , Autophagosome formation from membrane compartments enriched in phosphatidylinositol 3-phosphate and dynamically connected to the endoplasmic reticulum. J. Cell Biol. 182, 685–701 (2008). - PMC - PubMed
    1. Hailey D. W., et al. , Mitochondria supply membranes for autophagosome biogenesis during starvation. Cell 141, 656–667 (2010). - PMC - PubMed
    1. Hamasaki M., et al. , Autophagosomes form at ER-mitochondria contact sites. Nature 495, 389–393 (2013). - PubMed
    1. Ravikumar B., Moreau K., Jahreiss L., Puri C., Rubinsztein D. C., Plasma membrane contributes to the formation of pre-autophagosomal structures. Nat. Cell Biol. 12, 747–757 (2010). - PMC - PubMed

Publication types