. 2022 Oct;29(10):3039-3049.
doi: 10.1111/ene.15473. Epub 2022 Jul 11.

Brain age as a surrogate marker for cognitive performance in multiple sclerosis

Affiliations

Brain age as a surrogate marker for cognitive performance in multiple sclerosis

Stijn Denissen et al. Eur J Neurol. 2022 Oct.

Abstract

Background and purpose: Data from neuro-imaging techniques allow us to estimate a brain's age. Brain age is easily interpretable as 'how old the brain looks' and could therefore be an attractive communication tool for brain health in clinical practice. This study aimed to investigate its clinical utility by investigating the relationship between brain age and cognitive performance in multiple sclerosis (MS).

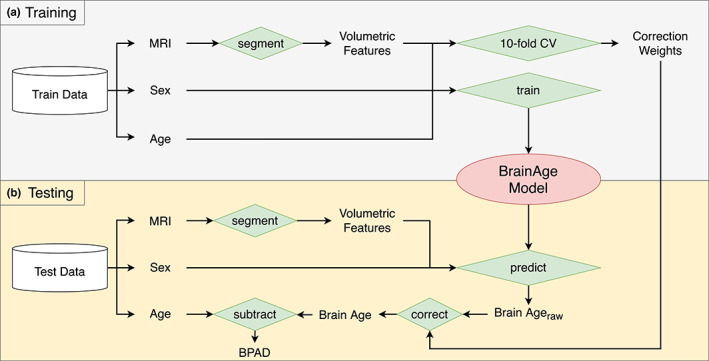
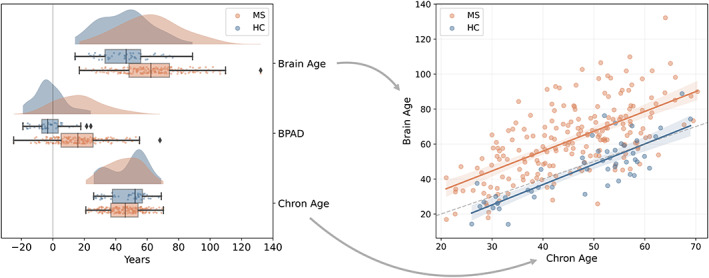
Methods: A linear regression model was trained to predict age from brain magnetic resonance imaging volumetric features and sex in a healthy control dataset (HC_train, n = 1673). This model was used to predict brain age in two test sets: HC_test (n = 50) and MS_test (n = 201). Brain-predicted age difference (BPAD) was calculated as BPAD = brain age minus chronological age. Cognitive performance was assessed by the Symbol Digit Modalities Test (SDMT).

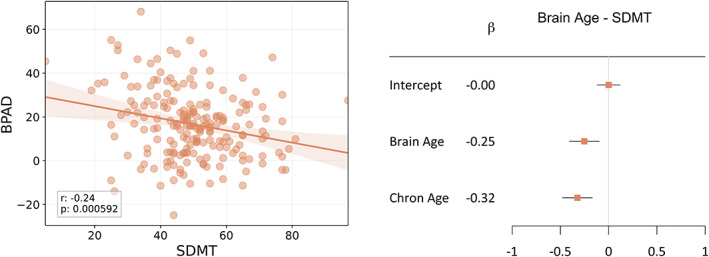
Results: Brain age was significantly related to SDMT scores in the MS_test dataset (r = -0.46, p < 0.001) and contributed uniquely to variance in SDMT beyond chronological age, reflected by a significant correlation between BPAD and SDMT (r = -0.24, p < 0.001) and a significant weight (-0.25, p = 0.002) in a multivariate regression equation with age.

Conclusions: Brain age is a candidate biomarker for cognitive dysfunction in MS and an easy to grasp metric for brain health.

Keywords: biomarkers; brain age; cognition; machine learning; magnetic resonance imaging; multiple sclerosis.


Conflict of interest statement

Stijn Denissen is an industrial PhD candidate in collaboration with icometrix. Diana Maria Sima and Lars Costers are employed at icometrix. Guy Nagels is on a 10% secondment from the UZ Brussel to icometrix as medical director and is a minority shareholder of icometrix.

Figures

FIGURE 1
FIGURE 1
Brain age pipeline. The pipeline is subdivided into (a) a training phase and (b) a testing phase, where ‘Train Data’ refers to the HC_train data and ‘Test Data’ represents either the HC_test dataset or the MS_test dataset. A silo‐like shape represents a dataset, whereas green diamonds represent some kind of operation, specified by the text. Other text represents either variables or images [Color figure can be viewed at wileyonlinelibrary.com]
FIGURE 2
FIGURE 2
Group comparison between HC_test (blue) and MS_test (orange) for brain age, BPAD and chronological age. Left: The raincloud plots show the distribution of brain age, BPAD and chronological age for MS_test and HC_test. A reference line at x = 0 is included as visual aid. Right: The scatterplot shows the relationship between brain age and chronological age for MS_test and HC_test. The dotted line is added as reference, namely where brain age = chronological age [Color figure can be viewed at wileyonlinelibrary.com]
FIGURE 3
FIGURE 3
Scatterplot between brain age and SDMT in the MS_test dataset. The textbox describes the Pearson r statistic, along with the p value [Color figure can be viewed at wileyonlinelibrary.com]
FIGURE 4
FIGURE 4
The relationship between brain age and SDMT, independent of chronological age. Left: Scatterplot between BPAD and SDMT in the MS_test dataset. The textbox describes the Pearson r statistic, along with the p value. Right: Forest plot visualizing the significance of the weights (β n ) in the linear regression equation SDMT=β0+β1BrainAge+β2ChronologicalAge+ε in the MS_test dataset (note that variables were normalized with respect to mean and standard deviation before input in the regression equation). The maximum likelihood estimates of the weights (βn) are represented by the orange squares, along with a 95% confidence interval (horizontal bar). If the latter does not include 0, the contribution of that feature to the model is considered significant. Brain age and chronological age contributed significantly (p = 0.002 and p < 0.001 respectively) [Color figure can be viewed at wileyonlinelibrary.com]
FIGURE 5
FIGURE 5
Scatterplot between the first principal component (PC1) and brain age in the MS_test dataset. The textbox describes the Pearson r statistic, along with the p value [Color figure can be viewed at wileyonlinelibrary.com]

References

    1. Rao SM, Leo GJ, Bernardin L, Unverzagt F. Cognitive dysfunction in multiple sclerosis. I. Frequency, patterns, and prediction. Neurology. 1991;41(5):685‐691. doi:10.1212/wnl.41.5.685 - DOI - PubMed
    1. Macías Islas MÁ, Ciampi E. Assessment and impact of cognitive impairment in multiple sclerosis: an overview. Biomedicines. 2019;7(1):22. doi:10.3390/biomedicines7010022 - DOI - PMC - PubMed
    1. Amato MP, Prestipino E, Bellinvia A, et al. Cognitive impairment in multiple sclerosis: an exploratory analysis of environmental and lifestyle risk factors. PLoS One. 2019;14(10):e0222929. doi:10.1371/JOURNAL.PONE.0222929 - DOI - PMC - PubMed
    1. Brochet B, Ruet A. Cognitive impairment in multiple sclerosis with regards to disease duration and clinical phenotypes. Front Neurol. 2019;10:261. doi:10.3389/FNEUR.2019.00261/BIBTEX - DOI - PMC - PubMed
    1. Filippi M, Rocca MA, Benedict RHB, et al. The contribution of MRI in assessing cognitive impairment in multiple sclerosis. Neurology. 2010;75(23):2121‐2128. doi:10.1212/WNL.0B013E318200D768 - DOI - PMC - PubMed

Publication types