. 2022 Sep 1;140(9):1020-1037.
doi: 10.1182/blood.2021014552.

Liver-to-lung microembolic NETs promote gasdermin D-dependent inflammatory lung injury in sickle cell disease

Affiliations

Liver-to-lung microembolic NETs promote gasdermin D-dependent inflammatory lung injury in sickle cell disease

Ravi Vats et al. Blood. .

Abstract

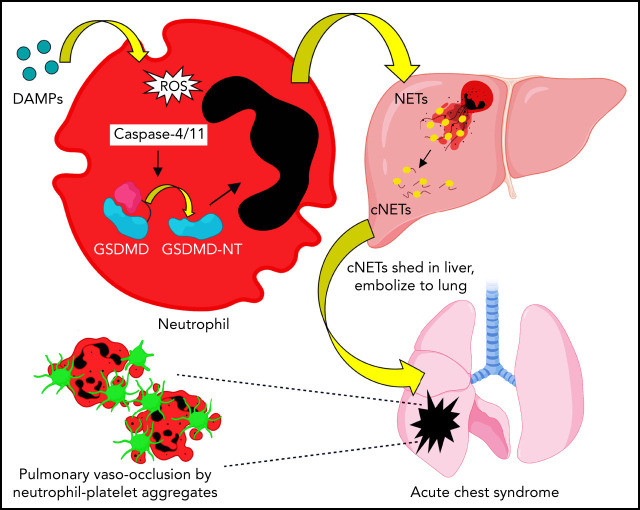
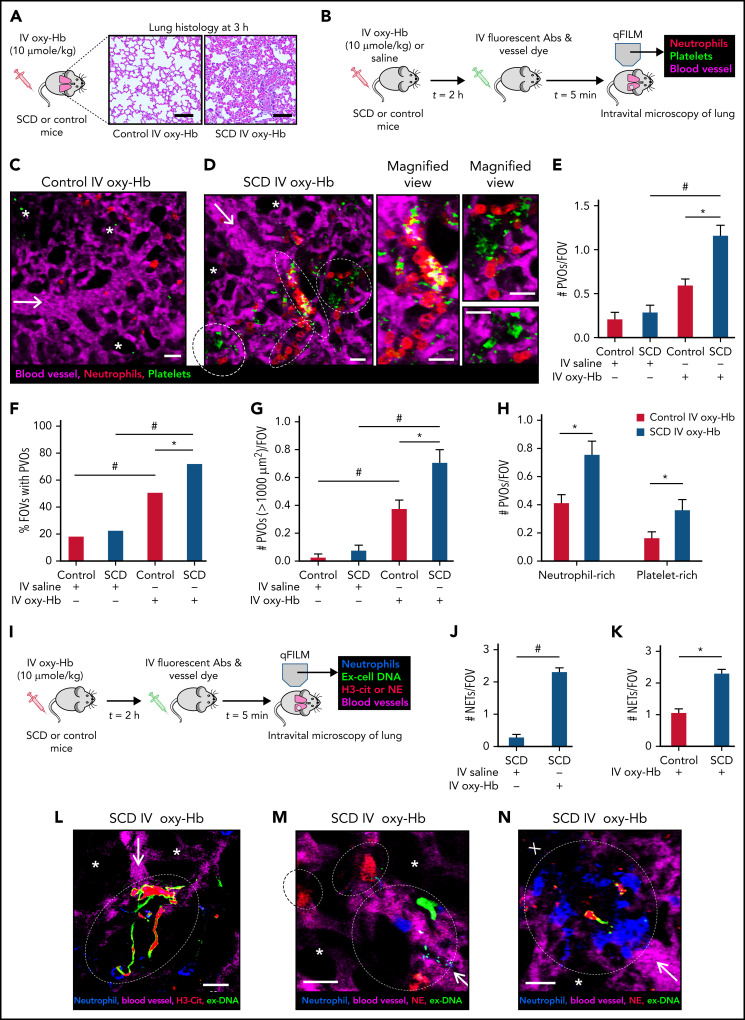
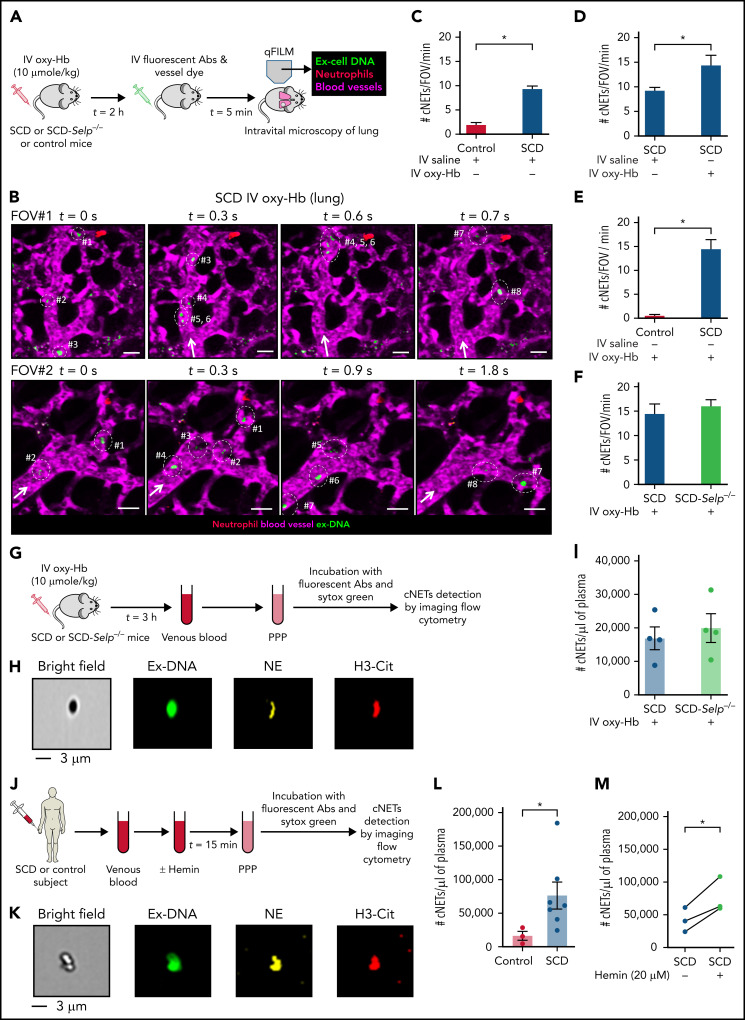
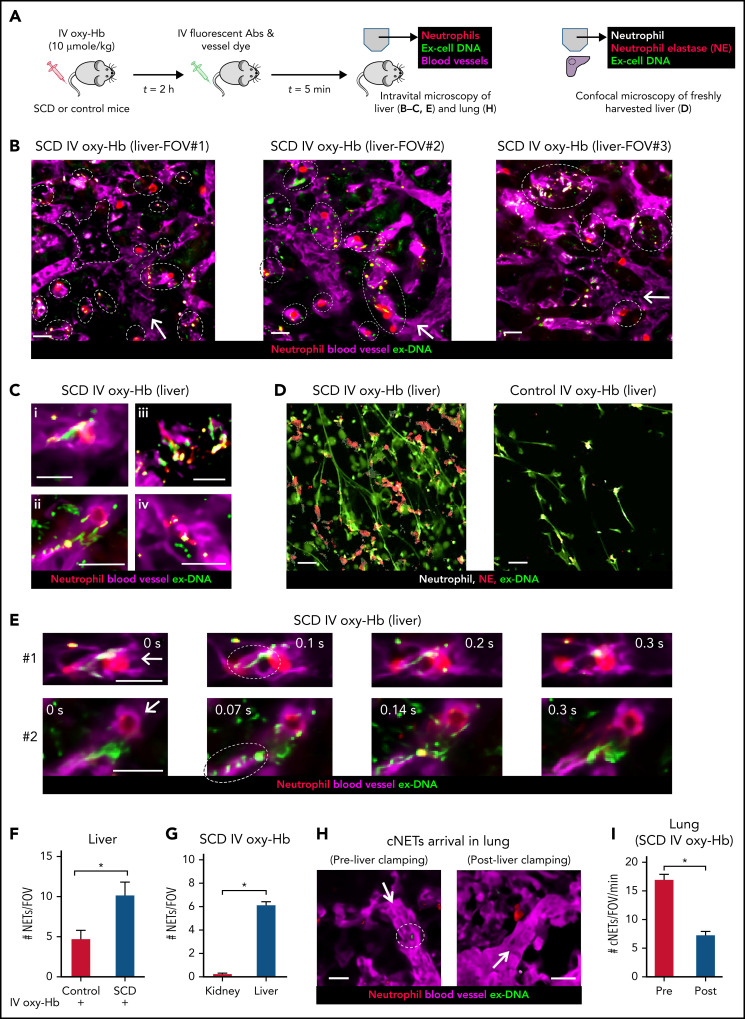
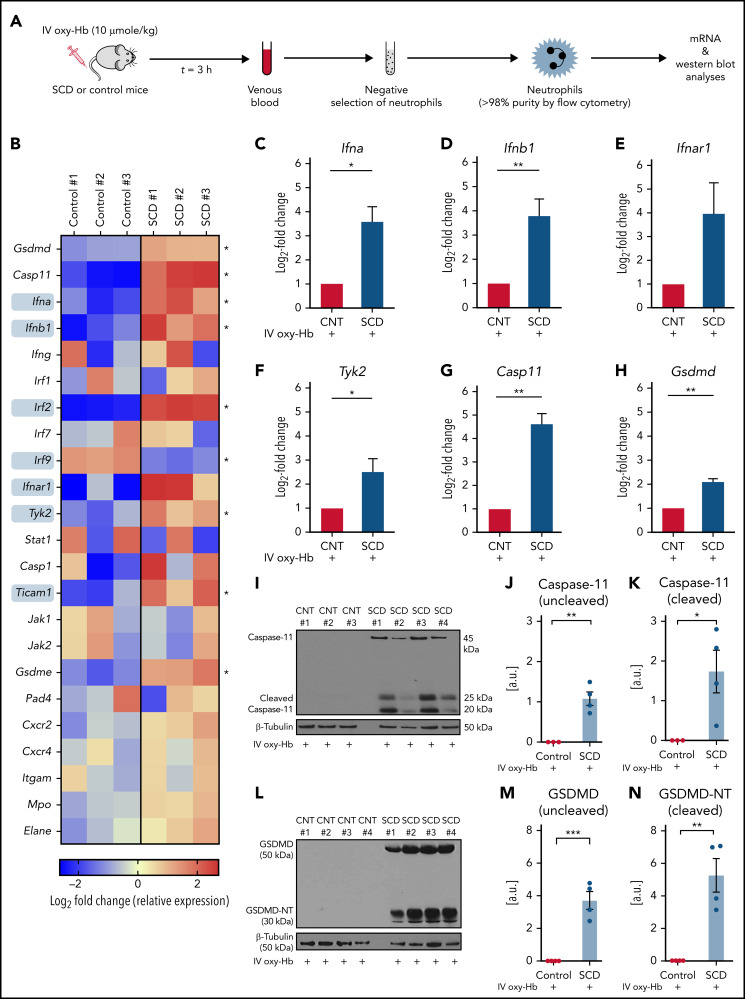
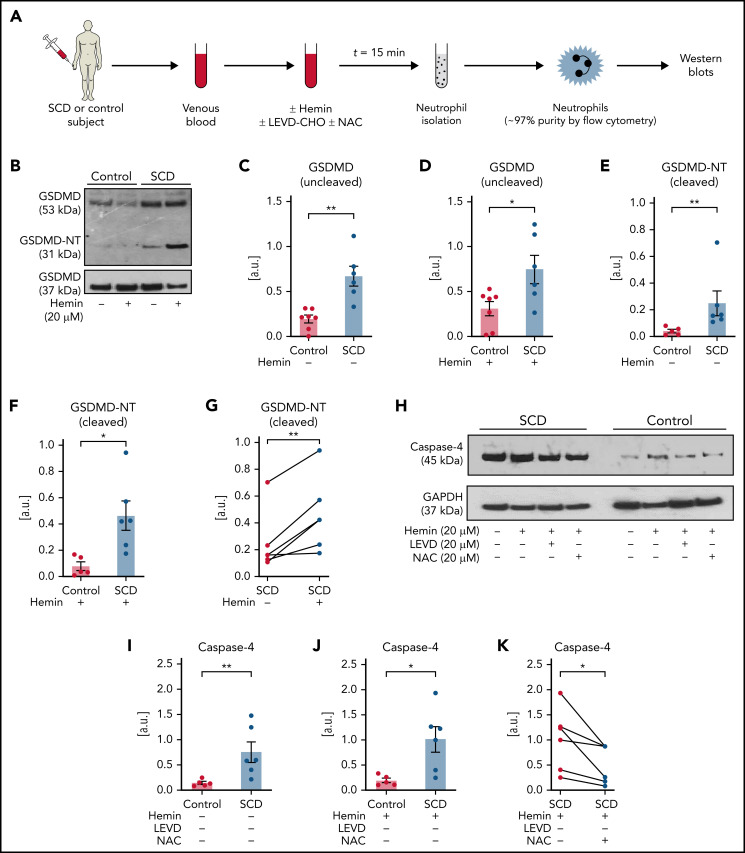
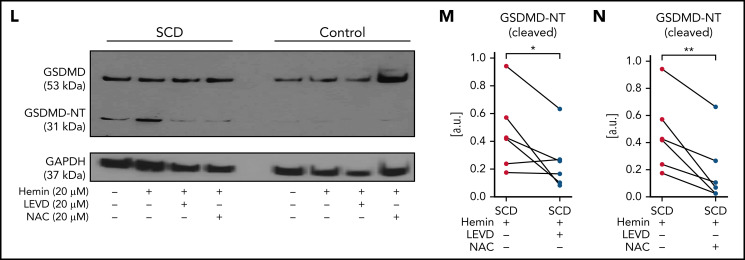
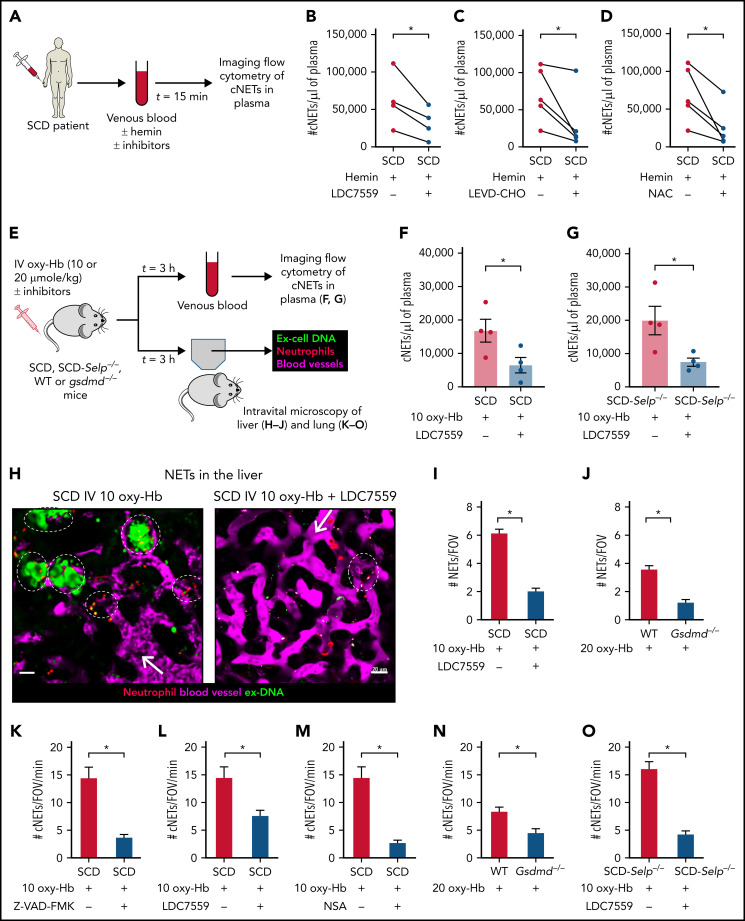
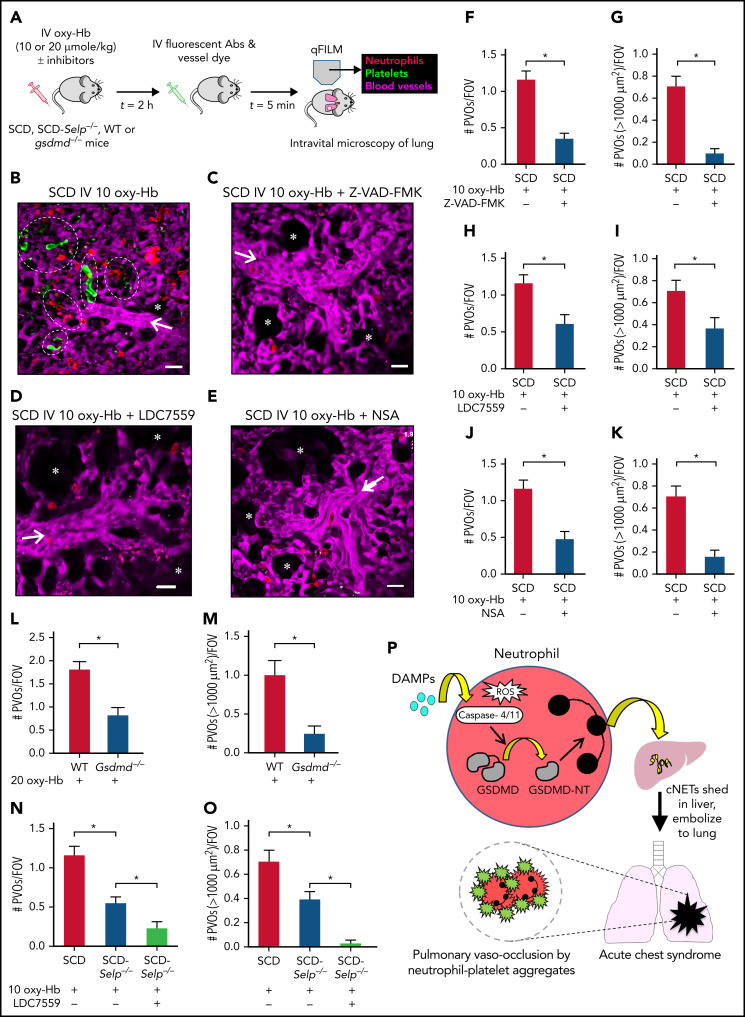
Acute lung injury, referred to as the acute chest syndrome, is a major cause of morbidity and mortality in patients with sickle cell disease (SCD), which often occurs in the setting of a vaso-occlusive painful crisis. P-selectin antibody therapy reduces hospitalization of patients with SCD by ∼50%, suggesting that an unknown P-selectin-independent mechanism promotes remaining vaso-occlusive events. In patients with SCD, intraerythrocytic polymerization of mutant hemoglobin promotes ischemia-reperfusion injury and hemolysis, which leads to the development of sterile inflammation. Using intravital microscopy in transgenic, humanized mice with SCD and in vitro studies with blood from patients with SCD, we reveal for the first time that the sterile inflammatory milieu in SCD promotes caspase-4/11-dependent activation of neutrophil-gasdermin D (GSDMD), which triggers P-selectin-independent shedding of neutrophil extracellular traps (NETs) in the liver. Remarkably, these NETs travel intravascularly from liver to lung, where they promote neutrophil-platelet aggregation and the development of acute lung injury. This study introduces a novel paradigm that liver-to-lung embolic translocation of NETs promotes pulmonary vascular vaso-occlusion and identifies a new GSDMD-mediated, P-selectin-independent mechanism of lung injury in SCD.


Figures

None
Graphical abstract
Figure 1.
Figure 1.
NETs promote lung vaso-occlusion in mice with SCD in vivo. (A) Lung histology (Hematoxylin and Eosin staining; 10× magnification) of control mice and mice with SCD, 3 hours after IV administration of 10 µmol/kg oxy-Hb. Refer to supplemental Figure 1 for larger FOVs and lung injury quantification. (B) Experimental scheme used in panels C to H: Control mice and mice with SCD were IV administered 10 µmol/kg oxy-Hb or saline, and qFILM was used to assess the absence or presence of platelet-neutrophil aggregate mediated pulmonary vaso-occlusion (PVO). Pulmonary microcirculation (pseudo-colored purple), neutrophils (red), and platelets (pseudo-colored green) were labeled in vivo by IV administration of fluorescein isothiocyanate (FITC) dextran, AF546-anti-Ly6G Ab, and V450-anti-CD49b Ab, respectively. Representative qFILM images are shown in panels C to D. (C) IV oxy-Hb led to minimal lung vaso-occlusion in a control mouse. (D) IV oxy-Hb led to occlusion of arteriolar bottlenecks in the lung of a mouse with SCD by large neutrophil-platelet aggregates (marked by dotted white ellipse). Magnified cropped images of the individual neutrophil-platelet aggregates are shown on the right. Colocalization of neutrophils (red) with platelet (green) appears yellow. (E-H) PVOs were quantified using strategy described in supplemental Methods. IV oxy-Hb led to significantly more (E) PVOs per FOV, (F) percent FOVs with PVOs, (G) large PVOs (with area >1000 µm2) per FOV, and (H) both neutrophil-rich and platelet-rich PVOs per FOV, in mice with SCD compared with control mice. Control IV saline (n = 3 mice; 38 FOVs), SCD IV saline (n = 4 mice; 49 FOVs), control IV oxy-Hb (n = 5 mice; 71 FOVs), SCD IV oxy-Hb (n = 5 mice; 75 FOVs). (I) Experimental scheme used in panels J to N: Control mice and mice with SCD were IV administered 10 µmol/kg oxy-Hb, and qFILM was used to assess the absence or presence of NETs within the pulmonary microcirculation. Pulmonary microcirculation (pseudo-colored purple), neutrophils (blue), extracellular DNA (green), and citrullinated histones (H3-Cit; red) or NE (red) were labeled in vivo by IV administration of Evans blue, Pacific blue–anti-Ly6G Ab, Sytox green, and AF546–anti-H3-Cit Ab or AF546–anti-NE Ab, respectively. (J-K) NETs were quantified as described in supplemental Methods. Number of NETs per FOV (#NETs/FOV) was significantly higher in mice with SCD administered IV oxy-Hb (n = 4 mice; 44 FOVs) than (J) mice with SCD administered IV saline (n = 4 mice; 49 FOVs) or (K) control mice administered IV oxy-Hb (n = 4 mice; 43 FOVs). Representative qFILM images (L-N) reveal NETs (marked by dotted white ellipse) in the pulmonary arteriole bottlenecks of mice with SCD administered IV Oxy-Hb. NETs were identified based on colocalization of Ly6G (blue) with exDNA (green) and (L) H3-cit (red) or (M,N) NE (red). “X” (in panel N) denotes loss of blood flow (purple dye absent) downstream of NETs-associated lung vaso-occlusion (marked by white ellipse). White arrows denote the direction of blood flow within the pulmonary arterioles. Alveoli are marked with white asterisks. Scale bars, 200 µm, in panel A and 20 µm in panels C-D, L-N. qFILM FOV size ∼65 536 µm2. *P < .05 for SCD compared with control. #P < .05 for IV oxy-Hb compared with IV saline. Means in panels E,G compared using Student t test with Bonferroni correction. Percentages in panel F compared using fourfold table analyses with Bonferroni χ2 statistics. Means in panels H, J-K compared using Student t test. Data in panels E, G, H, J, and K represent mean ± standard error (SE). The diameter of pulmonary arteriole in panels C, D, L, M, and N is ∼28 µm, 26 µm, 14 µm, 14 µm, and 28 µm, respectively.
Figure 2.
Figure 2.
Embolic NETs arrive in the lung from other organs, in a P-selectin–independent manner in SCD. (A) Experimental scheme used in panels B to E: Control, SCD, or SCD-Selp−/− mice were IV administered 10 µmol/kg oxy-Hb or saline, and qFILM was used to assess the absence or presence of cNETs within the pulmonary microcirculation. Pulmonary microcirculation (pseudo-colored purple), neutrophils (pseudo-colored red), and extracellular DNA (pseudo-colored green) were labeled in vivo by IV administration of FITC dextran, Pacific blue–anti-Ly6G Ab and Sytox orange, respectively. (B) Two representative qFILM FOVs (#1 and #2) showing several cNETs (green fragments marked with white circles) entering the lung microcirculation (purple) via the pulmonary arteriole at different time points in mice with SCD administered IV oxy-Hb. FOV#1 (top row): cNETs #1, #2, and #3 entered via the pulmonary arteriole (diameter ∼28 μm) at 0 seconds, cNETs #1, #2 left the FOV and #4, #5, #6 entered the FOV at 0.3 seconds, cNET #3 left the FOV at 0.6 seconds, cNETs #4, #5, #6 left the FOV, and #7, #8 entered the FOV at 0.7 seconds. FOV#2 (bottom row): cNETs #1, #2 entered the FOV via the pulmonary arteriole (diameter ∼24 μm) at 0 seconds, cNETs #3, #4 entered the FOV at 0.3 seconds, cNETs #1, #2, #3, #4 left the FOV and #5, #6, #7 entered the FOV at 0.9 seconds, cNETs #5, #6 left the FOV and #8 entered the FOV at 1.8 seconds. Time points are relative to the first frame shown at t = 0 seconds. Complete time series shown in supplemental Videos 8 and 9. White arrows denote the direction of blood flow within the pulmonary arterioles. Scale bars, 20 µm. (C-F) Number of cNETs entering per FOV over a 1-minute duration (#cNETs/FOV/min) were quantified using strategy described in supplemental Methods. (C) #cNETs/FOV/min were significantly more numerous in mice with SCD than control mice administered IV saline. #cNETs/FOV/min were significantly more numerous in mice with SCD administered IV oxy-Hb than (D) mice with SCD administered IV saline or (E) control mice administered IV oxy-Hb, but not different from (F) SCD-Selp−/− mice administered IV oxy-Hb. Control IV saline (n = 3 mice; 28 FOVs), SCD IV saline (n = 4 mice; 51 FOVs), SCD IV oxy-Hb (n = 4 mice; 44 FOVs), control IV Oxy-Hb (n = 4 mice, 43 FOVs), SCD-Selp−/− IV oxy-Hb (n = 5 mice; 71 FOVs). qFILM FOV size∼65 536 µm2. (G) Experimental scheme used in panels H to I: SCD or SCD-Selp−/− mice were IV administered 10 µmol/kg oxy-Hb; venous blood was processed to generate platelet poor plasma (PPP). PPP was incubated with Sytox green and fluorescent Abs against NE and citrullinated-histones (H3-Cit), and used for detection of cNETs by imaging flow cytometry as described in supplemental Methods. (H) A representative imaging flow cytometry image of a cNET in the blood of mice with SCD administered IV oxy-Hb. cNETs were identified as particles (<3 μm) triple-positive for NETs markers–extracellular DNA (green), NE (pseudo-colored yellow), and H3-Cit (pseudo-colored red). Scale bar, 3 µm. (I) Imaging flow cytometry data were quantified as described in supplemental Methods to estimate concentration of cNETs (#cNETs/μL of plasma). Plasma concentration of cNETs was not different between SCD and SCD-Selp−/− mice (n = 4 mice per group) administered IV oxy-Hb. (J) Experimental scheme used in panels K to M: control or SCD human blood with or without incubation with 20 μM hemin processed to generate PPP and cNETs detected using Imaging Flow Cytometry as in panel G. (K) A representative imaging flow cytometry image of a cNET in a patient’s blood with SCD. Scale bar, 3 µm. (L) The concentration of cNETs was significantly higher in untreated SCD (n = 7) than control (n = 3) human subjects’ blood. (M) Incubation with hemin significantly increased cNETs concentration in patients’ blood with SCD (n = 3). Straight line connects cNETs concentrations in the same patient’s blood with SCD pre- (blue circle) and post- (green circle) hemin treatment. Data in panels C-E, F, I, L represent mean ± SE and compared using Student t test. Data in panel M were compared using a paired Student t test. *P < .05.
Figure 3.
Figure 3.
NETs are shed in the liver and then embolize to the lung as cNETs in SCD. (A) Experimental scheme: control mice or mice with SCD were IV administered 10 µmol/kg oxy-Hb or saline. Intravital fluorescence microscopy was used to assess the absence or presence of NETs within the liver (B,C,E) and lung (H) microcirculation. Microcirculation (pseudo-colored purple), neutrophils (pseudo-colored red), and extracellular DNA (pseudo-colored green) were labeled in vivo by IV administration of FITC or Texas-red dextran, Pacific blue–anti-Ly6G Ab and Sytox orange or green, respectively. Alternatively (D), freshly cut-unfixed slices of excised liver were stained in vitro for neutrophils (Pacific blue–anti-Ly6G Ab), extracellular DNA (Sytox green), and NE (AF546–anti-NE Ab), and confocal microscopy was used to identify NETs based on colocalization of DNA (green) with neutrophils (pseudo-colored white) and NE (red). Refer to supplemental methods for details. (B) Three representative liver intravital microscopy images (FOVs #1, #2, and #3) and the corresponding videos (supplemental Videos 11-13) reveal numerous NETs (marked with white dotted ellipses) and areas with impaired blood flow evident by slow transit of erythrocytes (dark cells) in the liver microcirculation of mice with SCD administered IV oxy-Hb. NETs were identified based on colocalization of neutrophil (red) and extracellular DNA (green). A vaso-occlusion evident by lack of vascular dye (purple) is marked with white dotted polygon in FOV#1. (C) Magnified intravital images of 4 different NETs in the liver microcirculation of mice with SCD administered IV Oxy-Hb. (D) Representative confocal micrographs reveal abundance of NETs (neutrophil-associated DNA strands positive for NE) in the liver of an SCD but rare in the liver of a control mouse administered IV Oxy-Hb. Neutrophils (pseudo-colored white), NE (red), and extracellular DNA (green). Colocalization of red and white appears pink. Individual channels shown in supplemental Figure 9. (E) Two separate time series of liver intravital images (#1, top row, and #2, bottom row) showing shedding of NETs in the liver microcirculation of mice with SCD administered IV oxy-Hb. (#1) A fragment of ex-DNA (green; marked with dotted ellipse) starts to detach from the neutrophil (red) at t = 0.1 seconds and disappears into the microcirculation (purple) by t = 0.3 seconds. (#2) Several fragments of ex-DNA (green; marked with dotted ellipse) detach from the neutrophil (red) at t = 0.07 seconds and disappear into the microcirculation (purple) by t = 0.3 seconds. Time points are relative to the first frame shown at t = 0 seconds. Complete times series #1 and #2 shown in supplemental Videos 14 and , respectively. (F) Confocal micrographs (representative example shown in panel D) were quantified to reveal significantly more #NETs/FOV in the liver of SCD than control mice administered IV oxy-Hb. n = 6 FOVs in each group. FOV size ∼144 400 µm2. (G) Liver and kidney intravital microscopy images were quantified to estimate number of NETs per FOV (#NETs/FOV). #NETs/FOV was significantly higher in the liver than kidney of mice with SCD administered IV Oxy-Hb. SCD IV Oxy-Hb kidney (n = 3 mice; 35 FOVs), SCD IV Oxy-Hb liver (n = 4 mice; 44 FOVs). (H-I) Intravital lung microcopy was used to assess the effect of simultaneously ligating the hepatic artery and portal vein (liver clamping), on the arrival of cNETs in the lung microcirculation of mice with SCD administered IV oxy-Hb. In qFILM FOVs from same mouse (panel H and supplemental Video 18), cNETs (green; marked with dotted white circle) are seen entering the pulmonary arteriole pre- but not postclamping of liver blood flow. More FOVs are shown in supplemental Figure 13; supplemental Videos 25 and . (I) Number of cNETs arriving in the lung per FOV over a 1-minute duration (#cNETs/FOV/min) were significantly reduced (threefold) following clamping of liver blood flow in mice with SCD administered IV oxy-Hb (n = 5 mice; 45 FOVs preclamp; 33 FOVs postclamp). Intravital microscopy FOV size ∼65 536 µm2. Scale bars, 20 µm. Data in panels F, G, and I represent mean ± SE and were compared using Student t test. *P < .05. Arrow denotes the direction of blood flow.
Figure 4.
Figure 4.
IFN-I signaling, caspase-11, and GSDMD are activated in neutrophils of mice with SCD. (A) Experimental scheme: control or mice with SCD were IV administered 10 µmol/kg oxy-Hb; venous blood was collected 3 hours later, and neutrophils were isolated from blood using a negative selection approach. Purity was confirmed (>98%) using flow cytometry, and neutrophils were used in messenger RNA (B-H) or western blot analysis (I-N). Refer to supplemental methods for details. (B) Heat map showing relative gene expression of the type I IFN-I pathway components, IFN-stimulated genes (ISGs) and NETs-related genes in SCD or control mice neutrophils. ISGs marked by grey squares are significantly altered between SCD and control mice. The data are presented as Log2-Fold change (relative expression) for 3 control and 3 mice with SCD. Each column reflects a single mouse. Significantly altered genes marked by asterisk in B. Log2-fold changes (relative expression) in panels (C) Ifna (IFN-α), (D) Ifnb1 (IFN-β), (E) Ifnar1 (IFN-α receptor 1 subunit), (F) Tyk2 (tyrosine kinase 2), (G) Casp11 (caspase-11), and (H) Gsdmd (GSDMD) genes were higher by several-fold in neutrophils of mice with SCD (n = 3) compared with control mice (n = 3) IV administered oxy-Hb. (I) Representative western blot micrograph showing presence of both uncleaved (45 kDa) and cleaved (20 and 25 kDa) caspase-11 in neutrophils of mice with SCD IV administered oxy-Hb. The expressions of both cleaved and uncleaved caspase-11 were below the detection limit in neutrophils of control mice IV administered oxy-Hb. (J-K) Densitometric analyses of western blot micrographs revealed significantly higher (J) uncleaved and (K) cleaved caspase-11 in neutrophils of SCD (n = 4) mice than control (n = 3) mice administered IV oxy-Hb. (L) Representative western blot micrograph showing presence of both uncleaved GSDMD (50 kDa) and cleaved GSDMD-NT (30 kDa) in neutrophils of mice with SCD IV administered oxy-Hb. The expressions of both GSDMD and GSDMD-NT were below the detection limit in neutrophils of control mice IV administered oxy-Hb. (M-N) Densitometric analyses of western blot micrographs revealed significantly higher (M) uncleaved GSDMD and (N) cleaved GSDMD-NT in neutrophils of SCD (n = 4) mice than control (n = 4) mice administered IV oxy-Hb. Data represent mean ± SE. *P < .05; **P < .01. Means compared using the Student t test. β-Tubulin (50 kDa) was the loading control protein. Uncropped images of western blot micrographs I and L shown in supplemental Figure 15A-B, respectively.
Figure 5.
Figure 5.
Inflammatory milieu in SCD promotes caspase-4–dependent activation of neutrophil-GSDMD. (A) Experimental scheme: control or SCD human blood with or without preincubation (15 minutes) with 20 μM hemin or 20 μM hemin + 20 μM caspase-4 inhibitor (LEVD-CHO) or 20 μM hemin + 20 μM antioxidant NAC was used for neutrophil isolation. Neutrophil purity was confirmed (∼97%) using flow cytometry, and neutrophils were used in western blot analysis. Refer to supplemental methods for details. (B) Representative western blot micrograph shows both uncleaved GSDMD (53 kDa) and the cleaved GSDMD-NT (31 kDa) present in patient neutrophils with SCD but only uncleaved GSDMD present in control human neutrophils. (C-G) Densitometric analyses of western blot micrographs (representative example shown in panel B) revealed significantly higher (C) GSDMD in neutrophils isolated from untreated SCD than control human blood, (D) GSDMD in neutrophils isolated from hemin treated SCD than control human blood, (E) GSDMD-NT in neutrophils isolated from untreated SCD than control human blood, (F) GSDMD-NT in neutrophils isolated from hemin treated SCD than control human blood, and (G) GSDMD-NT in neutrophils isolated from hemin-treated than untreated blood of same patients with SCD. Data representative of 7 control and 6 SCD human subjects (C, D), 5 control and 6 SCD human subjects (E, F), and 6 SCD human subjects (G). (H) Representative western blot micrograph and (I-K) densitometric analyses show significantly higher levels of caspase-4 (45 kDa) in neutrophils isolated from (I) untreated SCD than control human blood, (J) hemin-treated SCD than control human blood, and (K) hemin-treated than hemin + NAC-treated blood of same patients with SCD. Data representative of 5 control and 6 SCD human subjects (I-J) and 6 SCD human subjects (K). (L) Representative western blot micrograph and (M-N) densitometric analyses show significantly higher GSDMD-NT (31 kDa) in neutrophils isolated from (M) hemin-treated than hemin + LEVD-CHO–treated blood of same patients with SCD and (N) hemin-treated than hemin + NAC–treated blood of same patients with SCD. Data in panels M-N representative of 6 SCD human subjects. Pre- and posttreatment data point of each SCD human subject connected by a straight line in panels G, K, M, and N. Each data point in panels C-F and I-J represents a separate human subject. Mean ± SE shown in panels C-F and I-J compared using Student t test. Data in panels G, K, and M-N compared using paired Student t test. *P < .05; **P < .01. glyceraldehyde-3-phosphate dehydrogenase (GAPDH; 37 kDa) was used as the loading control. Uncropped images of western blot micrographs panels B, H, and L shown in supplemental Figures 18-20, respectively.
Figure 5.
Figure 5.
Inflammatory milieu in SCD promotes caspase-4–dependent activation of neutrophil-GSDMD. (A) Experimental scheme: control or SCD human blood with or without preincubation (15 minutes) with 20 μM hemin or 20 μM hemin + 20 μM caspase-4 inhibitor (LEVD-CHO) or 20 μM hemin + 20 μM antioxidant NAC was used for neutrophil isolation. Neutrophil purity was confirmed (∼97%) using flow cytometry, and neutrophils were used in western blot analysis. Refer to supplemental methods for details. (B) Representative western blot micrograph shows both uncleaved GSDMD (53 kDa) and the cleaved GSDMD-NT (31 kDa) present in patient neutrophils with SCD but only uncleaved GSDMD present in control human neutrophils. (C-G) Densitometric analyses of western blot micrographs (representative example shown in panel B) revealed significantly higher (C) GSDMD in neutrophils isolated from untreated SCD than control human blood, (D) GSDMD in neutrophils isolated from hemin treated SCD than control human blood, (E) GSDMD-NT in neutrophils isolated from untreated SCD than control human blood, (F) GSDMD-NT in neutrophils isolated from hemin treated SCD than control human blood, and (G) GSDMD-NT in neutrophils isolated from hemin-treated than untreated blood of same patients with SCD. Data representative of 7 control and 6 SCD human subjects (C, D), 5 control and 6 SCD human subjects (E, F), and 6 SCD human subjects (G). (H) Representative western blot micrograph and (I-K) densitometric analyses show significantly higher levels of caspase-4 (45 kDa) in neutrophils isolated from (I) untreated SCD than control human blood, (J) hemin-treated SCD than control human blood, and (K) hemin-treated than hemin + NAC-treated blood of same patients with SCD. Data representative of 5 control and 6 SCD human subjects (I-J) and 6 SCD human subjects (K). (L) Representative western blot micrograph and (M-N) densitometric analyses show significantly higher GSDMD-NT (31 kDa) in neutrophils isolated from (M) hemin-treated than hemin + LEVD-CHO–treated blood of same patients with SCD and (N) hemin-treated than hemin + NAC–treated blood of same patients with SCD. Data in panels M-N representative of 6 SCD human subjects. Pre- and posttreatment data point of each SCD human subject connected by a straight line in panels G, K, M, and N. Each data point in panels C-F and I-J represents a separate human subject. Mean ± SE shown in panels C-F and I-J compared using Student t test. Data in panels G, K, and M-N compared using paired Student t test. *P < .05; **P < .01. glyceraldehyde-3-phosphate dehydrogenase (GAPDH; 37 kDa) was used as the loading control. Uncropped images of western blot micrographs panels B, H, and L shown in supplemental Figures 18-20, respectively.
Figure 6.
Figure 6.
Neutrophil-GSDMD promotes liver-to-lung embolization of cNETs in SCD. (A) Experimental scheme used in panels B-D: SCD patient blood preincubated with 20 μM hemin with or without GSDMD inhibitor (LDC7559) or caspase-4 inhibitor (LEVD-CHO) or NAC, processed to generate PPP, PPP incubated with Sytox green and fluorescent Abs against NE and citrullinated histones (H3-Cit), and cNETs detected in PPP by imaging flow cytometry as described in Figure 2. Concentration of cNETs (#cNETs/μL of plasma) was significantly reduced in hemin-treated SCD patient blood following incubation with (B) 20 µM LDC7559 (n = 4 patients), (C) 20 µM LEVD-CHO (n = 5 patients), and (D) 20 µM NAC (n = 5 patients). Straight line connects cNETs concentrations in the same SCD patient blood pre- (red circle) and post- (blue circle) inhibitor treatment. (E) Experimental scheme used in panels F to O: SCD or SCD-Selp−/− mice and WT or Gsdmd−/− mice were IV administered 10 µmol/kg oxy-Hb (10 oxy-Hb) and 20 µmol/kg oxy-Hb (20 oxy-Hb), respectively, without or with 10 mg/kg GSDMD inhibitor (LDC7559) or 0.004 µmol/kg pan-caspase inhibitor (Z-VAD-FMK) or 20 mg/kg GSDMD inhibitor necrosulfonamide (NSA) or 10 mg/kg GSDMD inhibitor (disulfiram). In panels F-G, venous blood was processed to generate PPP and cNETs detected in PPP using imaging flow cytometry as in panel A. In panels H to O, microcirculation, neutrophils, and extracellular DNA were labeled in vivo by IV administration of FITC or Texas-red dextran, Pacific blue–anti-Ly6G Ab, and Sytox orange or green, respectively, and intravital fluorescence microscopy was used to assess the absence or presence of NETs within the liver (H-J) and lung (K-O) microcirculation. (F) Plasma concentration of cNETs was significantly less in mice with SCD IV administered 10 oxy-Hb + LDC7559 (n = 4 mice) than 10 oxy-Hb alone (n = 4 mice). (G) Plasma concentration of cNETs was significantly less in SCD-Selp−/− mice IV administered 10 oxy-Hb + LDC7559 (n = 4 mice) than 10 oxy-Hb alone (n = 4 mice). (H) Left, representative liver intravital microscopy image and supplemental Video 19 reveal numerous large NETs (marked with white ellipses) and areas with impaired blood flow evident by slow transit of erythrocytes (dark cells) in the liver microcirculation of a mouse with SCD administered IV 10 oxy-Hb. Right, representative liver intravital microscopy image and supplemental Video 20 reveal only a single small NET (marked with white ellipse) and significantly improved blood flow evident by rapidly transiting neutrophils (red) and erythrocytes (dark cells) in the liver microcirculation of a mouse with SCD administered IV 10 oxy-Hb + 10 mg/kg LDC7559. NETs were identified based on colocalization of neutrophil (pseudo-colored red) and extracellular DNA (green) in microcirculation (pseudo-colored purple). Scale bars, 20 µm. Arrow denotes the direction of blood flow. Liver intravital microscopy images were analyzed as in Figure 3 to estimate number of NETs per FOV (#NETs/FOV). (I) #NETs/FOV were significantly less (threefold) in the liver microcirculation of mice with SCD administered IV 10 oxy-Hb + LDC7559 (n = 4 mice; 42 FOVs) than 10 oxy-Hb alone (n = 4 mice; 44 FOVs). (J) #NETs/FOV were significantly less (fourfold) in the liver microcirculation of Gsdmd−/− (n = 4 mice; 35 FOVs) than littermate WT mice (n = 4 mice; 38 FOVs) administered IV 20 oxy-Hb. (K-O) Lung intravital microscopy images were analyzed as in Figure 2 to estimate number of cNETs entering per FOV in the lung over a 1-minute duration (#cNETs/FOV/min). #cNETs/FOV/min in the lung were significantly less in mice with SCD IV administered (K) 10 oxy-Hb + 0.004 µmol/kg Z-VAD-FMK (n = 4 mice; 51 FOVs), (L) 10 oxy-Hb + 10 mg/kg LDC7559 (n = 4 mice; 41 FOVs), and (M) 10 oxy-Hb + 20 mg/kg NSA (n = 3 mice; 38 FOVs) than 10 oxy-Hb alone (n = 4 mice; 44 FOVs). (N) #cNETs/FOV/min in the lung were significantly less in Gsdmd−/− (n = 3 mice; 29 FOVs) than littermate WT mice (n = 3 mice; 33 FOVs) IV administered 20 oxy-Hb. (O) #cNETs/FOV/min in the lung were significantly less (fourfold) in SCD-Selp−/− mice IV administered 10 oxy-Hb + LDC7559 (n = 3 mice; 35 FOVs) than 10 oxy-Hb alone (n = 5 mice; 71 FOVs). A similar effect of disulfiram on #cNETs/FOV/min in the lung of SCD-Selp−/− mice shown in supplemental Figure 22. Data in panels B to D compared using a paired Student t test. Data in panels F, G, and I to O represent mean ± SE and compared using Student t test. *P < .05. FOV size ∼65 536 µm2.
Figure 7.
Figure 7.
Inhibiting the GSDMD pathway ameliorates P-selectin–independent lung vaso-occlusion in SCD. (A) Experimental scheme: SCD or SCD-Selp−/− mice and WT or Gsdmd−/− mice were IV administered 10 µmol/kg oxy-Hb (10 oxy-Hb) and 20 µmol/kg oxy-Hb (20 oxy-Hb), respectively, without or with 10 mg/kg GSDMD inhibitor (LDC7559) or 0.004 µmol/kg pan-caspase inhibitor (Z-VAD-FMK) or 20 mg/kg GSDMD inhibitor NSA or 10 mg/kg GSDMD inhibitor (disulfiram). qFILM was used to assess the absence or presence of platelet-neutrophil aggregate-mediated PVO. Pulmonary microcirculation (pseudo-colored purple), neutrophils (red), and platelets (pseudo-colored green) were labeled in vivo by IV administration of FITC dextran, AF546–anti-Ly6G Ab and V450–anti-CD49b Ab, respectively. Representative qFILM images are shown in panels B to E. (B) Representative qFILM image and supplemental Video 21 reveal 5 neutrophil-platelet aggregates (marked with dotted white ellipses) occluding pulmonary arteriole-bottleneck in the lung of a mouse with SCD IV administered 10 µmol/kg oxy-Hb (10 oxy-Hb). Representative qFILM images and corresponding videos reveal absence of lung vaso-occlusion and significantly improved blood flow (evident by rapidly transiting erythrocytes [dark cells]) in the lung of a mouse with SCD IV administered 10 oxy-Hb + Z-VAD-FMK (C; supplemental Video 22), 10 oxy-Hb + LDC7559 (D; supplemental Video 23), and 10 oxy-Hb + NSA (E; supplemental Video 24). White arrows denote the direction of blood flow within the pulmonary arterioles. Alveoli are marked with asterisks. Scale bars, 20 µm. The diameter of pulmonary arteriole in panels B to E is ∼22 µm, 32 µm, 31.5 µm, and 31 µm, respectively. (F-K) PVOs were compared between treatment groups using following 2 parameters: #PVOs/FOV and number of large PVOs (with area >1000 µm2) per FOV. Both #PVOs/FOV and #PVOs (with area >1000 µm2) per FOV were significantly less in mice with SCD IV administered (F,G) 10 oxy-Hb + Z-VAD-FMK (n = 4 mice; 51 FOVs) or (H,I) 10 oxy-Hb + LDC7559 (n = 4 mice; 41 FOVs) or (J,K) 10 oxy-Hb + NSA (n = 3 mice; 38 FOVs) than mice with SCD IV administered 10 oxy-Hb alone (n = 5 mice; 75 FOVs). Both (L) #PVOs/FOV and (M) #PVOs (with area >1000 µm2) per FOV were significantly less in Gsdmd−/− (n = 3 mice; 28 FOVs) than littermate WT mice (n = 3 mice; 31 FOVs) IV administered 20 oxy-Hb. (N) #PVOs/FOV were significantly reduced and (O) #PVOs (with area >1000 µm2) per FOV were absent in SCD-Selp−/− mice IV administered 10 oxy-Hb + LDC7559 (n = 3 mice; 35 FOVs) compared with SCD-Selp−/− mice IV administered 10 oxy-Hb alone (n = 5 mice; 69 FOVs). A similar effect of disulfiram on PVOs in SCD-Selp−/− mice shown in supplemental Figure 25. The data for mice with SCD IV administered 10 oxy-Hb (n = 5 mice; 75 FOVs) are included in panels N and O for relative comparison. qFILM FOV size ∼65 536 µm2. Data represent mean ± SE and are compared using Student t test. *P < .05. (P) Schematic showing the main findings of the study. The sterile inflammatory milieu (DAMPs, IFN-I signaling, and ROS) in SCD promotes caspase-4 (humans) or caspase-11 (mouse)-dependent cleavage of neutrophil GSDMD into the active form GSDMD-NT, leading to the shedding of NETs in the liver microcirculation. Once shed, these NETs are carried by the blood as cNETs to the lung, where they promote neutrophil-platelet aggregation in the pulmonary arterioles, leading to pulmonary vaso-occlusion and lung injury (acute chest syndrome).

Comment in

References

    1. Rees DC, Williams TN, Gladwin MT. Sickle-cell disease. Lancet. 2010;376(9757):2018-2031. - PubMed
    1. Abubakar II, Tillmann T, Banerjee A; GBD 2013 Mortality and Causes of Death Collaborators . Global, regional, and national age-sex specific all-cause and cause-specific mortality for 240 causes of death, 1990-2013: a systematic analysis for the Global Burden of Disease Study 2013. Lancet. 2015;385(9963):117-171. - PMC - PubMed
    1. Kato GJ, Piel FB, Reid CD, et al. . Sickle cell disease. Nat Rev Dis Primers. 2018;4(1):18010. - PubMed
    1. Sundd P, Ofori-Acquah SF. Sterile inflammation in sickle cell disease. In: Gladwin MT, Novelli EM, Kato GJ, eds. Sickle Cell Disease. New York, NY: McGraw-Hill; 2021:93-108.
    1. Sundd P, Gladwin MT, Novelli EM. Pathophysiology of sickle cell disease. Annu Rev Pathol. 2019;14(1):263-292. - PMC - PubMed