Comparative Study
. 2022 Aug 18;107(9):e3714-e3722.
doi: 10.1210/clinem/dgac370.

Comparison of 3 Different AMH Assays With AMH Levels and Follicle Count in Women With Polycystic Ovary Syndrome

Affiliations
Comparative Study

Comparison of 3 Different AMH Assays With AMH Levels and Follicle Count in Women With Polycystic Ovary Syndrome

Loes M E Moolhuijsen et al. J Clin Endocrinol Metab. .

Abstract

Context: Anti-Müllerian hormone (AMH) levels strongly correlate with the number of antral follicles (total follicle count, TFC) in the ovary. In women with polycystic ovary syndrome (PCOS), this is reflected by significantly increased serum AMH levels. Different assays have been developed to measure AMH. However, little is known about the interassay correlation in women with increased AMH levels.

Objective: To investigate the correlation of AMH values between different AMH assays and with TFC in PCOS patients.

Methods: AMH levels were measured in 1660 PCOS patients, using 3 different AMH assays: Gen II (Beckman Coulter); picoAMH (Ansh Labs); and Elecsys (Roche). Passing Bablok regression was used to compare assay methods. Spearman's correlation was used to correlate AMH levels and TFC.

Results: Strong interassay correlations were present over the total range of AMH levels (0.81-0.94). Stratification in subgroups, revealed an AMH level-dependent interassay correlation with strong interassay correlations in the low (<2.80 ng/mL) and high (>7.04 ng/mL) subgroups (0.62-0.86). However, the correlation in the mid-AMH subgroup (2.80-7.04 ng/mL) was only moderate (0.28-0.56). A strong correlation was present between the total range of AMH levels and TFC (0.57-0.62). However, in all 3 AMH subgroups the correlation became moderate at best, independently of assay method (0.11-0.45).

Conclusion: In conclusion, both the interassay correlation and the correlation between AMH level and follicle count depend on the range of serum AMH levels. This once more emphasizes the need of a standardization of AMH measurement for an accurate interpretation of AMH in clinical practice.

Keywords: AMH; PCOS; assay; follicle count.


Figures

Figure 1.
Figure 1.
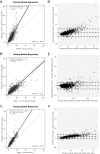
Passing–Bablok regression and Bland–Altman graphs. (A-C) Regression curves comparing AMH levels measured by the Gen II AMH ELISA (Beckman Coulter), Elecsys AMH plus assay (Roche), and picoAMH assay (Ansh Labs). Solid black lines are the regression curve with the 95% CI in grey relative to a slope of 1 (dotted black lines). (D-F) Bland–Altman graphs with a mean difference and 95% CI (dotted lines).
Figure 2.
Figure 2.
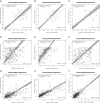
Passing–Bablok regression curves of the pair-wise comparison between assay-specific AMH methods across AMH subgroups. Regression curves comparing AMH levels measured by the Gen II AMH ELISA (Beckman Coulter), Elecsys AMH plus assay (Roche), and picoAMH assay (Ansh Labs). Solid black lines are the regression curve with the 95% CI in grey relative to a slope of 1 (dotted black lines). (A-C) Regression curves for the subgroup with AMH levels <2.80 ng/mL. (D-F) Regression curves for the subgroup with AMH levels between 2.80 and 7.04 ng/mL. (G-I) Regression curves for the subgroup with AMH levels >7.04 ng/mL. AMH, anti-Müllerian hormone; ELISA, enzyme-linked immunosorbent assay.
Figure 3.
Figure 3.
Regression curves of the correlation between assay-specific AMH measurements and follicle count. Solid grey lines represent the regression curve with the 95% CI. Every dot represents a patient. Patients without PCOM are indicated with open triangles. Patients with PCOM are indicated with solid circles. (A) Correlation between AMH levels measured by the Elecsys AMH plus assay (Roche) and total follicle count. (B) Correlation between AMH levels measured by the Gen II AMH ELISA (Beckman Coulter) with total follicle count. (C) Correlation between AMH levels measured by the picoAMH assay (Ansh Labs) with total follicle count. All correlations had P < .001. AMH, anti-Müllerian hormone; PCOM, polycystic ovary morphology.
Figure 4.
Figure 4.
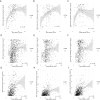
Regression curves of the correlation between assay-specific AMH measurements and follicle count across AMH subgroups. Solid grey lines represent the regression curve with the 95% CI. Every dot represents a patient. Patients without PCOM are indicated with open triangles. Patients with PCOM are indicated with solid circles. AMH levels were measured by the Elecsys AMH plus assay (Roche), the Gen II AMH ELISA (Beckman Coulter) and the picoAMH (Ansh Labs). (A-C) Regression curves for AMH levels <2.80 ng/mL. (D-F) Regression curves for AMH levels between 2.80 and 7.04 ng/mL. (G-I) Regression curves for AMH levels >7.04 ng/mL. aNonsignificant P value of .21. All other correlations had P < .001. AMH, anti-Müllerian hormone; TFC, total follicle count; PCOM, polycystic ovary morphology.

References

    1. Cate RL, Mattaliano RJ, Hession C, et al. . Isolation of the bovine and human genes for Mullerian inhibiting substance and expression of the human gene in animal cells. Cell. 1986;45(5):685-698. - PubMed
    1. Weenen C, Laven JS, Von Bergh AR, et al. . Anti-Mullerian hormone expression pattern in the human ovary: potential implications for initial and cyclic follicle recruitment. Mol Hum Reprod. 2004;10(2):77-83. - PubMed
    1. Nachtigal MW, Ingraham HA. Bioactivation of Mullerian inhibiting substance during gonadal development by a kex2/subtilisin-like endoprotease. Proc Natl Acad Sci USA. 1996;93(15):7711-7716. - PMC - PubMed
    1. Mishina Y, Whitworth DJ, Racine C, Behringer RR. High specificity of Mullerian-inhibiting substance signaling in vivo. Endocrinology. 1999;140(5):2084-2088. - PubMed
    1. Mullen RD, Behringer RR. Molecular genetics of Mullerian duct formation, regression and differentiation. Sex Dev. 2014;8(5):281-296. - PMC - PubMed

Publication types