

Estimating 3-D whole-body composition from a chest CT scan
- PMID: 35737963
- PMCID: PMC10084085
- DOI: 10.1002/mp.15821
Estimating 3-D whole-body composition from a chest CT scan
Abstract
Background: Estimating whole-body composition from limited region-computed tomography (CT) scans has many potential applications in clinical medicine; however, it is challenging.
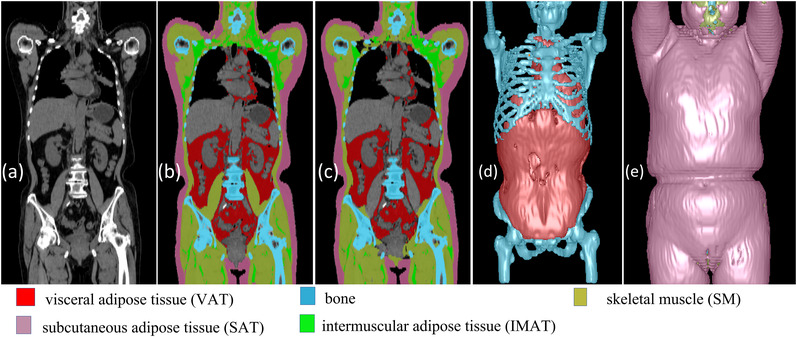
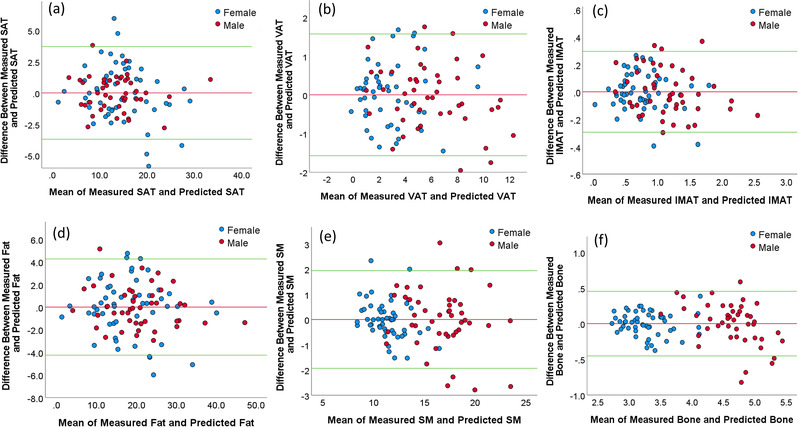
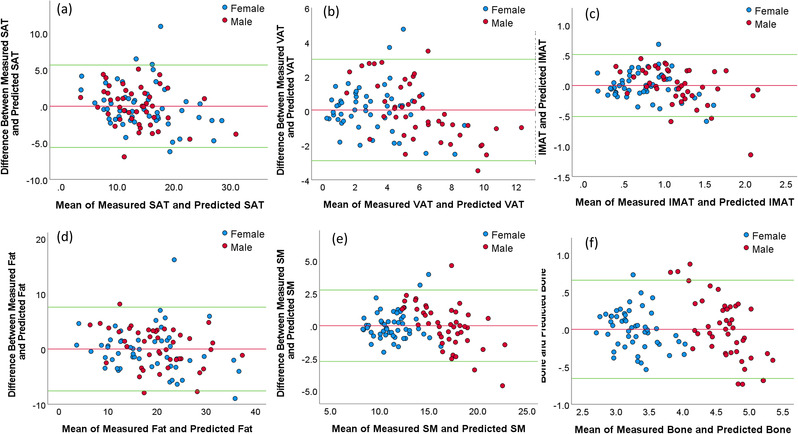
Purpose: To investigate if whole-body composition based on several tissue types (visceral adipose tissue [VAT], subcutaneous adipose tissue [SAT], intermuscular adipose tissue [IMAT], skeletal muscle [SM], and bone) can be reliably estimated from a chest CT scan only.
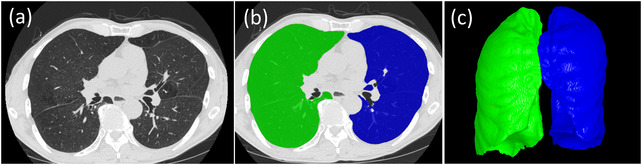
Methods: A cohort of 97 lung cancer subjects who underwent both chest CT scans and whole-body positron emission tomography-CT scans at our institution were collected. We used our in-house software to automatically segment and quantify VAT, SAT, IMAT, SM, and bone on the CT images. The field-of-views of the chest CT scans and the whole-body CT scans were standardized, namely, from vertebra T1 to L1 and from C1 to the bottom of the pelvis, respectively. Multivariate linear regression was used to develop the computer models for estimating the volumes of whole-body tissues from chest CT scans. Subject demographics (e.g., gender and age) and lung volume were included in the modeling analysis. Ten-fold cross-validation was used to validate the performance of the prediction models. Mean absolute difference (MAD) and R-squared (R2 ) were used as the performance metrics to assess the model performance.
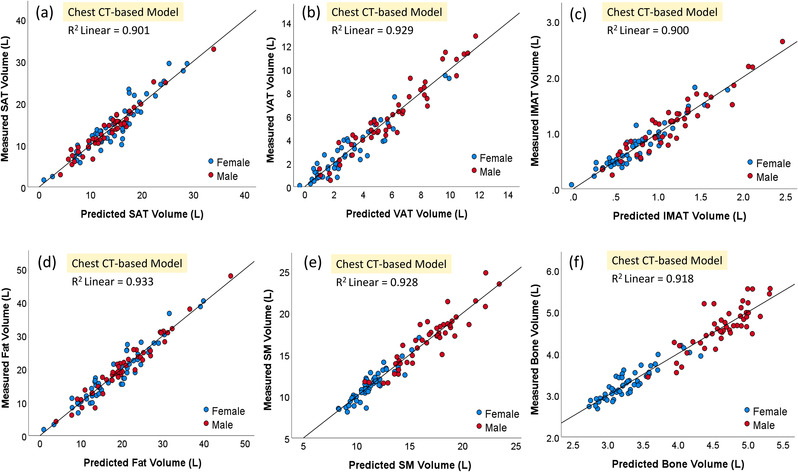
Results: The R2 values when estimating volumes of whole-body SAT, VAT, IMAT, total fat, SM, and bone from the regular chest CT scans were 0.901, 0.929, 0.900, 0.933, 0.928, and 0.918, respectively. The corresponding MADs (percentage difference) were 1.44 ± 1.21 L (12.21% ± 11.70%), 0.63 ± 0.49 L (29.68% ± 61.99%), 0.12 ± 0.09 L (16.20% ± 18.42%), 1.65 ± 1.40 L (10.43% ± 10.79%), 0.71 ± 0.68 L (5.14% ± 4.75%), and 0.17 ± 0.15 L (4.32% ± 3.38%), respectively.
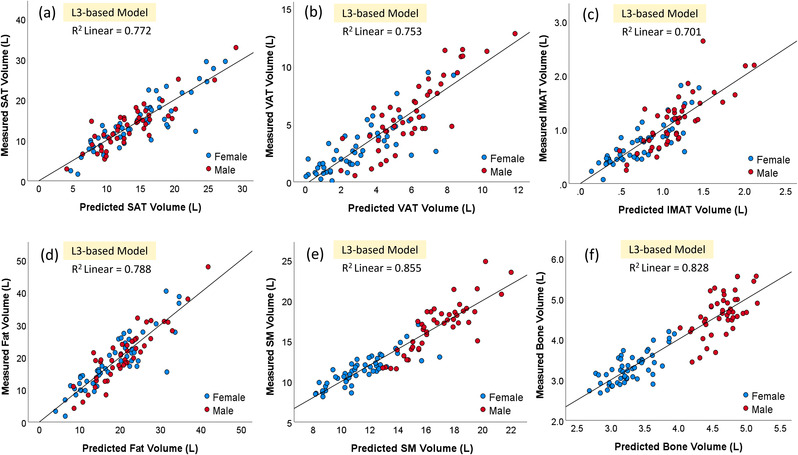
Conclusion: Our algorithm shows promise in its ability to estimate whole-body compositions from chest CT scans. Body composition measures based on chest CT scans are more accurate than those based on vertebra third lumbar.
Keywords: body composition; chest; computed tomography; prediction models; whole-body.
© 2022 The Authors. Medical Physics published by Wiley Periodicals LLC on behalf of American Association of Physicists in Medicine.
Conflict of interest statement
The authors declare that there is no conflict of interest that could be perceived as prejudicing the impartiality of the research reported.
Figures
References
-
- Rosen CJ, Klibanski A. Bone, fat, and body composition: evolving concepts in the pathogenesis of osteoporosis. Am J Med. 2009;122(5):409‐414. - PubMed
-
- Piche ME, Poirier P, Lemieux I, Despres JP. Overview of Epidemiology and Contribution of Obesity and Body Fat Distribution to Cardiovascular Disease: An Update. Prog Cardiovasc Dis. 2018;61(2):103‐113. - PubMed
-
- Shen W, Punyanitya M, Wang Z, et al. Total body skeletal muscle and adipose tissue volumes: estimation from a single abdominal cross‐sectional image. J Appl Physiol (1985). 2004;97(6):2333‐2338. - PubMed
MeSH terms
Grants and funding
LinkOut - more resources
Full Text Sources
Medical
Research Materials
