. 2022 Jun 23;12(1):10621.
doi: 10.1038/s41598-022-13730-z.

Elucidating macular structure-function correlations in glaucoma

Affiliations

Elucidating macular structure-function correlations in glaucoma

Sara Giammaria et al. Sci Rep. .

Abstract

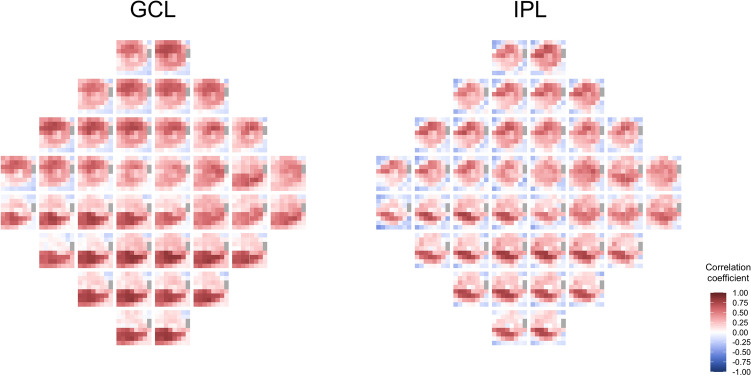
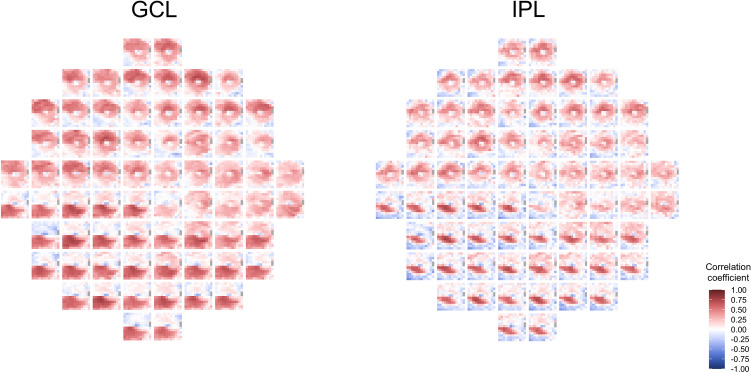
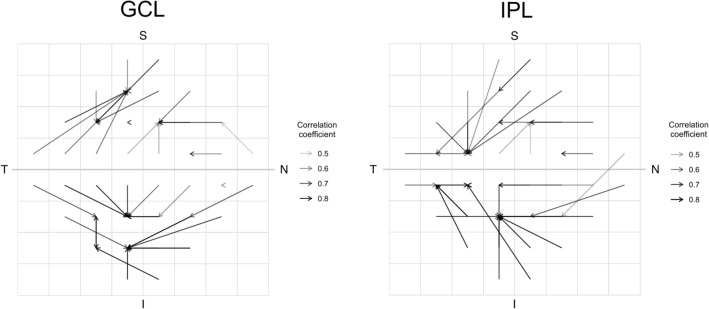
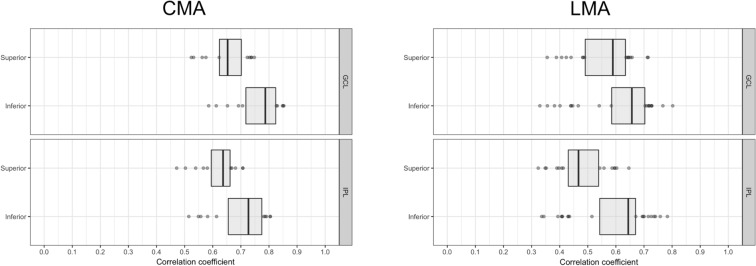
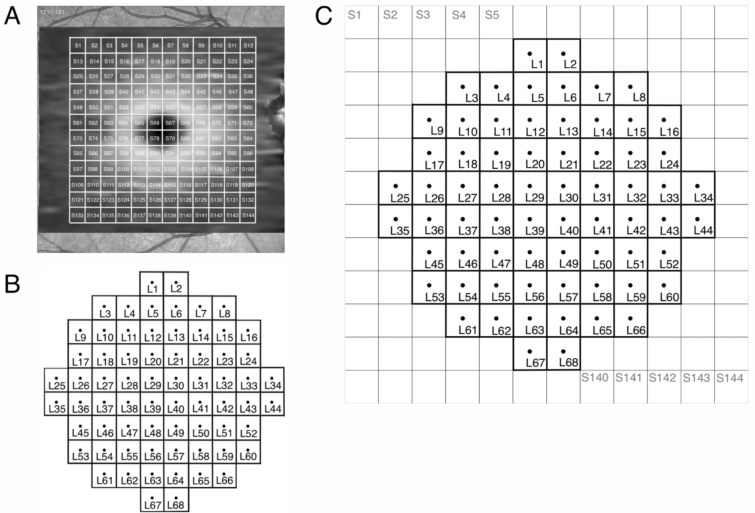
Correlation between structural data from optical coherence tomography and functional data from the visual field may be suboptimal because of poor mapping of OCT measurement locations to VF stimuli. We tested the hypothesis that stronger structure-function correlations in the macula can be achieved with fundus-tracking perimetery, by precisely mapping OCT measurements to VF sensitivity at the same location. The conventional 64 superpixel (3° × 3°) OCT grid was mapped to VF sensitivities averaged in 40 corresponding VF units with standard automated perimetry (conventional mapped approach, CMA) in 38 glaucoma patients and 10 healthy subjects. Similarly, a 144 superpixel (2° × 2°) OCT grid was mapped to each of the 68 locations with fundus-tracking perimetry (localized mapped approach, LMA). For each approach, the correlation between sensitivity at each VF unit and OCT superpixel was computed. Vector maps showing the maximum correlation between each VF unit and OCT pixel was generated. CMA yielded significantly higher structure-function correlations compared to LMA. Only 20% of the vectors with CMA and < 5% with LMA were within corresponding mapped OCT superpixels, while most were directed towards loci with structural damage. Measurement variability and patterns of structural damage more likely impact correlations compared to precise mapping of VF stimuli.


Conflict of interest statement

B.C.C. is consultant for CenterVue and Heidelberg Engineering. SG, GPS, OD, PER, LMS, MTN and JRV do not have competing interests.

Figures

Figure 1
Figure 1
Heatmaps of Pearson’s correlation coefficients between visual field units and OCT superpixels for the conventional mapped approach (CMA). Heatmaps of Pearson’s correlation coefficients between visual field (VF) units and OCT superpixels in the ganglion cell layer (GCL) and inner plexiform layer (IPL) for the conventional mapped approach. Each of the 40 squares represents the heatmap of the correlations between a single VF unit with all the 64 OCT superpixels. The VF units were flipped to correspond to the appropriate hemimacula.
Figure 2
Figure 2
Heatmaps of Pearson’s correlation coefficients between visual field units and OCT superpixels for the localized mapped approach (LMA). Heatmaps of Pearson’s correlation coefficients between visual field (VF) units and OCT superpixels in the ganglion cell layer (GCL) and inner plexiform layer (IPL) for the localized mapped approach. Each of the 68 squares represents the heatmap of the correlations between a single VF unit with all the 144 OCT superpixels. The VF units were flipped to correspond to the appropriate hemimacula.
Figure 3
Figure 3
Vector maps of the correlation coefficients obtained with the conventional mapped approach (CMA). Vector maps of the correlation coefficients in ganglion cell layer (GCL) and inner plexiform layer (IPL) obtained with the conventional mapped approach. Vectors connect each of the 40 visual field units with the OCT superpixel with the maximum correlation coefficient. The gray scale of the vectors represents the strength of the correlations. The bold gridline indicates the horizontal midline. S = Superior; N = Nasal; I = Inferior; T = Temporal.
Figure 4
Figure 4
Vector maps of the correlation coefficients obtained with the conventional mapped approach (LMA). Vector maps of the correlation coefficients in ganglion cell layer (GCL) and inner plexiform layer (IPL) obtained with the localized mapped approach. Vectors connect each of the 68 visual field units with the OCT superpixel with the maximum correlation coefficient. The gray scale of the vectors represents the strength of the correlations. The bold gridline indicates the horizontal midline. S = Superior; N = Nasal; I = Inferior; T = Temporal.
Figure 5
Figure 5
Distribution of the Pearson’s correlation coefficients in superior and inferior hemimaculas. Distribution of the Pearson’s correlation coefficients in superior and inferior hemimaculas in the ganglion cell layer (GCL) and inner plexiform layer (IPL) obtained with the conventional (CMA) and the localized (LMA) mapped approaches. Boxes represent the first and third quartiles and the vertical lines across the boxes indicate the medians.
Figure 6
Figure 6
Distribution of the Pearson’s correlation coefficients obtained with the conventional (CMA) and the localized (LMA) mapped approaches. Distribution of the Pearson’s correlation coefficients in the ganglion cell layer (GCL) and inner plexiform layer (IPL) obtained with the conventional (CMA) and the localized (LMA) mapped approaches. Boxes represent the first and third quartiles and the vertical lines across the boxes indicate the medians.
Figure 7
Figure 7
Methodology for the conventional mapped approach (CMA). Methodology for the conventional mapped approach comprising 64 OCT superpixels (S1–S64) arranged in an 8 × 8 superpixel grid (A) and 40 visual field (VF) units (C1–C40) (B) matching the OCT grid (C). The OCT grid is horizontally oriented, and the VF is flipped along the horizontal midline to correct for orientation.
Figure 8
Figure 8
Methodology for the localized mapped approach (LMA). Methodology for the localized mapped approach comprising144 OCT superpixels (S1-S144) arranged in a 12 × 12 superpixel grid (A) and 68 visual field (VF) units (L1–L68) (B) matching the OCT grid (C). The VF is flipped along the horizontal midline to correct for orientation.

References

    1. Curcio CA, Allen KA. Topography of ganglion cells in human retina. J. Comp. Neurol. 1990;300:5–25. doi: 10.1002/cne.903000103. - DOI - PubMed
    1. Zeimer R, Asrani S, Zou S, Quigley H, Jampel H. Quantitative detection of glaucomatous damage at the posterior pole by retinal thickness mapping: A pilot study. Ophthalmology. 1998;105:224–231. doi: 10.1016/S0161-6420(98)92743-9. - DOI - PubMed
    1. Leung CKS, et al. Comparison of macular and peripapillary measurements for the detection of glaucoma: An optical coherence tomography study. Ophthalmology. 2005;112:391–400. doi: 10.1016/j.ophtha.2004.10.020. - DOI - PubMed
    1. Nouri-Mahdavi K, et al. Macular ganglion cell/inner plexiform layer measurements by spectral domain optical coherence tomography for detection of early glaucoma and comparison to retinal nerve fiber layer measurements. Am. J. Ophthalmol. 2013;156:1297–1307.e2. doi: 10.1016/j.ajo.2013.08.001. - DOI - PMC - PubMed
    1. Staurenghi G, Sadda S, Chakravarthy U, Spaide RF. Proposed lexicon for anatomic landmarks in normal posterior segment spectral-domain optical coherence tomography: The IN·OCT consensus. Ophthalmology. 2014;121:1572–1578. doi: 10.1016/j.ophtha.2014.02.023. - DOI - PubMed

Publication types

Grants and funding