Observational Study
. 2022 Aug;28(8):1581-1589.
doi: 10.1038/s41591-022-01856-6. Epub 2022 Jun 23.

Molecular profiling identifies targeted therapy opportunities in pediatric solid cancer

Affiliations
Observational Study

Molecular profiling identifies targeted therapy opportunities in pediatric solid cancer

Alanna J Church et al. Nat Med. 2022 Aug.

Abstract

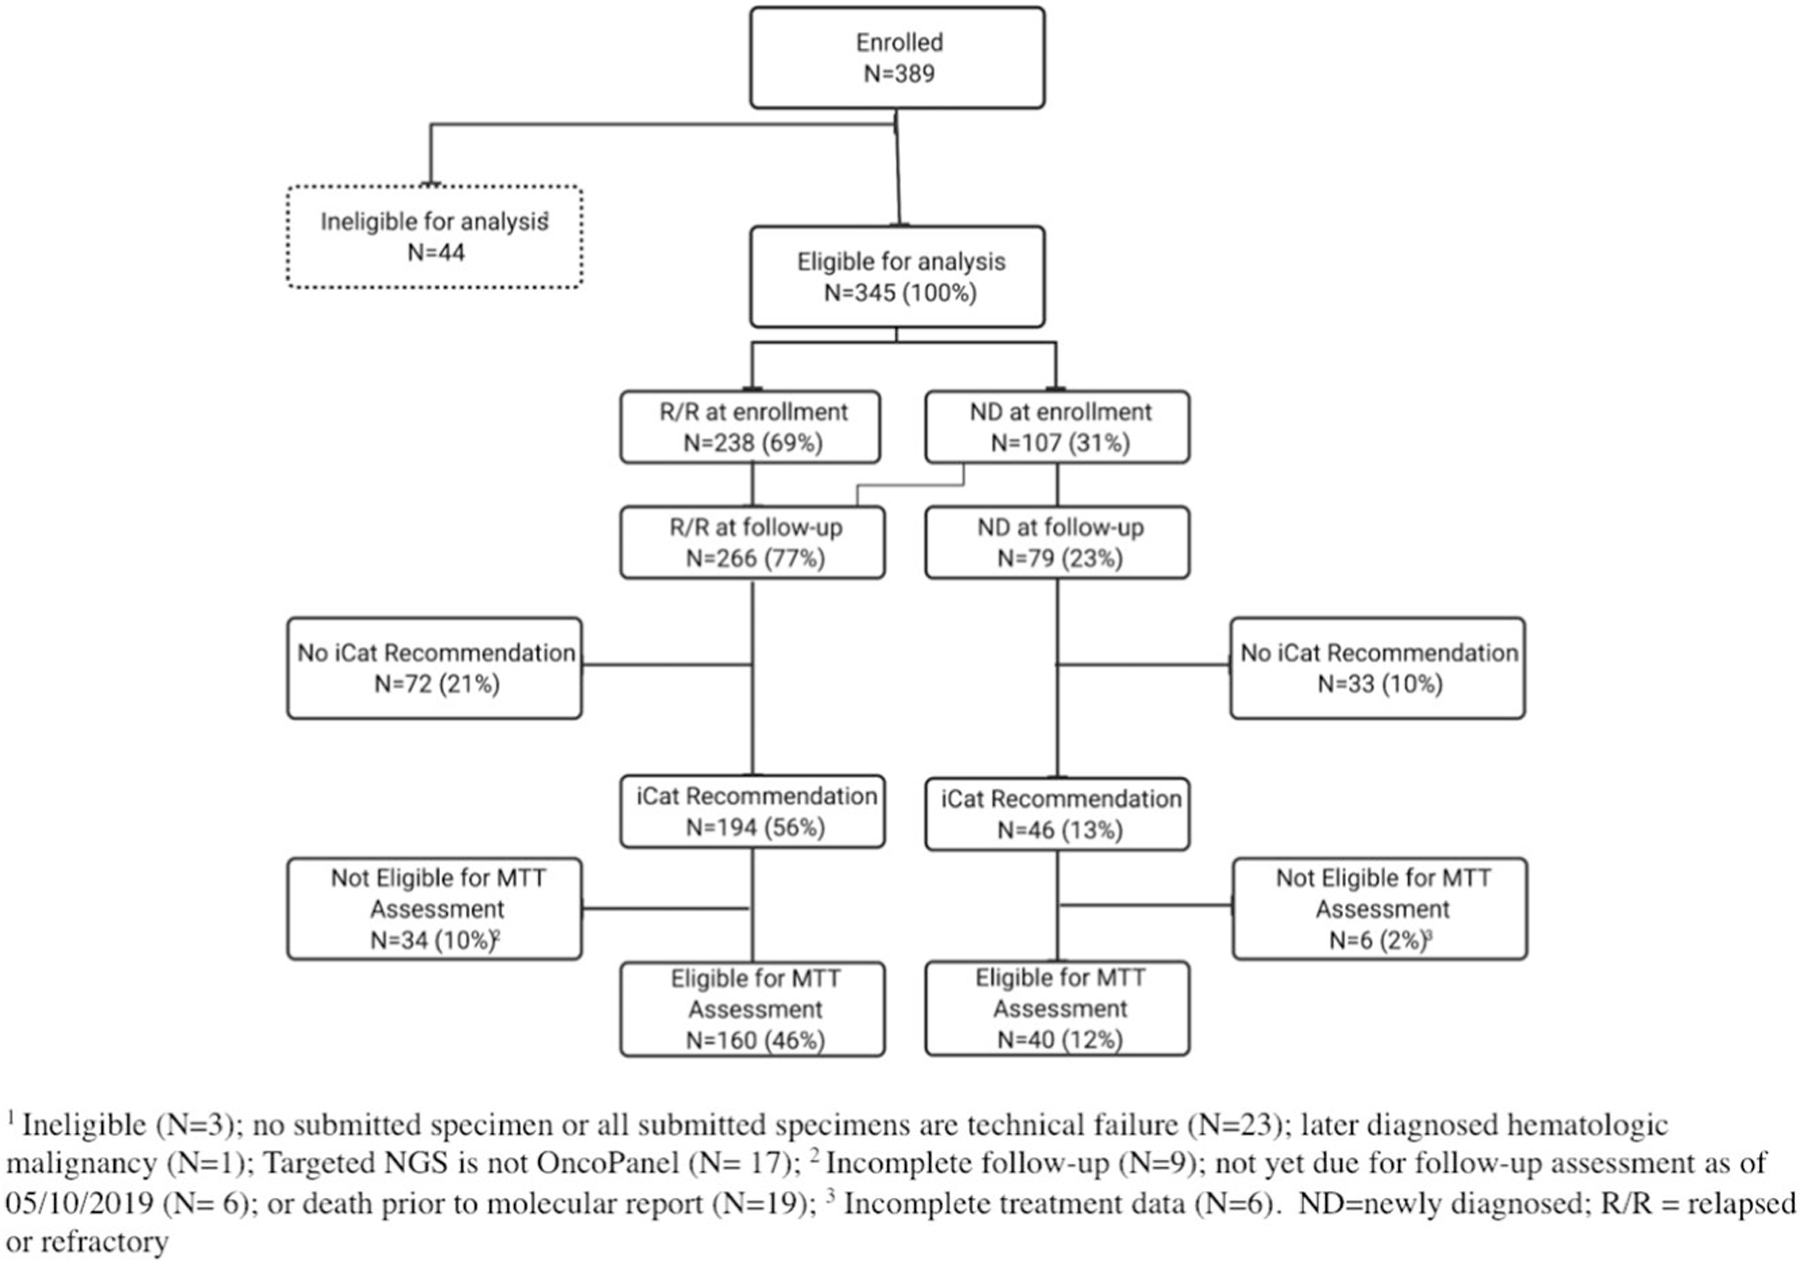
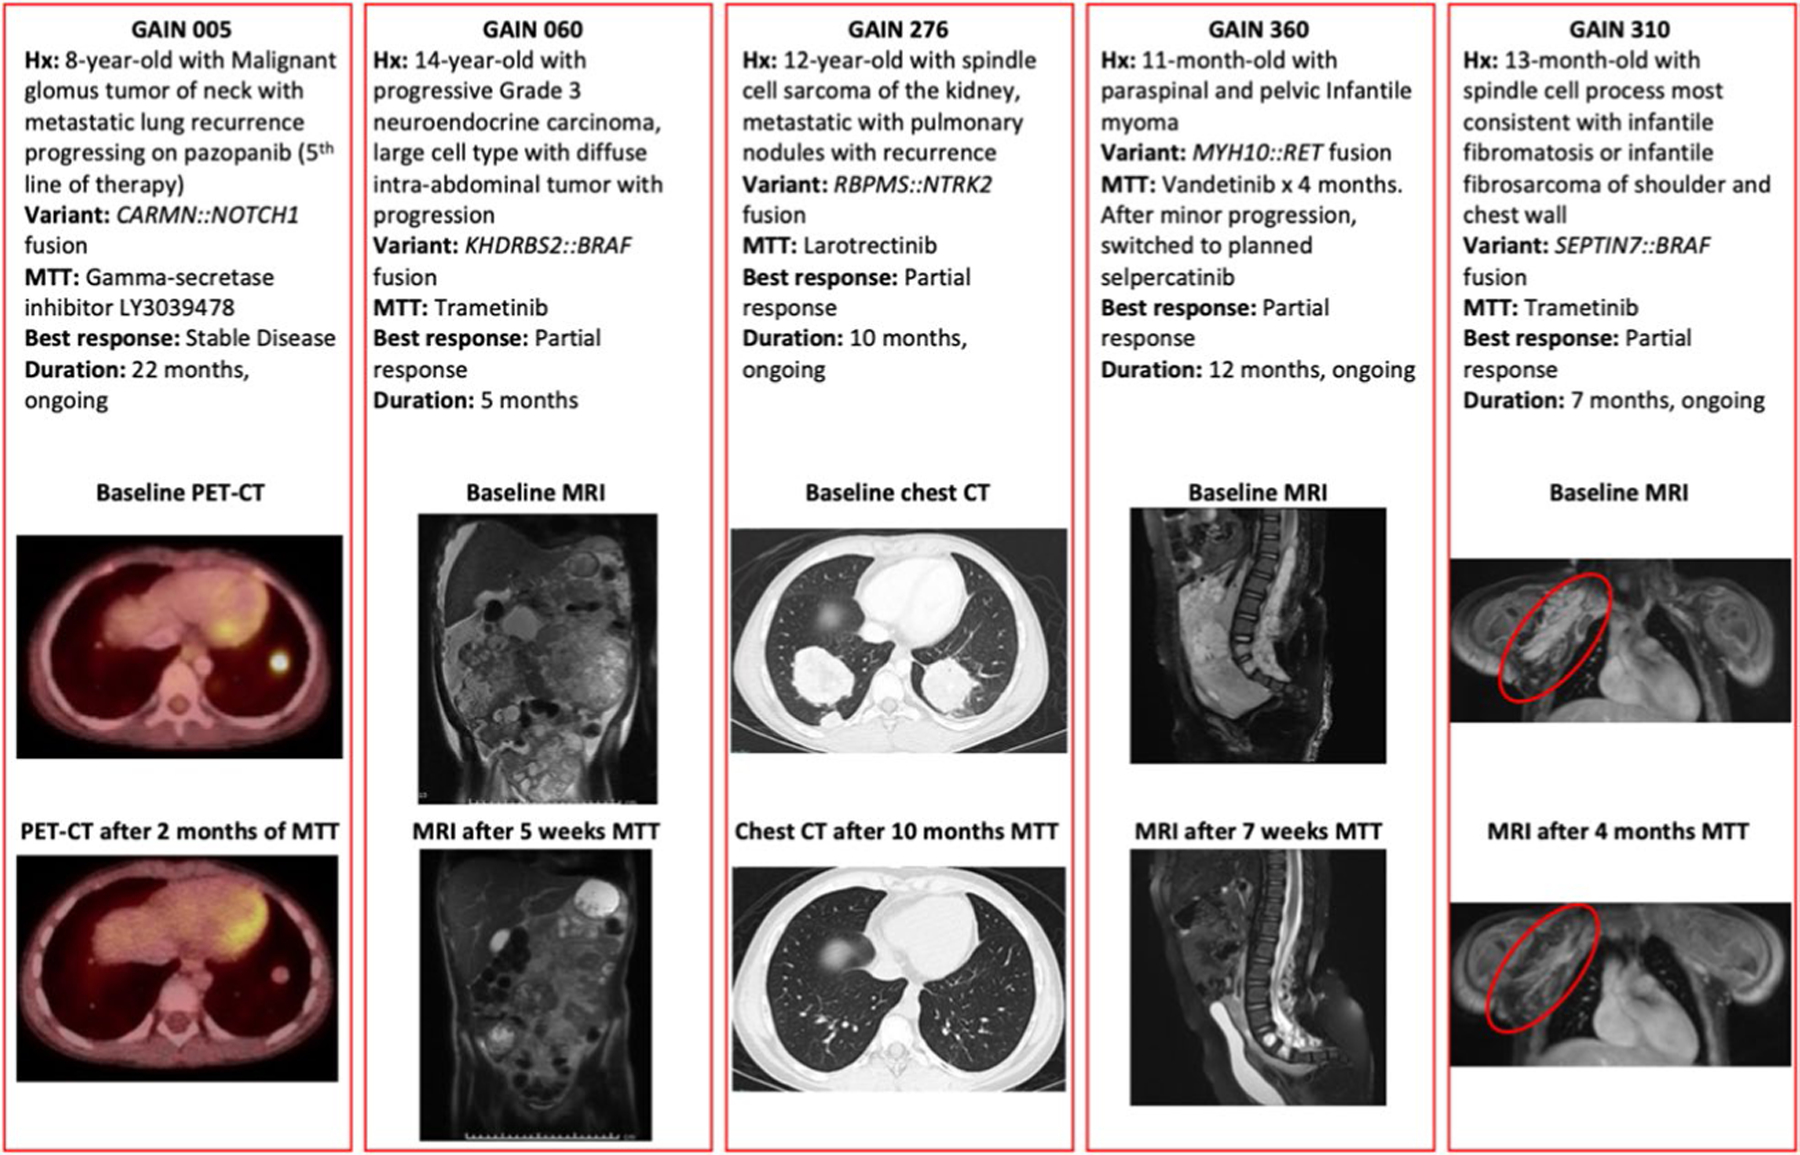
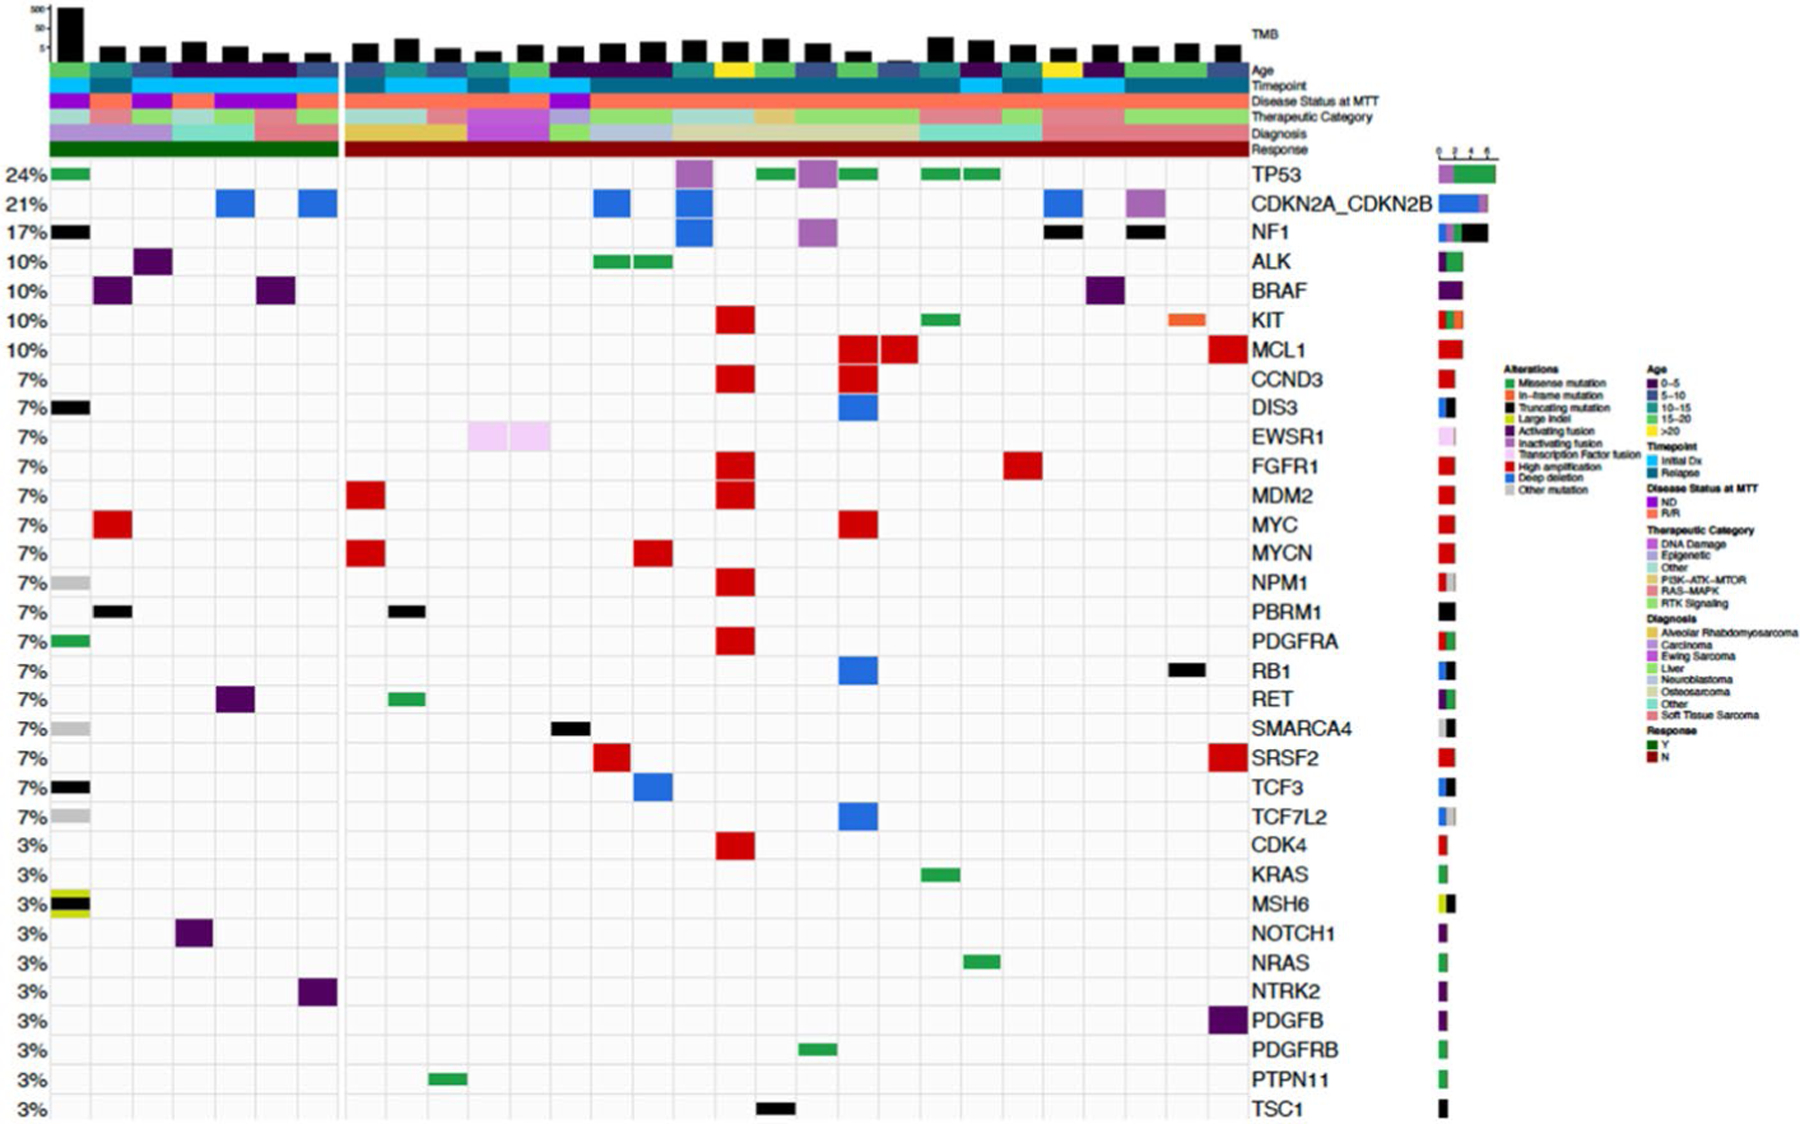
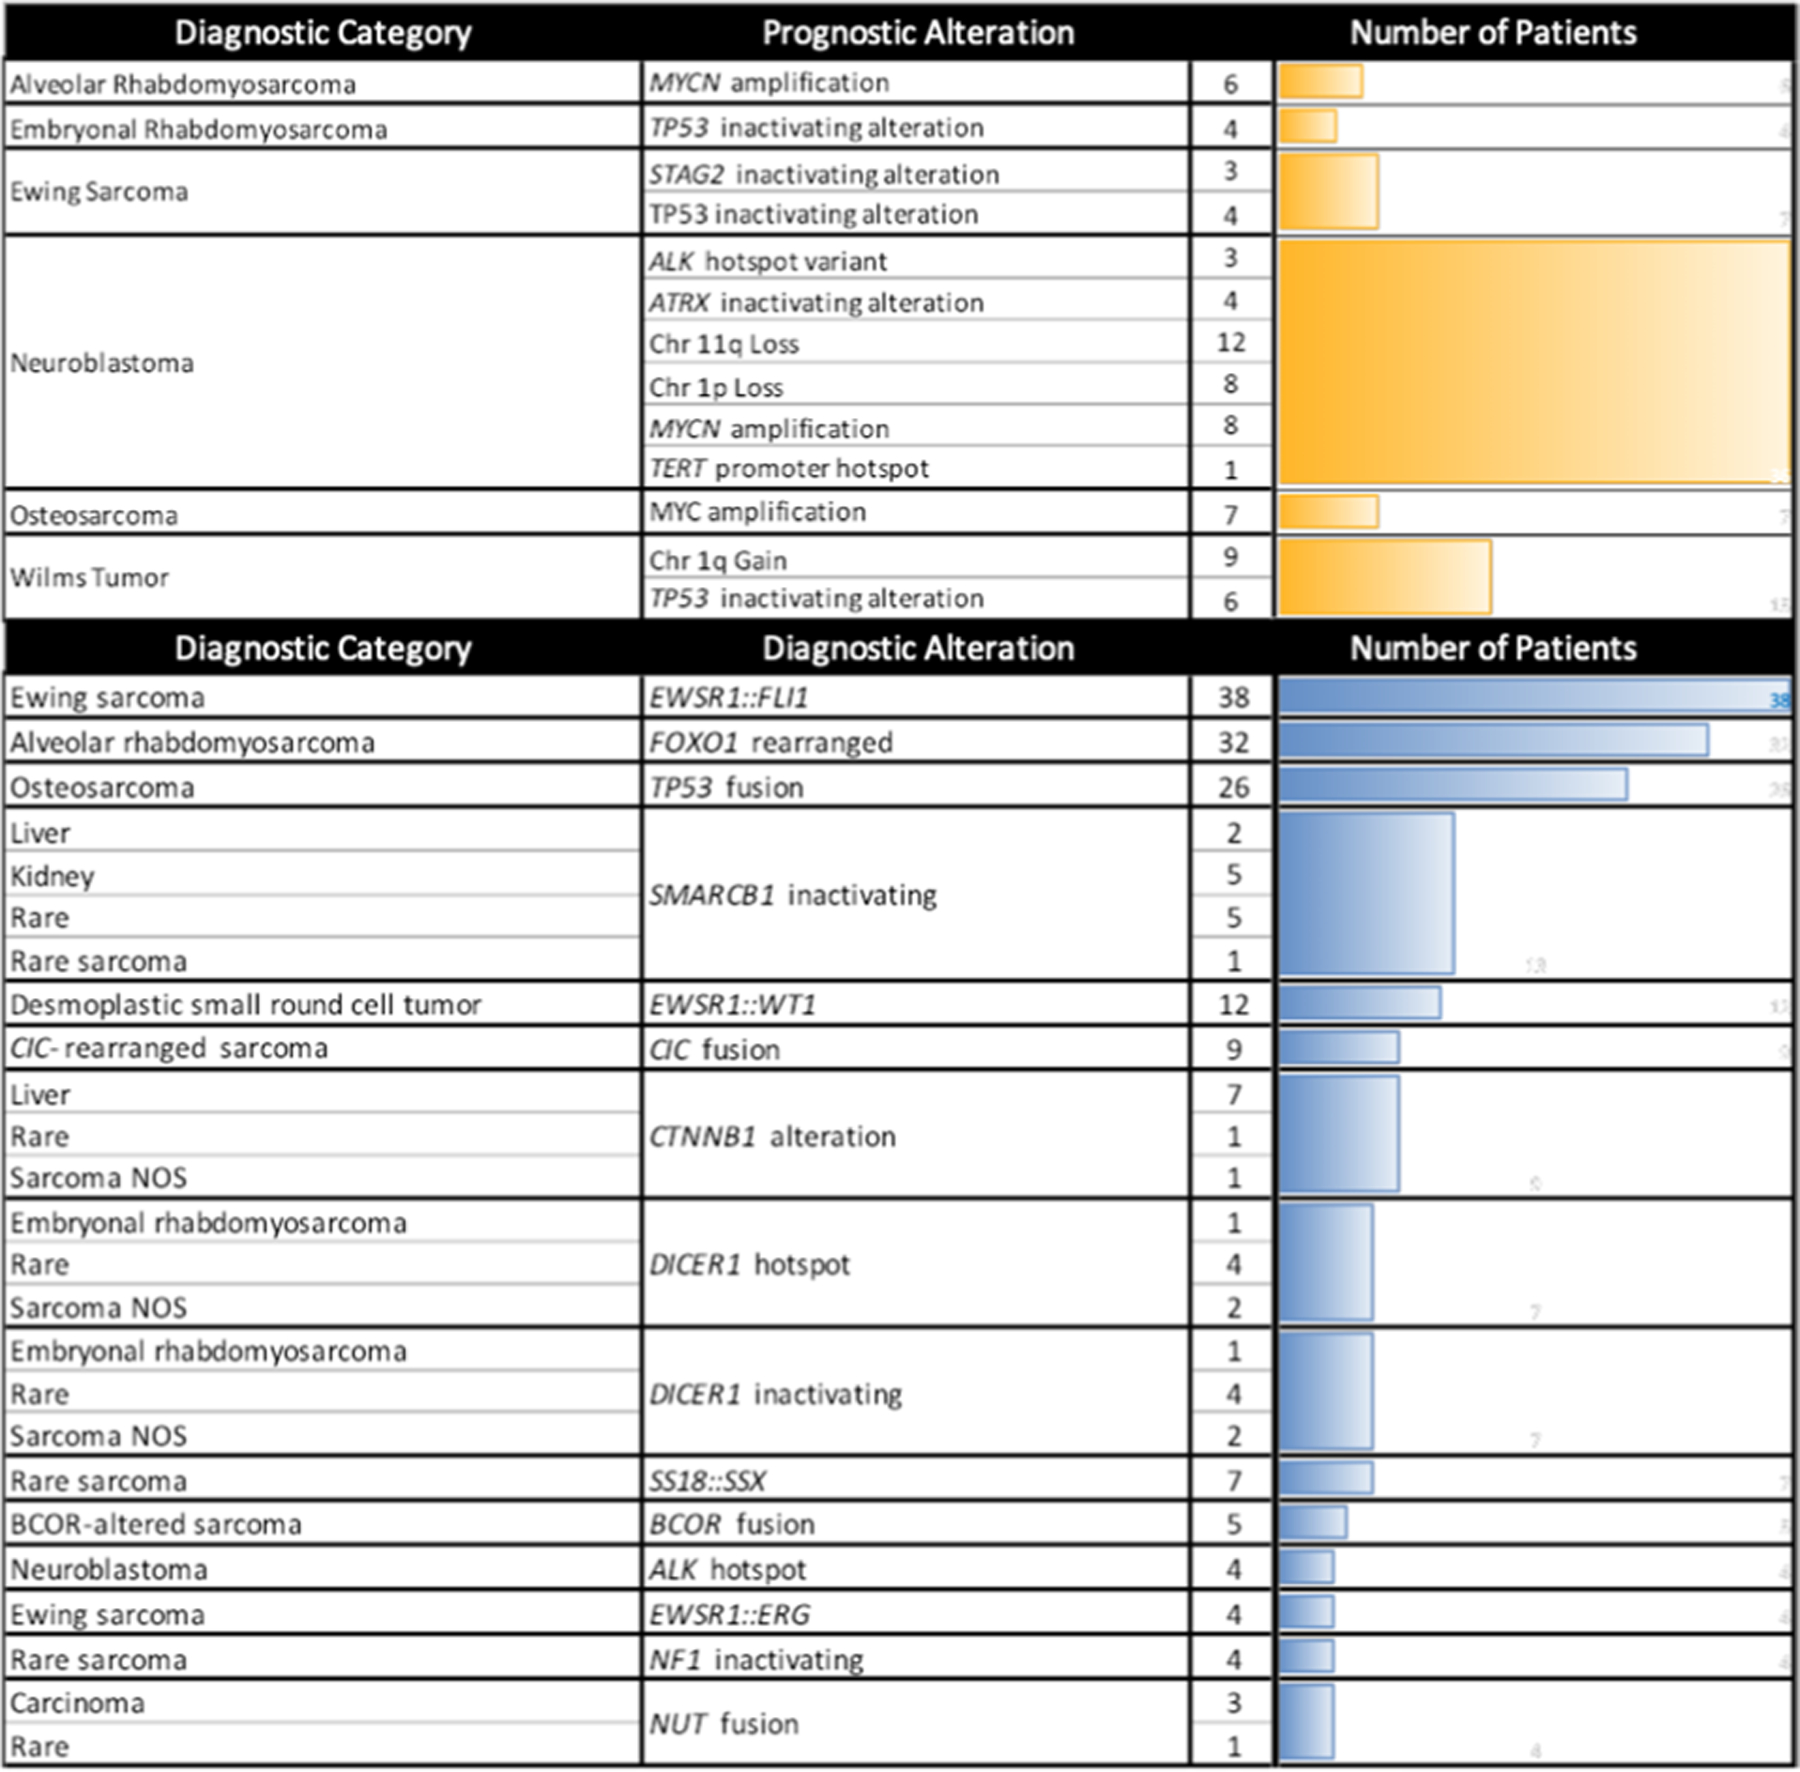
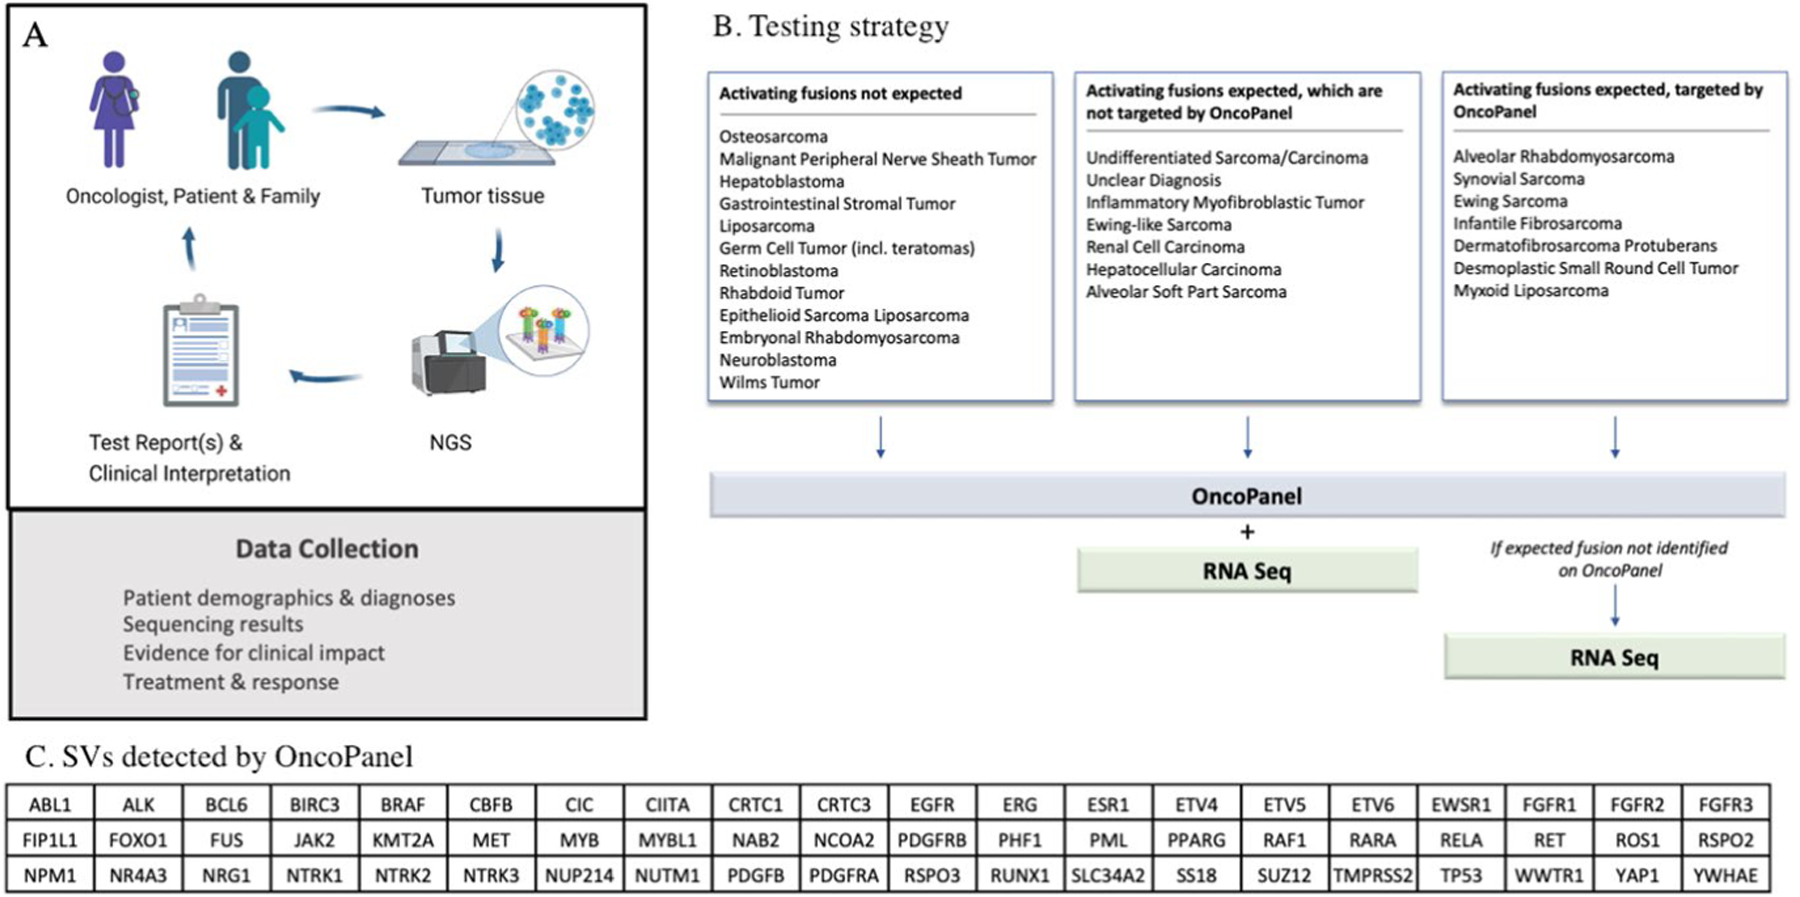
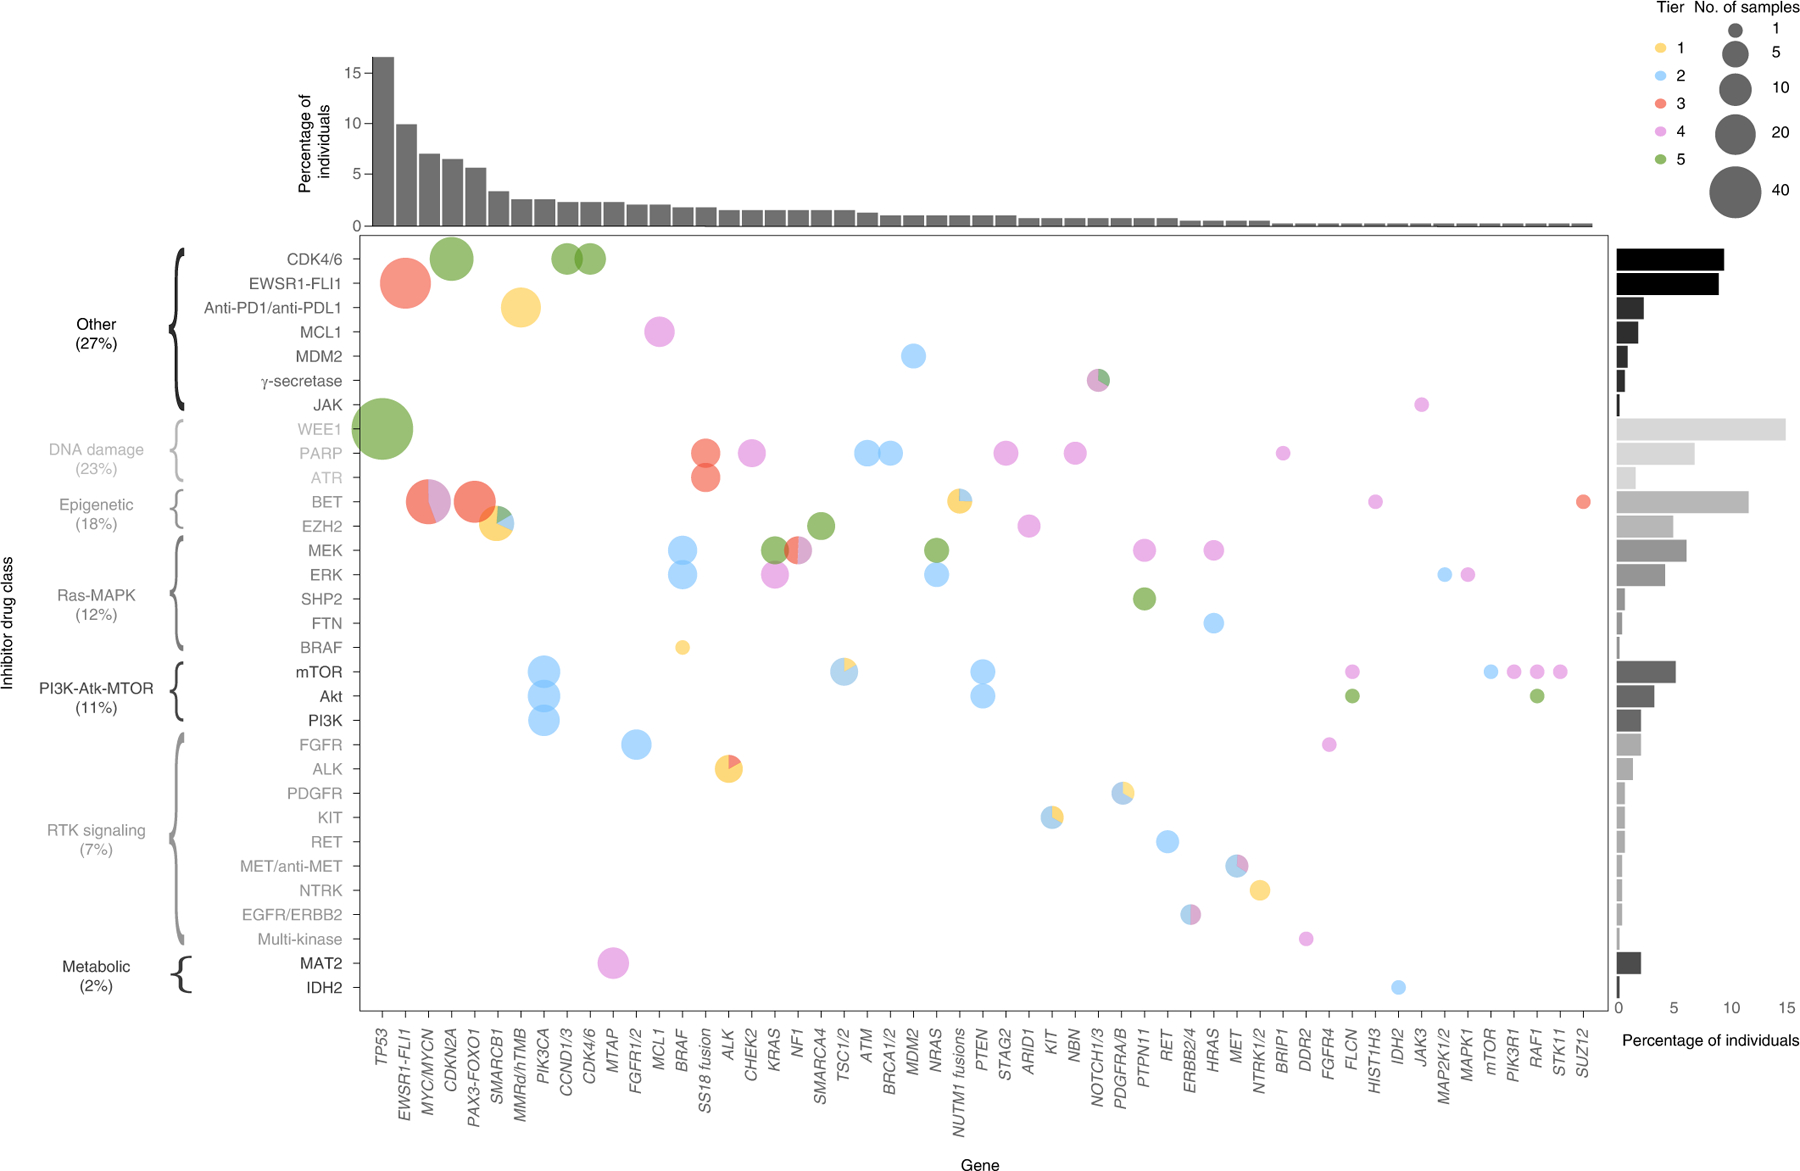
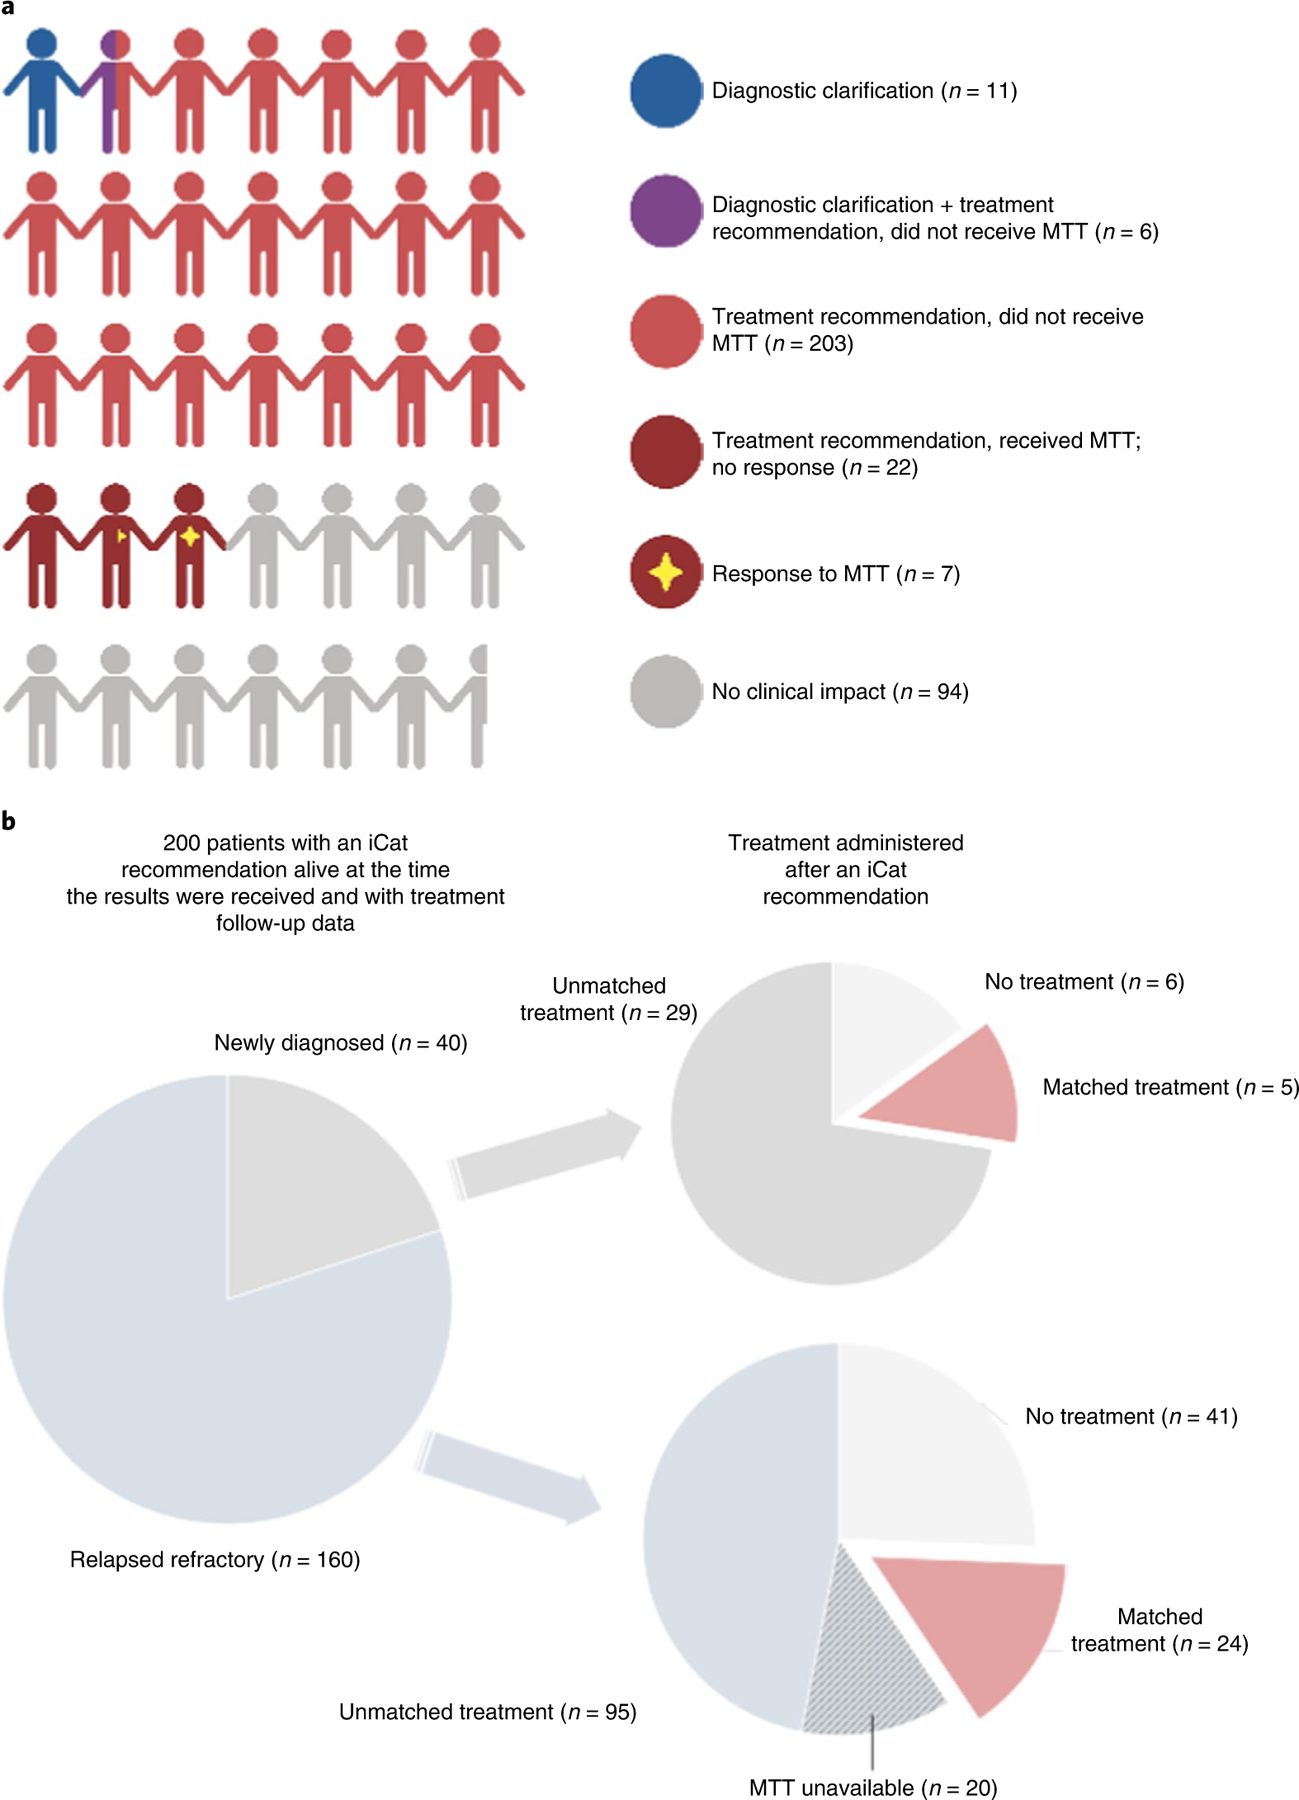
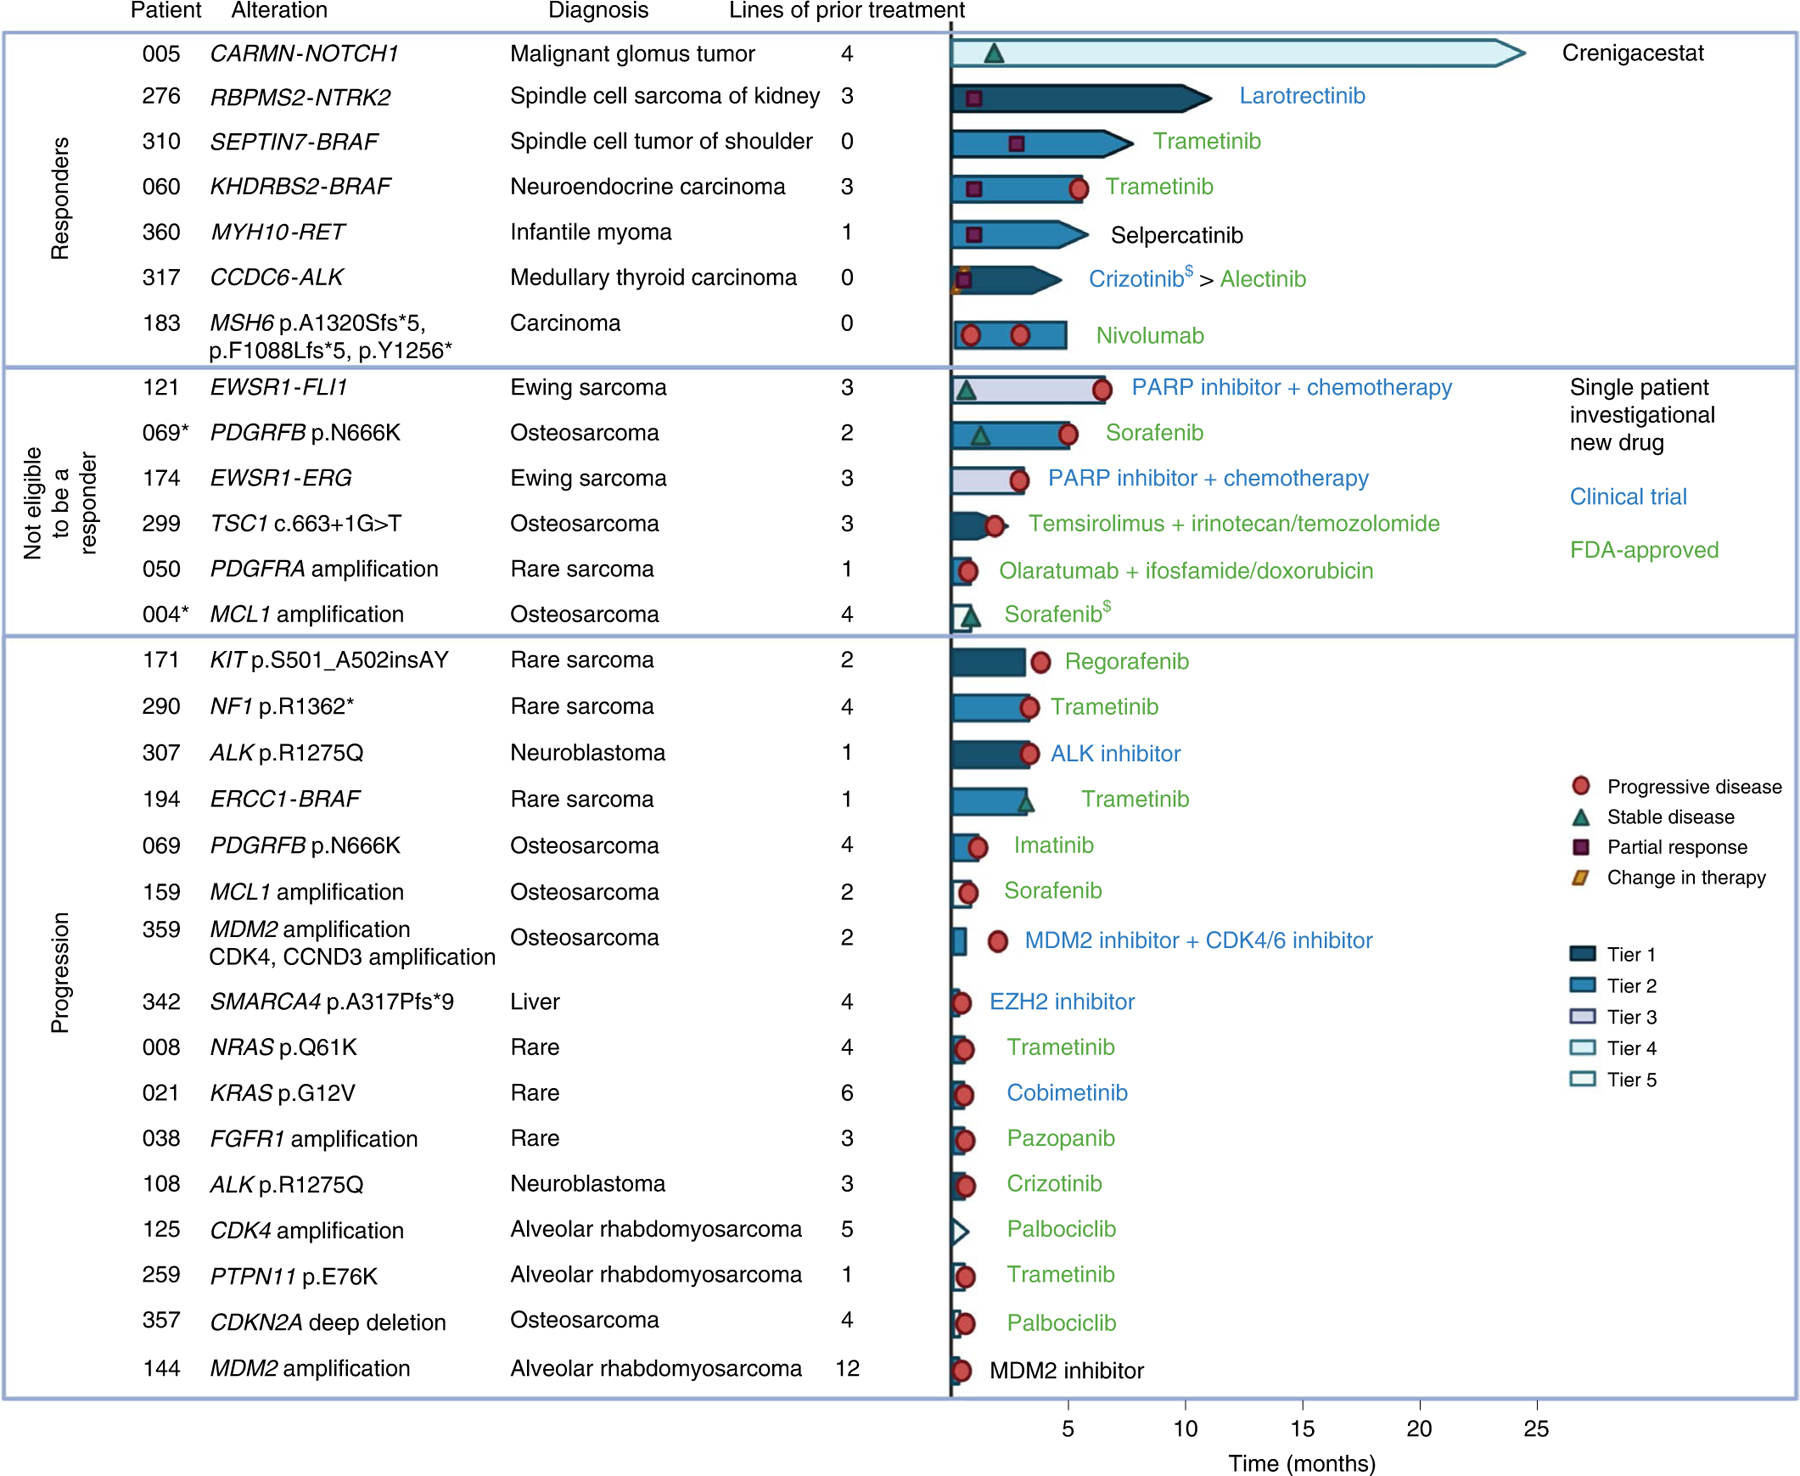
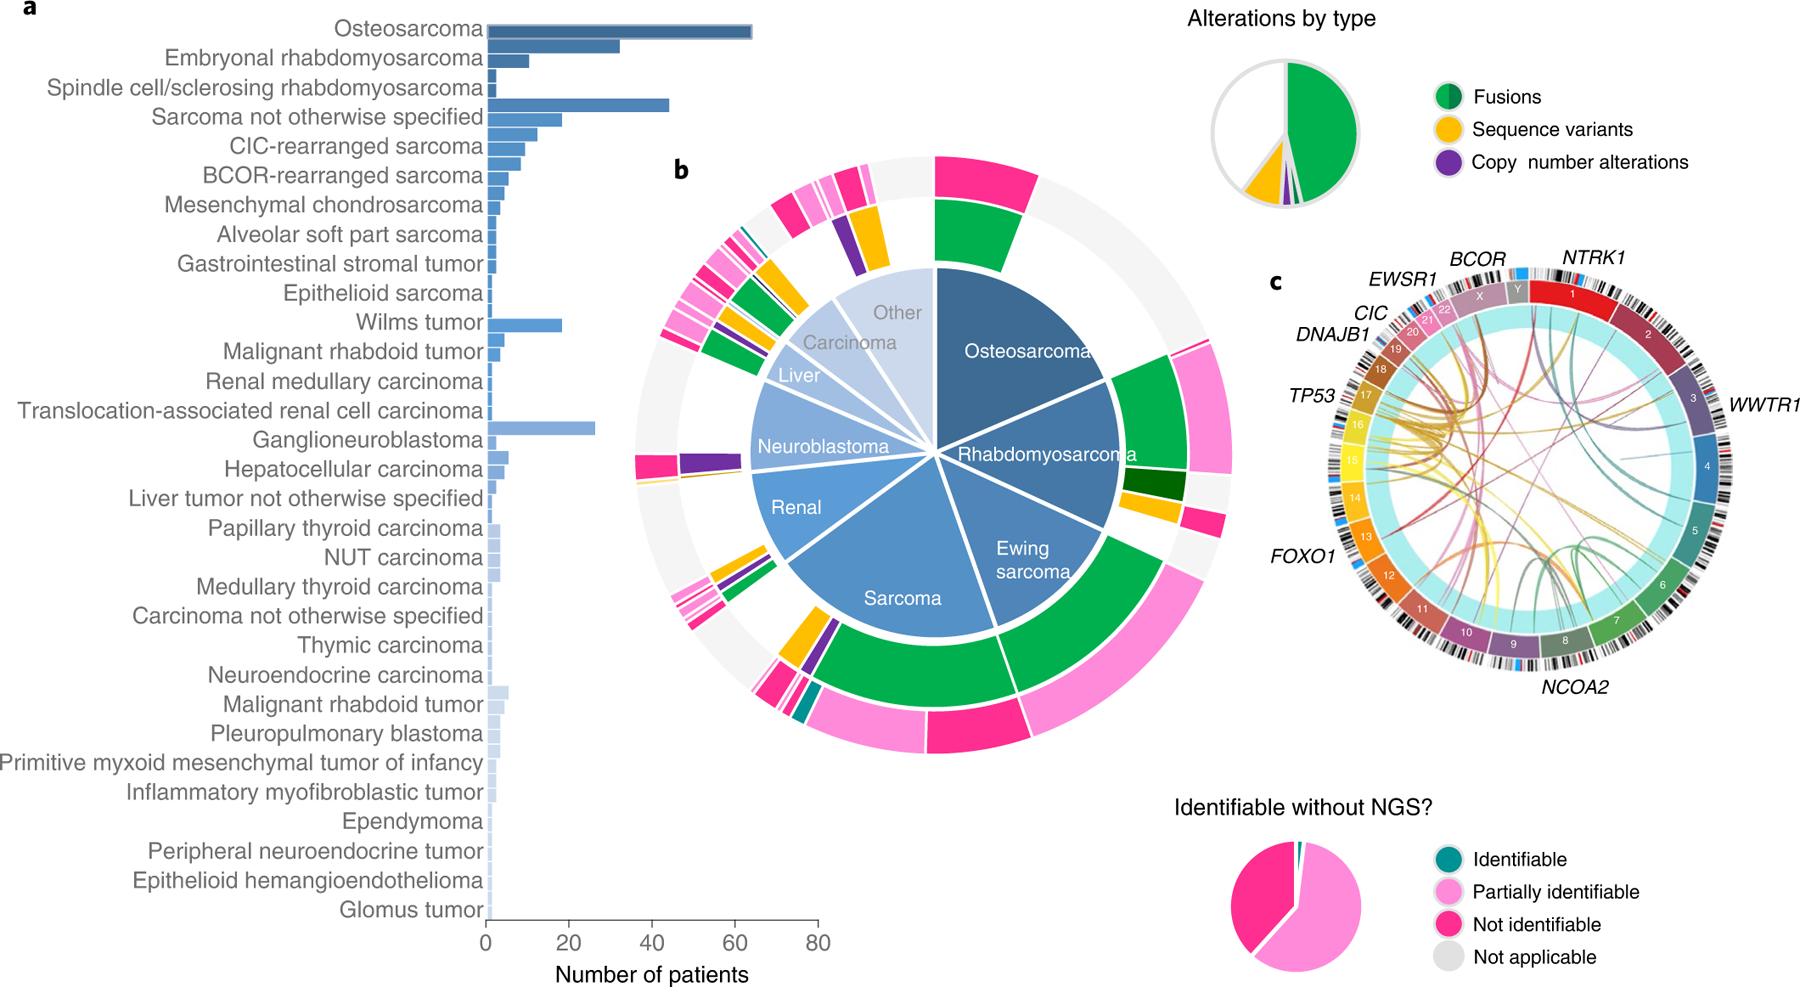
To evaluate the clinical impact of molecular tumor profiling (MTP) with targeted sequencing panel tests, pediatric patients with extracranial solid tumors were enrolled in a prospective observational cohort study at 12 institutions. In the 345-patient analytical population, median age at diagnosis was 12 years (range 0-27.5); 298 patients (86%) had 1 or more alterations with potential for impact on care. Genomic alterations with diagnostic, prognostic or therapeutic significance were present in 61, 16 and 65% of patients, respectively. After return of the results, impact on care included 17 patients with a clarified diagnostic classification and 240 patients with an MTP result that could be used to select molecularly targeted therapy matched to identified alterations (MTT). Of the 29 patients who received MTT, 24% had an objective response or experienced durable clinical benefit; all but 1 of these patients received targeted therapy matched to a gene fusion. Of the diagnostic variants identified in 209 patients, 77% were gene fusions. MTP with targeted panel tests that includes fusion detection has a substantial clinical impact for young patients with solid tumors.


Conflict of interest statement

Competing interests

A.J.C. sits on an advisory board for Bayer. L.B.C. is an employee at Sema4 and is a consultant for X-Chem and Biomatics. L.M. is a consultant for Jazz Pharmaceuticals. T.W.L. is an advisory board member for Bayer and has received honoraria from Bayer, Cellectis, Novartis, Deciphera, Jumo Health and Y-mAbs and has received research funding from Pfizer and Bayer. M.A.A. is an advisory board member for Fennec Pharmaceuticals. Y-C.L. is an advisory board member for Takeda Pharmaceutical Company. A.D.C. has received research support from Bayer and his spouse is employed by Labcorp. J.K.’s spouse has received consulting fees from ROME Therapeutics, Foundation Medicine, NanoString, Merck Millipore and Pfizer that are not related to this work. J.K.’s spouse is a founder and has equity in ROME Therapeutics, PanTher Therapeutics and TellBio, which is not related to this work. J.K.’s spouse receives research support from ACD Bio-Techne, PureTech Health and Ribon Therapeutics, which was not used in this work. S.L.V. is a consultant for CVS Accordant. E.V.A. has provided advisory/consulting work for Tango Therapeutics, Genome Medical, Invitae, Enara Bio, Janssen, Manifold Bio and Monte Rosa Therapeutics, has received research support from Novartis and Bristol Myers Squibb, holds equity in Tango Therapeutics, Genome Medical, Syapse, Enara Bio, Manifold Bio, Microsoft and Monte Rosa Therapeutics, has received travel reimbursement from Roche/Genentech and holds institutional patents filed on chromatin mutations and immunotherapy response and methods for clinical interpretation. S.G.D. has consulted for Bayer and received travel expenses from Loxo Oncology, Roche and Salarius. W.B.L. has served on the data safety monitoring boards for Merck Millipore and Jubilant Draximage. K.A.J. has consulted for Ipsen and Bayer, and has received honoraria from Foundation Medicine and Takeda Pharmaceutical Company. The other authors declare no competing interests.

Figures

Extended Data Fig. 1 |
Extended Data Fig. 1 |. CONSORT diagram.
CONSORT diagram of 389 patients enrolled in the GAIN/iCat2 study between 11/2015 and 12/2018 identifying the analytic cohort. Percentages are based on the analytic population (n = 345).
Extended Data Fig. 2 |
Extended Data Fig. 2 |. iCat Recommendations.
Number of genes with iCat recommendations per patient at the time of initial report (February, 2016 to June, 2019) and with updated evidence reviewed between May and June, 2020 (a). Highest tier of iCat therapeutic recommendation for each patient at the time of initial report (February, 2016 to June, 2019) and with updated evidence reviewed between May and June, 2020 (b).
Extended Data Fig. 3 |
Extended Data Fig. 3 |. Changes in iCat Recommendations.
Changes in tiering of individual iCat recommendations from the time of initial report (February, 2016 to June, 2019) to re-tiering with updated evidence reviewed between May and June, 2020 upon reevaluation of evidence for expected response to matched targeted therapy.
Extended Data Fig. 4 |
Extended Data Fig. 4 |. Genes with iCat Recommendations.
iCat tiers reported according to alteration type (a). Top genes with strong evidence for therapeutic impact (iCat tiers 1–2) at the time of report (February 2016 to June 2019) (b) and with updated evidence reviewed between May and June, 2020 (c).
Extended Data Fig. 5 |
Extended Data Fig. 5 |. Responders to Matched Targeted Therapy.
Details of 5 responders to matched targeted therapy. GAIN patient 317 with an ALK fusion in a medullary thyroid carcinoma also responded, with images available in the primary report (Hillier et al., 2019).
Extended Data Fig. 6 |
Extended Data Fig. 6 |. Oncoprint for Patients Receiving MTT.
Tumor mutational burden (TMB) and additional alterations in 29 patients who received MTT. Additional alterations are shown if they occurred in >1 case or were potentially targetable. (For the case with high TMB all potentially actionable variants are not shown).
Extended Data Fig. 7 |
Extended Data Fig. 7 |. Top Genes with Diagnostic and Prognostic Significance.
All genes or chromosomes arms with tier 1 or 2 AMP/CAP/ASCO guideline evidence for prognostic impact (top; yellow). Top alterations with tier 1 or 2 AMP/CAP/ASCO guideline evidence for diagnostic impact, representing 181 of 227 diagnostically significant alterations (bottom; blue).
Extended Data Fig. 8 |
Extended Data Fig. 8 |. Diagnostic Impact Case.
Details of an illustrative case (GAIN318) of diagnostic impact: MRI (sagittal short inversion time inversion recovery (STIR) sequence) of a distal tibia tumor at diagnosis (a) and one year later at recurrence (b). The diagnosis rendered in the pathology report at initial diagnosis was aneurysmal bone cyst (ABC) while biopsy of the recurrence demonstrated osteogenic cells with pleomorphism and atypical mitotic figures (c, H&E stain, single experiment, not repeated). p53 IHC (d) shows loss of p53 expression in tumor but not normal cells (single experiment, not repeated). GAIN sequencing identified a novel TP53::USP6 fusion connecting TP53 intron 1 to USP6 intron 7, supporting a diagnosis of osteosarcoma in which TP53 rearrangements are common (e, created with Biorender.com). RNA analysis shows high expression of USP6, as measured by the number of unique RNA reads across 4 USP6 target regions [chr17:5031701, chr17:5033235, chr17:5033666, chr17:5033937], shown in the context of 12 cases with USP6 fusions (left, average read count 1552 reads) compared to 20 control cases with no USP6 fusions (right, average read count 8.0). This represents a significant difference in expression (unpaired two-tail t-test, p = 6.3e-10). Box plots represent maximum and minimum values (whiskers), first and third quartiles (bounds of box) and median (center line) (f).
Extended Data Fig. 9 |
Extended Data Fig. 9 |. Overview of the iCat2/GAIN Study.
Overview of the iCat2/GAIN study (a, created with Biorender.com). Targeted DNA NGS is performed on one or more tumor samples from each patient. Selected patients also have tumors subjected to RNA sequencing. Test results are returned to the treating oncologist and follow-up treatment and response data are collected. Details of clinical interpretation of test reports including molecular tumor board are shown in extended data Fig. 3. Testing strategy (b) to select patients for additional sequencing with either whole transcriptome sequencing or targeted RNA fusion panel testing (RNASeq). RNASeq was not performed if it was unlikely to contribute to research findings or clinical care. In this study, transcriptome sequencing was analyzed only for structural variants (SVs) and OncoPanel detects rearrangements in 60 genes (c). The testing triage is based on several assumptions: 1) False positives for SV detection OncoPanel are uncommon; 2) If oncogenic fusions have not been described in a particular solid tumor in previous studies and typical oncogenic events for that diagnosis are present then novel oncogenic fusions are unlikely; and 3) very rare pediatric solid malignancies might harbor previously undescribed fusions because they are understudied.
Extended Data Fig. 10 |
Extended Data Fig. 10 |. Details of Clinical Interpretation.
Details of clinical interpretation of test reports. A knowledgebase and report generation tool, iCatalog, was developed specifically for this study. iCatalog contains pediatric cancer specific knowledge on the gene and variant level including associated references (stored with PMID) and clinical trials (stored by NCT number). iCatalog knowledge is maintained by a staff scientist and research coordinator both at several scheduled times and when interpreting cases. iCatalog uses API to annotate variants. Resources available to the iCatalog user are shown below. Cases with Tier 5 iCat recommendations, previously undiscussed evidence or conflicting evidence are discussed at the molecular tumor board. Clinical interpretation reports are returned to the lead site investigator or enrolling oncologist.
Fig. 1 |
Fig. 1 |. Relationship between genes containing actionable variants and the drug class of the iCat recommendation.
The size of each dot represents the number of patients who received iCat recommendations and the color represents the iCat recommendation tier.
Fig. 2 |
Fig. 2 |. Summary infographic of the outcome for the 345 patients in the analytical cohort after return of genomic results with diagnostic or therapeutic significance.
a, Each cartoon person represents 10 patients. Overall, 73% of patients had an impact on care, including 17 patients with a change in their diagnosis (blue and purple) and 29 patients receiving MTT (dark red) with 7 of these having a response (dark red with star). Created with Biorender. com. b, Treatment received by the 200 patients with therapeutically actionable alterations resulting in an iCat recommendation and sufficient treatment follow-up data to be eligible for assessment of MTT. Patients did not receive MTT because they either received no therapy (n = 46), were newly diagnosed and receiving initial treatment (n = 29) or MTT was not available (n = 23).
Fig. 3 |
Fig. 3 |. Swimmer plot of treatment response for 29 patients who received MTT.
Additional details regarding responders are included in Supplementary Fig. 5. *Patient received treatment with evaluable disease. $Patient stopped treatment due to toxicity. Created with Biorender.com.
Fig. 4 |
Fig. 4 |
a,b, Diagnoses and diagnostically significant alterations. In 345 patients, 59 distinct solid tumor diagnoses were made, including many sarcomas and rare tumors, shown in the histogram (a), grouped by diagnostic bins in the central pie chart (b). Two hundred and eight patients had diagnostic alterations with tier 1 or 2 impact according to the AMP/CAP/ASCO guidelines. Diagnostic alterations for each patient are displayed in the inner ring and are grouped by diagnostic bins shown in the central pie chart. Fusions (green) consist of most of the diagnostically significant alterations. The outer ring shows patients whose alterations would have been identified using traditional techniques like FISH, PCR with reverse transcription or IHC: 4 patients (1.9%) would have had their diagnostic variant identified; 125 patients (60%) would have had their alterations partially identified; and the diagnostic alterations of 80 patients (38%) would have been completely missed using traditional assays. c, The Circos plot shows the wide variety of genes involved in diagnostic fusions. Circos plot created with Circa (http://omgenomics.com/circa).

Comment in

References

    1. Brandão M, Caparica R, Eiger D & de Azambuja E Biomarkers of response and resistance to PI3K inhibitors in estrogen receptor-positive breast cancer patients and combination therapies involving PI3K inhibitors. Ann. Oncol 30, x27–x42 (2019). - PMC - PubMed
    1. Drilon A et al. Efficacy of larotrectinib in TRK fusion-positive cancers in adults and children. N. Engl. J. Med 378, 731–739 (2018). - PMC - PubMed
    1. Havel JJ, Chowell D & Chan TA The evolving landscape of biomarkers for checkpoint inhibitor immunotherapy. Nat. Rev. Cancer 19, 133–150 (2019). - PMC - PubMed
    1. Le DT et al. Mismatch repair deficiency predicts response of solid tumors to PD-1 blockade. Science 357, 409–413 (2017). - PMC - PubMed
    1. Lindeman NI et al. Updated molecular testing guideline for the selection of lung cancer patients for treatment with targeted tyrosine kinase inhibitors: guideline from the College of American Pathologists, the International Association for the Study of Lung Cancer, and the Association for Molecular Pathology. J. Thorac. Oncol 13, 323–358 (2018). - PubMed

Publication types

Substances