. 2022 Jul;25(7):956-966.
doi: 10.1038/s41593-022-01095-5. Epub 2022 Jun 23.

Single-cell transcriptomics and surface epitope detection in human brain epileptic lesions identifies pro-inflammatory signaling

Affiliations

Single-cell transcriptomics and surface epitope detection in human brain epileptic lesions identifies pro-inflammatory signaling

Pavanish Kumar et al. Nat Neurosci. 2022 Jul.

Abstract

Epileptogenic triggers are multifactorial and not well understood. Here we aimed to address the hypothesis that inappropriate pro-inflammatory mechanisms contribute to the pathogenesis of refractory epilepsy (non-responsiveness to antiepileptic drugs) in human patients. We used single-cell cellular indexing of transcriptomes and epitopes by sequencing (CITE-seq) to reveal the immunotranscriptome of surgically resected epileptic lesion tissues. Our approach uncovered a pro-inflammatory microenvironment, including extensive activation of microglia and infiltration of other pro-inflammatory immune cells. These findings were supported by ligand-receptor (LR) interactome analysis, which demonstrated potential mechanisms of infiltration and evidence of direct physical interactions between microglia and T cells. Together, these data provide insight into the immune microenvironment in epileptic tissue, which may aid the development of new therapeutics.


Conflict of interest statement

The authors declare no competing interests.

Figures

Fig. 1
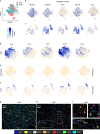
Fig. 1. Microglia and infiltrating immune cells in brain tissue from patients with DRE.
a, Position and phenotype of clusters on the t-SNE map. Color represents the cluster ID. b, Surface epitope expression of lineage-specific cellular markers quantified using antibody staining with the CITE-seq protocol was overlaid on the t-SNE map to identify the cluster phenotype. Color intensity reflects cellular surface epitope protein expression. c, Stacked bar chart shows the frequency of infiltrating, resident (microglial) immune cells and NVU cells from brain tissues of patients with DRE. Bar color reflects cell types as indicated in the figure. OL, olfactory lobe; FL, frontal lobe; TL, temporal lobe. P1.A, occipital cortex; P1.B, occipital core; P2, frontal lobe; P3.A, posterior mid-temporal gyrus; P3.B, superior frontal gyrus; P4, posterior mid-temporal gyrus; P5.A, posterior mid-temporal gyrus; P5.B, lateral mid-temporal gyrus; P6.A, mid-temporal gyrus; P6.B, posterior temporal gyrus; P6.C, lateral temporal gyrus.
Fig. 2
Fig. 2. Expression of pro-inflammatory and microglial-specific genes in patients with DRE, non-neurological disease controls and brain tissue of patients with ASD.
a, Distribution of microglial cells from non-neurological disease controls (CON) and patients with ASD on a t-SNE map. b,c, snRNA-seq dataset (b) and scRNA-seq dataset (c) show expression of microglial marker genes overlaid on a t-SNE map. df, Expression of pro-inflammatory cytokines and chemokine marker genes. Normalized gene expression levels were overlaid on the t-SNE map. gi, Multispectral Opal dye IHC imaging of brain tissue sections from control tissue (g) and DRE lesion tissue (h). i, Magnified image from the DRE tissue section. FFPE (5-µm) tissue sections were stained with panels of antibodies for microglia (AIF-1), macrophages (CD68), T cells (CD3), neurons (microtubule-associated protein 2 (MAP2)), astrocytes (GFAP) and the pro-inflammatory cytokine IL-1b. After staining with all the antibodies, sections were stained with 4,6-diamidino-2-phenylindole (DAPI) for a nuclear stain. Tissues were imaged using the Vectra 3 imaging system with a 40× view finder. White boxes and numbers in h correspond to the magnified image in i. FFPE brain tissue sections from controls (n = 4) and DRE lesions (n = 4) were stained and imaged, and a representative image from one sample is shown. The colors that represent the antibody and nuclear stain are shown. Data from Velmeshev et al. (a,b,e); data from the Masuda et al. (c,f).
Fig. 3
Fig. 3. Infiltrating immune cells in the epileptic human brain and their interaction with NVU cells.
a, Cluster positions are shown on a t-SNE map where color represents cluster identity. b, Surface epitope expression of lineage-specific cellular markers quantified using antibody staining with the CITE-seq protocol was overlaid on a t-SNE map to identify the cluster phenotypes. Color intensity reflects the expression of cellular surface proteins. c, LR interaction network between NVUs and immune cell clusters is shown as a directed network graph. Network nodes reflect cluster ID, and edges shown as colored arrows reflect the potential interaction between cognate LR pairs. Arrow direction shows signaling from ligands (arrow tail) to receptors (arrowhead). Thickness and color of the arrows reflect the number of LR pairs found between the two nodes. Node ID is shown as imm_ (for immune cell clusters) and micro_20, micro_13,and micro_22 for NVU clusters. Node colors show the cell type. d, Network of all ligand and receptor gene pairs found enriched between clusters of NVUs and immune cells. Here nodes represent ligands (blue circles) and receptors (yellow circles), and edges show cognate ligand and receptor interactions. Recently updated gene names include CYR61 (CCN1), CTGF (CCN2), NOV (CCN3), MLLT4 (AFDN), PVRL2 (NECTIN2). Arrow directions show signaling from ligands (arrow tail) to receptors (arrowhead). Arrow colors show the number of cluster pairs for which an LR pair was enriched.
Fig. 4
Fig. 4. LR genes significantly modulated in a TLE epilepsy mouse model.
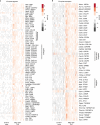
a,b, LR network genes enriched in human epileptic brain foci (Fig. 3d and Extended Data Fig. 9) were investigated for differential gene regulation in a TLE mouse model compared with control mice. RNA-seq data from hippocampal brain tissue from mice with TLE (n = 100) and control mice (n = 100) were analyzed. Expression of significantly differentially regulated (exact test and FDR < 0.05) ligand (a) and receptor (b) genes is shown as a heatmap. Each row of the heatmap shows a mouse gene and its human ortholog gene (shown in uppercase letters), and each column represents data from an individual mouse.
Fig. 5
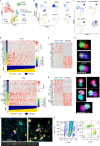
Fig. 5. Direct interaction of microglia and infiltrating T cells in brain tissue from patients with refractory epilepsy.
a, Doublet cell clusters are shown on the t-SNE map. Numbers and colors on the t-SNE map show the cluster ID. b, Surface epitope protein expression of major lineage markers are overlaid on the t-SNE map. c, Gene expression specific to NK cells is overlaid on the t-SNE map. d,f, Gene expression profile of physically interacting CD4+ T and microglial cells (d) and CD8+ T and microglial cells (f). The bar at the bottom (blue, microglia; yellow, T cells) shows the estimated mixing factor. Heatmap and mixing factor bars are ordered with increasing mixing factor value for T cells. Left, colored bar indicates the ratio of expected gene expression in microglia versus T cells. The top ten genes specific to T cells (lower microglial/T cell ratio) and specific to microglia (higher microglial/T cell ratio) are shown in the heatmap. e,g, Real gene expression values in microglia and T cells. Heatmaps were plotted for 500 randomly drawn cells, 250 each from microglia and T cells. h,i, Immune cells isolated from DRE tissue were formalin fixed, and cells were cytocentrifuged with Cytospin on slides for staining of CD3, AIF-1 and IL-1b. DAPI was used for the nuclear stain. Stained slides were imaged using a Vectra 3.0 imaging microscope. h, T cell (CD3+)–microglial (AIF-1) immune cell complex. i, Representative T cell–microglial immune cell complex producing IL-1b from the brain tissue of three patients with DRE. j, T cell–microglial immune cell complex from one of the FFPE tissue sections stained with a panel of six antibodies. A CD3+ T cell (orange) in physical interaction with an AIF-1+ microglia (yellow) is indicated with a white arrow, and IL-1b proteins are shown (red). k, Bivariate flow cytometry plot with gating for CD45, CD11b and CD3. Left, live gated cells with SSC on the y axis and CD45 expression on the x axis. Right, CD45hi-gated cells with CD3 expression on the y axis and CD11b expression on the x axis. CD115 levels were overlaid on the bivariate plot, where expression is indicated from low (green) to high (red). Flow cytometry analysis and plots were created using FlowJo software.
Extended Data Fig. 1
Extended Data Fig. 1. Microglia heterogeneity and differential abundance across the epilepsy patients brain tissue.
(a) Stacked bar chart shows the frequency of various microglia clusters in each patient’s brain tissue. Color of bar shows the cluster identity. (b) Distribution of all the cells from each patient’s brain tissue was plotted as t-SNE map. Stacked bar chart and 2-D t-SNE map both shows differential abundance of microglia clusters across the patient’s brain. (c, d) To identify the phenotype of microglia clusters, normalized gene expression for each cluster was plotted as violin plot. (c, d) shows the gene expression profile of selected microglia specific, inflammatory and activation marker genes y-axis show normalized expression levels and x-axis shows cluster id.
Extended Data Fig. 2
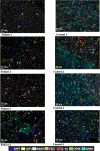
Extended Data Fig. 2. Multispectral 7 color immunohistochemistry (IHC) imaging analysis.
Multispectral OpalTM dye immunohistochemistry (IHC) imaging of brain tissue section from (a) DRE lesion tissue and (b) Control tissue. 5 µm FFPE (Formalin Fixed Paraffin Embedded) tissue sections from 4 DRE patients’ brain and 4 control brain tissue were stained with panels of antibody for microglia (AIF1), macrophage (CD68), T cells (CD3), Neurons (MAP2), Astrocytes (GFAP), Pro-inflammatory cytokine (IL-1b). After staining with all the antibodies sections were stained with DAPI for nuclear stain. Tissues were imaged using Vectra-3.0TM imaging system with 40X view finder. Figure legend shows the colors that represent the antibody and nuclear stain. White arrow shows IL-1b staining, red arrowhead shows CD68 stain and thin cyan arrow shows CD3 stain.
Extended Data Fig. 3
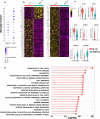
Extended Data Fig. 3. IL-1b expressing microglia genes expression profile compared with P2RY12 expressing microglia.
(a) Dotplot shows the normalized expression P2RY12 and IL1B in microglia clusters from DRE patient’s brain. Dot size reflects the percentage of cells that showed genes while color shows the expression levels of genes. (b) Heatmap of genes significantly modulated in IL-1B expressing clusters compared to P2RY12 expressing clusters. For heat map 100 random sampled cells were shown for both IL1b and P2RY12 cluster. c) IL1B, P2RY12 clusters marker, Chemokine CCL4, CCL3 cell adhesion genes ICAM1 and chemokine receptors CXCR4 and CX3CR1 were shown as violin plot. (d) GO gene set enrichment analysis results was shown as lollipop plot where on x-axis -log of FDR adjusted p-value for GO terms were shown. Top 20 GO term were shown in the figure.
Extended Data Fig. 4
Extended Data Fig. 4. Infiltrating immune cell clusters phenotype and abundance across patients and brain tissues.
(a) Heatmap shows the expression of cell type specific genes. Heatmap was plotted with normalized mean expression levels of genes in the clusters. Black color shows the low expression while red show higher levels. (b) Distribution of infiltrating immune cells shown as stacked bar chart. Clusters were merged into major cell type as shown in figure legend. Figure legends color shows major cell types and numbers in brackets shows clusters id that were grouped together to plot stacked bar chart.
Extended Data Fig. 5
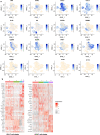
Extended Data Fig. 5. Pro-inflammatory cytokines and chemokine production by infiltrating immune cells.
(a) Gene expression overlaid on t-SNE map to shows the expression levels of pro inflammatory, cytolytic genes in brain infiltrating immune cells. (b) Heatmap of genes expressed in CD4+ and CD8+ T cell clusters. Each column of heat map shows one single cell. Log normalized values are used for heat map and t-SNE overlay plots.
Extended Data Fig. 6
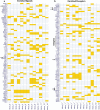
Extended Data Fig. 6. Enriched Ligands and Receptor in microglia clusters.
Enriched Ligands (a) and Enriched receptors (b) in microglia clusters were shown as tilemap, where filled rectangle (yellow color) shows enrichment of ligand/receptor in clusters indicated on x-axis. Expression of ligand/receptor in a cluster compared to all other clusters with log2fold > 1 was considered enriched.
Extended Data Fig. 7
Extended Data Fig. 7. Neurovascular unit (NVU) clusters phenotype.
(a) Top10 genes specifically expressed genes in NVU clusters (cluster 13, cluster 20 cluster 23) were displayed as Heatmap. Rows of Heatmap shows genes expression and columns shows randomly sampled 100 cells from each cluster. Top of the Heatmap colorbar shows cell type identity (red- smooth muscle cell (SMC), green- pericytes (PC), Blue- Endothelial cells (EC)) and in brackets cluster id was shown. Top 10 genes were found using FindMarker function of Seruat R package. (b) Dotplot of key genes specific to endothelial cells (EC- MYH11+ACTA2+), pericytes (KCNJ8+ABCC9+) and smooth muscle cells (CLDN5+VWF+) along with some other known specific markers were shown as dot plot. Color of dots represent expression of genes while size of the dot shows percentage of cells genes expressed. Heatmap and Dotplot are plotted using Seurat R package.
Extended Data Fig. 8
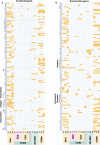
Extended Data Fig. 8. Enriched Ligands and Receptor in NVU and Immune cell clusters.
Enriched Ligand (a) and Enriched Receptors (b) in immune cells and NVU cells clusters were shown as tile Heatmap, where filled rectangle (yellow color) shows enrichment of ligand in clusters indicated on x-axis. Expression of ligand/receptor in a cluster compared to all other clusters with log2fold > 1 was considered enriched.
Extended Data Fig. 9
Extended Data Fig. 9. Microglia and macrophage specific genes.
Gene expression were overload on t-SNE map to shows the expression of microglia and macrophage/DC specific cells and clusters.
Extended Data Fig. 10
Extended Data Fig. 10. Phenotype of re-clustered doublets cells.
(a) Protein expression density plot for major lineage marker proteins were visualized as overlaid density plots. Color fill shows the cluster identity. X-axis shows expression of proteins and y-axis shows cluster id. (b) Figure shows bivariate flow cytometry plots with gating strategy for doublets. Isolated immune cells from DRE brain tissue from 3 patients were stained with fluorochrome labeled antibodies and cells were analyzed using FACS ARIA IITM Flow cytometer (BD biosciences). Flow cytometry analysis and plots were created using FlowJoTM software. S1-S3 shows the doublet FlowJo gated plots for 3 samples analysed.

Comment in

References

    1. Reynolds EH. The ILAE/IBE/WHO global campaign against epilepsy: bringing epilepsy “out of the shadows”. Epilepsy Behav. 2000;1:S3–S8. - PubMed
    1. Epilepsy: Key Facts. WHOhttps://www.who.int/ (2018).
    1. Lerche H. Drug-resistant epilepsy—time to target mechanisms. Nat. Rev. Neurol. 2020;16:595–596. - PubMed
    1. Ravizza T, et al. Innate and adaptive immunity during epileptogenesis and spontaneous seizures: evidence from experimental models and human temporal lobe epilepsy. Neurobiol. Dis. 2008;29:142–160. - PubMed
    1. Auvin S, Cilio MR, Vezzani A. Current understanding and neurobiology of epileptic encephalopathies. Neurobiol. Dis. 2016;92:72–89. - PubMed

Publication types