. 2022 May 28;11(6):1078.
doi: 10.3390/antiox11061078.

Altered Mitochondrial Opa1-Related Fusion in Mouse Promotes Endothelial Cell Dysfunction and Atherosclerosis

Affiliations

Altered Mitochondrial Opa1-Related Fusion in Mouse Promotes Endothelial Cell Dysfunction and Atherosclerosis

Ahmad Chehaitly et al. Antioxidants (Basel). .

Abstract

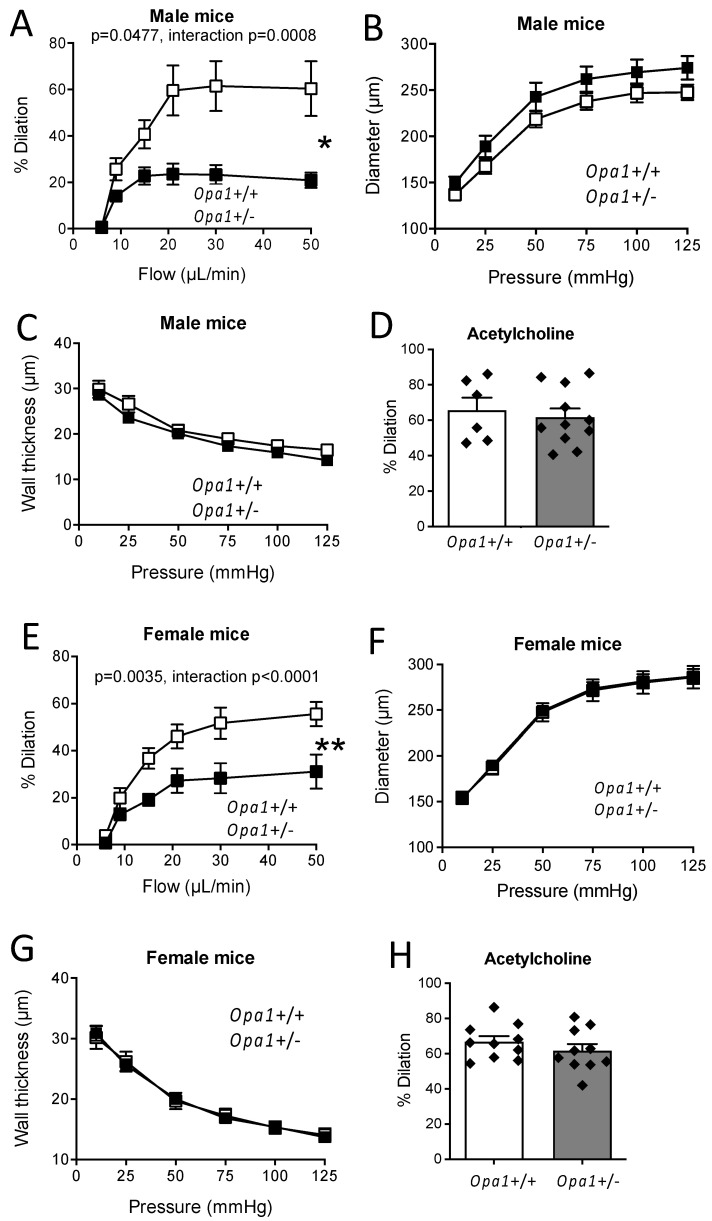
Flow (shear stress)-mediated dilation (FMD) of resistance arteries is a rapid endothelial response involved in tissue perfusion. FMD is reduced early in cardiovascular diseases, generating a major risk factor for atherosclerosis. As alteration of mitochondrial fusion reduces endothelial cells' (ECs) sprouting and angiogenesis, we investigated its role in ECs responses to flow. Opa1 silencing reduced ECs (HUVECs) migration and flow-mediated elongation. In isolated perfused resistance arteries, FMD was reduced in Opa1+/- mice, a model of the human disease due to Opa1 haplo-insufficiency, and in mice with an EC specific Opa1 knock-out (EC-Opa1). Reducing mitochondrial oxidative stress restored FMD in EC-Opa1 mice. In isolated perfused kidneys from EC-Opa1 mice, flow induced a greater pressure, less ATP, and more H2O2 production, compared to control mice. Opa1 expression and mitochondrial length were reduced in ECs submitted in vitro to disturbed flow and in vivo in the atheroprone zone of the mouse aortic cross. Aortic lipid deposition was greater in Ldlr-/--Opa1+/- and in Ldlr-/--EC-Opa1 mice than in control mice fed with a high-fat diet. In conclusion, we found that reduction in mitochondrial fusion in mouse ECs altered the dilator response to shear stress due to excessive superoxide production and induced greater atherosclerosis development.

Keywords: arteries; atherosclerosis; blood flow; endothelial cell; mitochondrial fusion; shear stress.


Conflict of interest statement

The authors declare no conflict of interest.

Figures

Figure 1
Figure 1
EC migration and flow-mediated EC alignment and elongation. Endothelial cells (HUVECs) were transfected for 72 h with the control scrambled siRNA (siCONT, A,B) or siOPA1 (C,D) and seeded in Ibidi® μ-slides attachment (Ibidi, Munich, Germany). Cells were allowed to migrate, and imaged at different time points. Data are expressed as the area occupied by cells after each time point (E). Means ± SEM are shown (n = 3 independent experiments per group). Endothelial cell alignment (FJ) was determined after exposure to laminar flow (laminar shear stress, LSS, 20 dyn/cm2, 3 days, F,G), compared to static conditions (H,I). Quantification of cells’ orientation are shown in panel J. The cell elongation factor (M) was determined as the cell length (K) along flow direction divided by cell width (L). Means ± SEM are shown (n = 5 siOPA1 or 6 siCONT independent experiments per group for alignment and elongation measurements). Two-way ANOVA for repeated measurements (E,J): Panel E: * p = 0.0214 (interaction: p = 0.0001). Panel J: cell alignment (static versus flow in siCONT and siOpa1 cells). Panel J: NS, siCONT static versus siOpa1 static and siCONT flow versus siOpa1 flow. ** p = 0.0043, two-tailed Mann–Whitney test, panels K, L and M.
Figure 2
Figure 2
Protein expression measurements in endothelial cells submitted to laminar flow. (AH) Protein expression levels of OPA1, eNOS, KLF2, PFKFB3, SOD2, SOD1, gp91phox, and p22phox were determined in HUVECs submitted to laminar flow using bidi µ-slides for 24h after OPA1 silencing (siOPA1) compared to the control scrambled siRNA (siCONT). Means ± SEM are shown (n = 6 independent experiments per group). Whole blots are shown in Figures S3 and S4. Two-tailed Mann–Whitney tests, * p > 0.05, ** p < 0.01 (p-values are shown on the graphs when p < 0.05).
Figure 3
Figure 3
Effect of Opa1 haploinsufficiency on flow-mediated dilation. Flow-mediated dilation was measured in mesenteric resistance arteries isolated from Opa1+/− and Opa1+/+ male (A) and female (E) mice. In the same arteries, arterial inner diameter (B,F) and wall thickness (C,G) were measured in response to stepwise increases in pressure. (D,H): Acetylcholine (1 µM)-mediated dilation. Means ± SEM are shown (n = 6 male EC-WT, 11 male EC-Opa1, 10 female EC-WT and 10 EC-Opa1 mice). Two-way ANOVA for repeated measurements (AC,EG). NS, two-tailed Mann–Whitney test, (D,H).
Figure 4
Figure 4
Consequence of Opa1 deficiency in endothelial cells on flow-mediated dilation. Vascular reactivity and structure were measured in mesenteric resistance arteries isolated from EC-WT and EC-Opa1 male (AG,O) and female (HN) mice. FMD (A,H) was determined in response to stepwise increases in flow in the presence or absence of the NO synthesis blocker L-NNA 100 µM, 30 min). In the same arteries, arterial inner diameter (B,I) and wall thickness (C,J) were measured in response to stepwise increases in pressure. D,K: Acetylcholine (1 µM)-mediated dilation. E,L: sodium nitroprusside (SNP, 10 µM)-mediated dilation. F,M: Phenylephrine (1 µM)-mediated contraction. G,N: KCl (80 mM)-mediated contraction. In a separate series of experiments, the effect of the Opa1 inhibitor MYSL22 (1 µM, 30 min) was tested on FMD (O). Panel P: Validation of Opa1 extinction in mesenteric resistance arteries endothelial cells (EC) from EC-Opa1 mice compared to smooth muscle cells (SMC) isolated from the same arteries. As a control for the identity of EC, eNOS protein expression was also measured together with GAPDH as a loading marker (P). Full blots are shown in Figures S5 and S6. Means ± SEM are shown (n = 8 male EC-WT, 5 male EC-Opa1, 8 female EC-WT and 5 EC-Opa1 mice in panels A to N and n = 4 male EC-WT with MYSL22 and 5 male EC-WT with solvent or control in panel O). Two-way ANOVA for repeated measurements: Panel A: * EC-Opa1 vs EC-WT: p = 0.0213, interaction p = 0.0045, **** LNNA in EC-WT: p < 0.0001, interaction p < 0.0001; * LNNA in EC-Opa1: p = 0.0198, interaction p = 0.0065. Panel H: *** EC-Opa1 vs EC-WT p = 0.00006, interaction p < 0.0001; *** LNNA in EC-WT: p = 0.0007, interaction p < 0.0001; ** LNNA in EC-Opa1: p = 0.0028, interaction p < 0.0001. Panel O: * p = 0.0221, interaction p = 0.0228. NS: Two-way ANOVA for repeated measurements (B,C,I,J). NS, two-tailed Mann–Whitney test, panels DG and KN.
Figure 5
Figure 5
Consequence of reducing oxidative stress on flow-mediated dilation. Flow-mediated dilation was measured in mesenteric resistance arteries isolated from EC-WT and EC-Opa1 male and female mice after a treatment with SOD (120 U/mL, 30 min) plus catalase (80 U/mL, min) (A,B), MitoTempo (1 µmol/L, 30 min, 5 C,D), or tetrahydrobiopterin (BH4, 10 µmol/L, 30 min) plus L-arginine (L-Arg, 100 µmol/L, 30 min) (E,F). Means ± SEM are shown (n = 5 mice per group). NS: Two-way ANOVA for repeated measurements.
Figure 6
Figure 6
Consequences of Opa1 deficiency in endothelial cells on the kidney perfusion pressure and on kidney ATP and H2O2 production. In isolated and perfused kidneys (A), the flow-pressure relationship was determined in mice lacking Opa1 in endothelial cells (EC-Opa1 male, B, and female mice, C) and in littermate wild-type mice (EC-WT). The level of ATP (D,E) and H2O2 (F,G) was quantified in the perfusate collected from the perfused kidneys under a flow rate of 600 µL/min. H: mice body weight, I: ratio kidney/body weight, J: Acetylcholine (1 µM)-mediated dilation, and K: Phenylephrine (1 µM)-mediated contraction. Means ± the SEM are shown (n = 6 EC-WT and 7 EC-Opa1 male mice and n = 6 EC-WT and 5 EC-Opa1 female mice).* p >0.05, ** p < 0.01, two-way ANOVA for repeated measurements (panels BC). * p > 0.05, ** p < 0.01, two-tailed Mann–Whitney test (panels DG). NS: Kruskal–Wallis test, EC-WT versus EC-Opa1 (panels HK).
Figure 7
Figure 7
Disturbed flow and mitochondrial dynamics. Drp1 (Dnm1l) and Opa1 (Opa1) expression levels were determined in the lesser curvature (LC) and in the greater curvature (GC) of the mouse aortic cross. Mice were fed normal (A,B) or Western diet (C,D). In a separate series of experiments (EJ), mitochondrial shape was analyzed in the LC (E) and in the GC (F) and the number (Nb) of mitochondria (G), the % of mitochondria per cell (H), the mitochondria fission count (I) and the mean branch length (J) were determined. Finally, MS1 cells were submitted to laminar (KN) or disturbed flow (OR) using an orbital shaker and circular flow. After 72 h cells were collected for the measurement of eNOS (Nos3), endothelin-1 (Edn1), Opa1 (Opa1), and Drp1 (Dnm1l) expression levels. Means ± SEM are shown (AJ: n = 4 to 6 mice per group; KR: n = 3 to 6 independent experiments). * p < 0.05 and ** p < 0.01, two-tailed Mann–Whitney test.
Figure 8
Figure 8
Consequence of Opa1 deficiency in endothelial cells on plaque formation. Opa1+/+ and Opa1+/ mice that were three months old were fed with an atherogenic diet (Western diet) and compared to Opa1+/+ and Opa1+/− mice fed with a standard diet. After 4 months the aorta was collected from the sinus to the iliac bifurcation and stained with Oil red-O. Lipid deposition was quantified in the aortic cross, (A), in the descending aorta (B) and in the aortic sinus (C). Bodyweight (D), plasma cholesterol (E), triglycerides (F), and glycemia (G) were measured in each group of mice. Means ± SEM are shown (n = 11 Opa1+/− and 8 Opa1+/+ mice per group). ** p = 0.0039 (A); **** p < 0.0001 (B) and NS (CG), Two-tailed Mann–Whitney test.
Figure 9
Figure 9
Consequence of Opa1 deficiency in endothelial cells on plaque formation. EC-Opa1 and EC-WT male mice that were three months old were fed with an atherogenic diet (Western diet) and compared EC-Opa1 and EC-WT mice fed with a standard diet. After 4 months the aorta was collected from the sinus to the iliac bifurcation and stained with Oil red-O. Lipid deposition was quantified in the aortic cross, (A), in the descending aorta (B) and in the aortic sinus (C). Bodyweight (D), plasma cholesterol (E), triglycerides (F), and glycemia (G) were measured in each group of mice. Means ± SEM are shown (9 EC-Opa1 and 8 EC-WT mice per group were used). ** p = 0.0082 (A); **** p < 0.0001 (B) and NS (BG), Two-tailed Mann–Whitney test.

References

    1. Struijker-Boudier H.A., Rosei A.E., Bruneval P., Camici P.G., Christ F., Henrion D., Lévy B.I., Pries A., Vanoverschelde J.-L. Evaluation of the microcirculation in hypertension and cardiovascular disease. Eur. Heart J. 2007;28:2834–2840. doi: 10.1093/eurheartj/ehm448. - DOI - PubMed
    1. Segal S.S. Regulation of blood flow in the microcirculation. Microcirculation. 2005;12:33–45. doi: 10.1080/10739680590895028. - DOI - PubMed
    1. Zhou J., Li Y.-S., Chien S. Shear Stress–Initiated Signaling and Its Regulation of Endothelial Function. Arter. Thromb. Vasc. Biol. 2014;34:2191–2198. doi: 10.1161/ATVBAHA.114.303422. - DOI - PMC - PubMed
    1. Deanfield J.E., Halcox J.P., Rabelink T.J. Endothelial function and dysfunction: Testing and clinical relevance. Circulation. 2007;115:1285–1295. doi: 10.1161/CIRCULATIONAHA.106.652859. - DOI - PubMed
    1. Naiberg M.R., Newton D.F., Goldstein B.I. Flow-mediated dilation and neurocognition: Systematic review and future directions. Psychosom. Med. 2016;78:192–207. doi: 10.1097/PSY.0000000000000266. - DOI - PubMed