. 2022 Jun 10;11(6):1147.
doi: 10.3390/antiox11061147.

Adipocyte-Specific Expression of PGC1α Promotes Adipocyte Browning and Alleviates Obesity-Induced Metabolic Dysfunction in an HO-1-Dependent Fashion

Affiliations

Adipocyte-Specific Expression of PGC1α Promotes Adipocyte Browning and Alleviates Obesity-Induced Metabolic Dysfunction in an HO-1-Dependent Fashion

Shin-Hsueh Shen et al. Antioxidants (Basel). .

Abstract

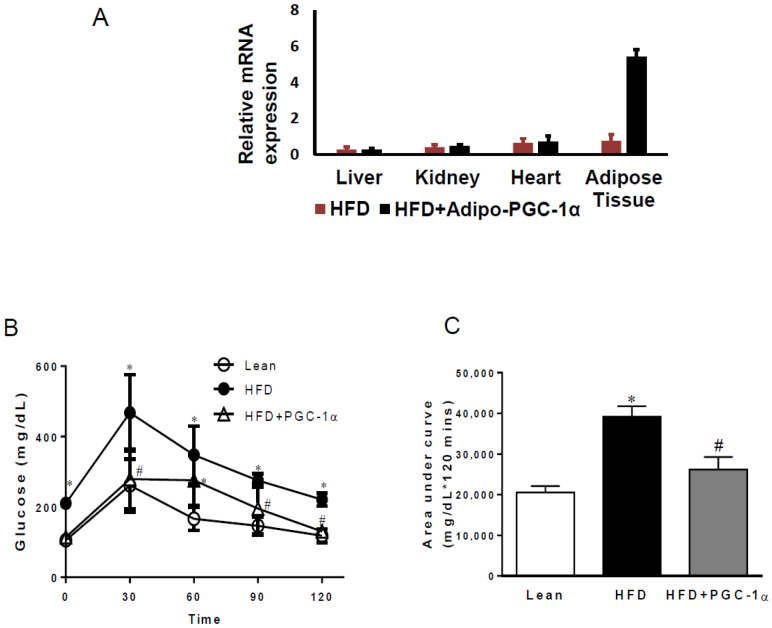
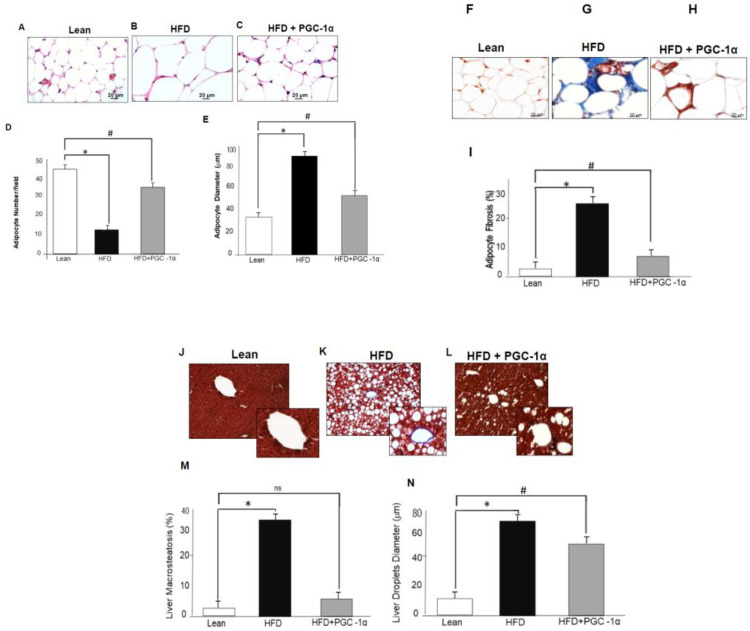
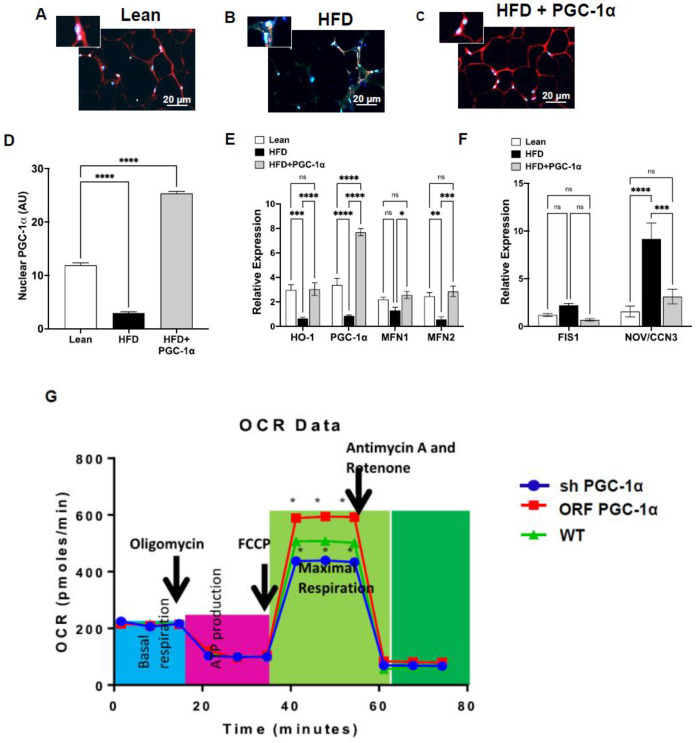
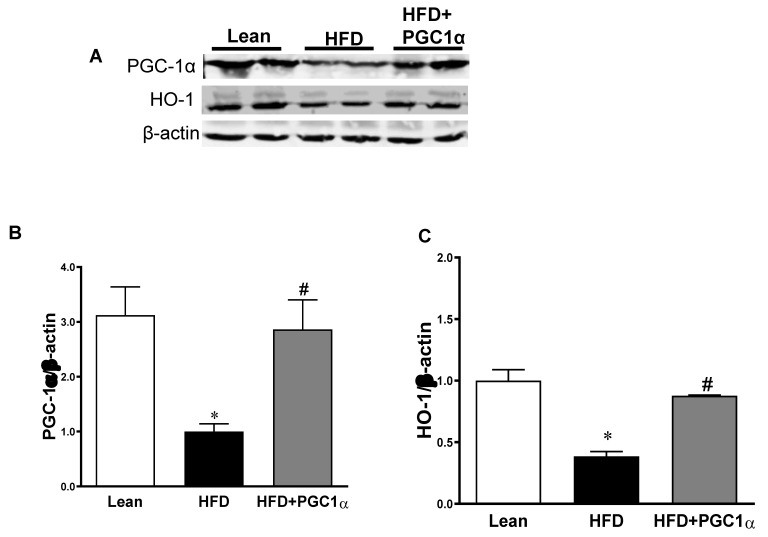
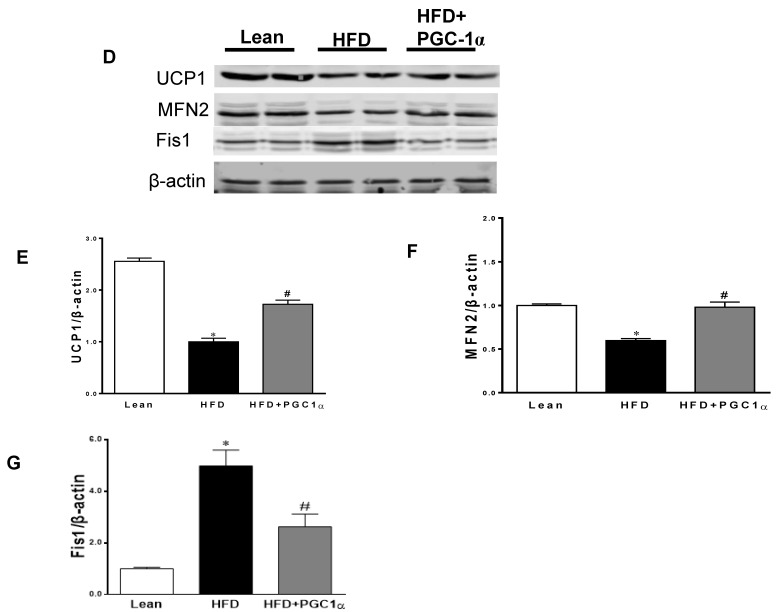
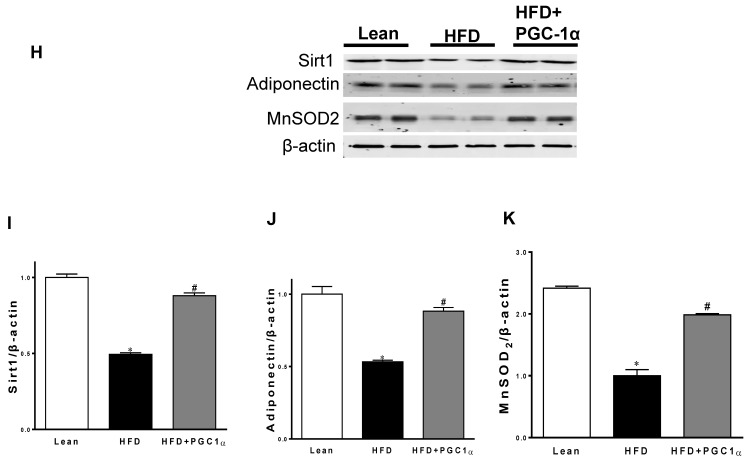
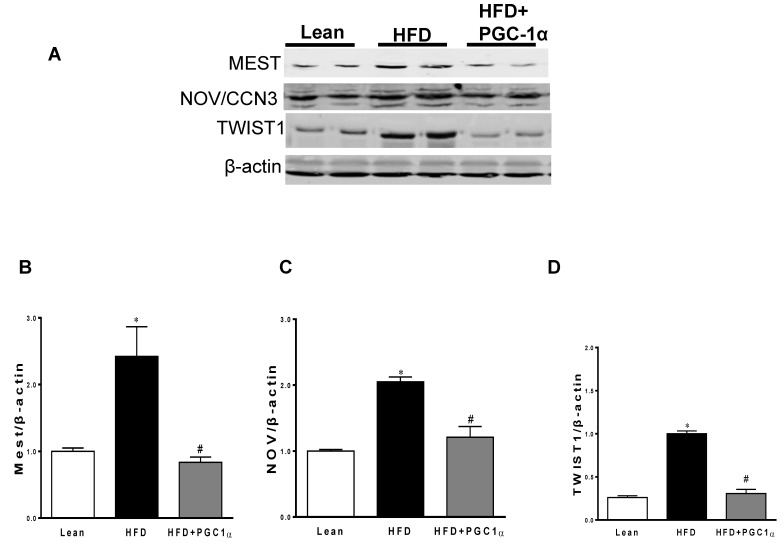
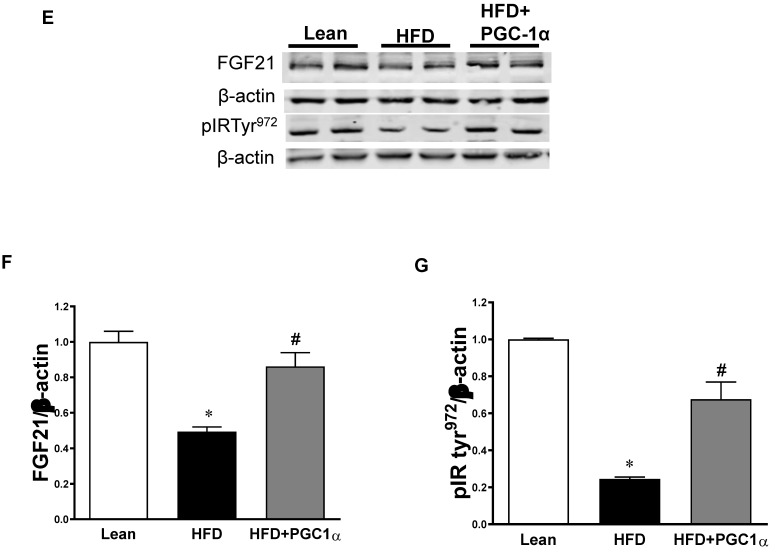
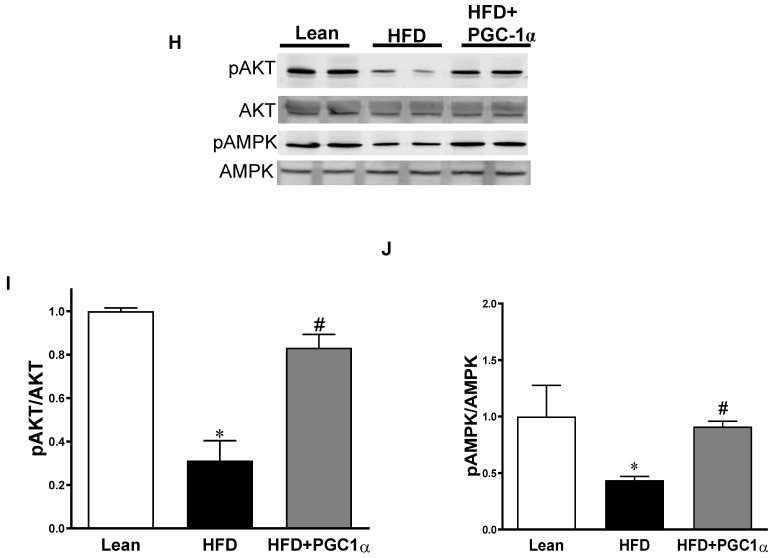
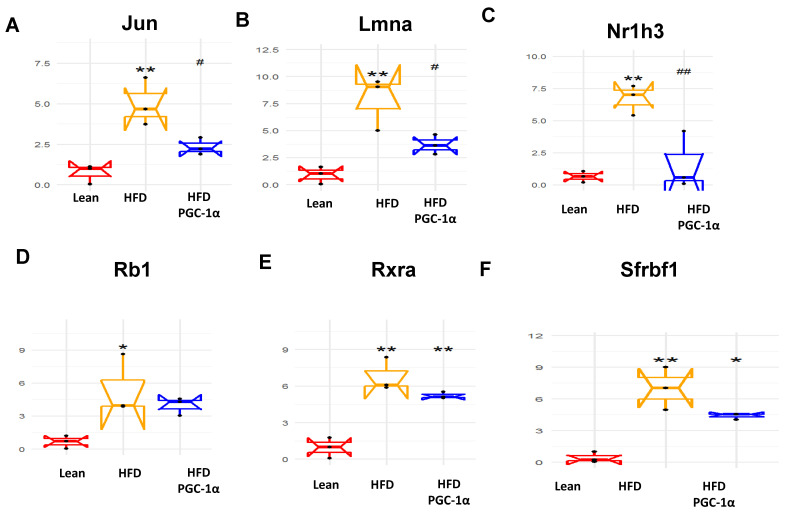
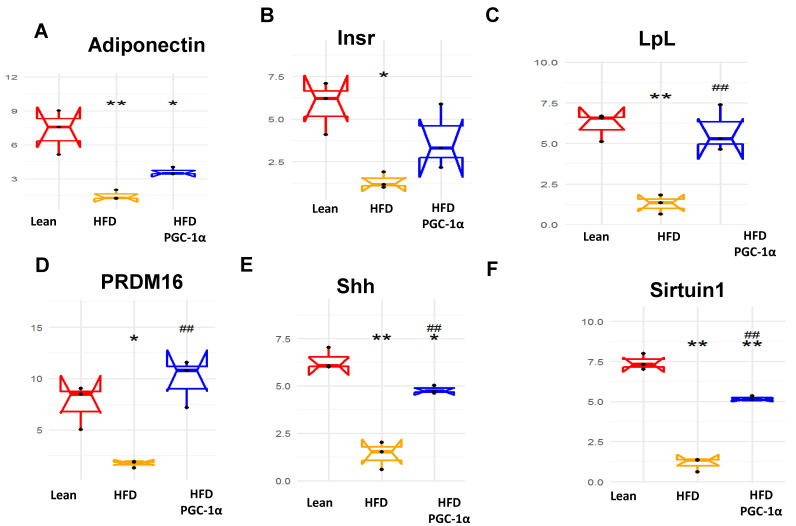
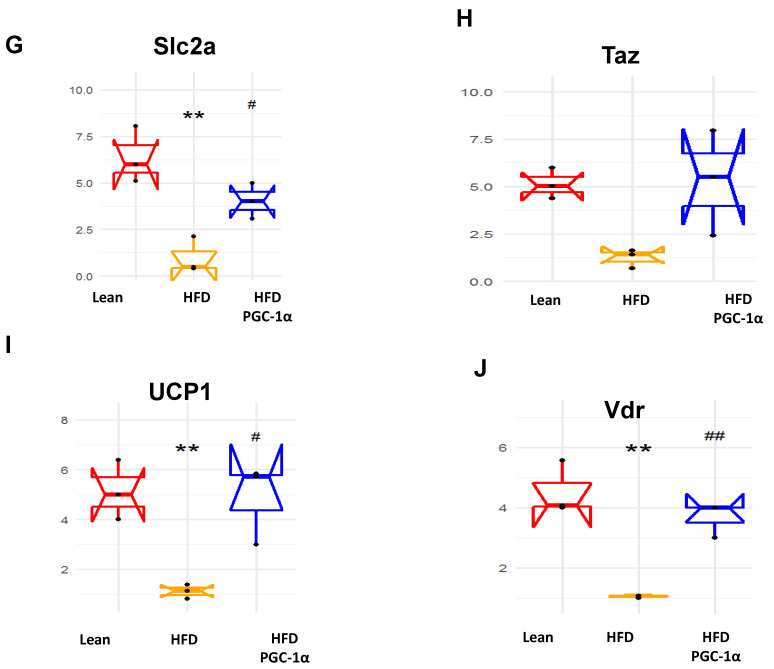
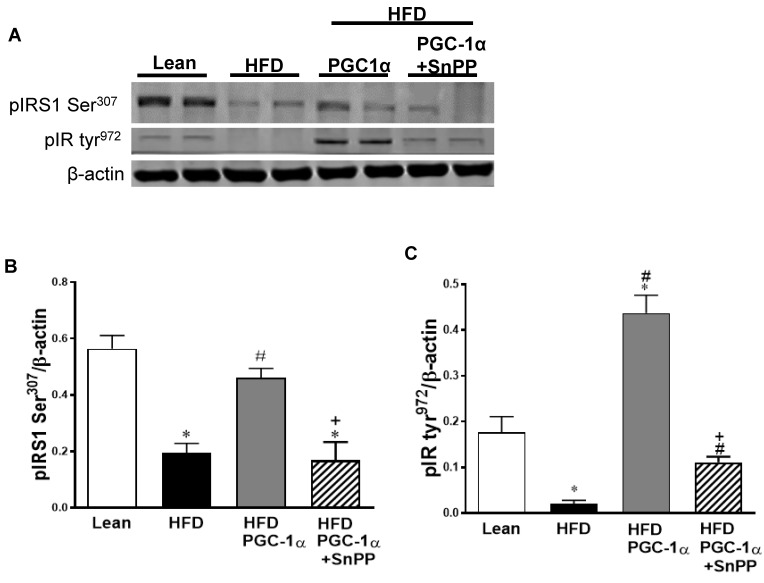
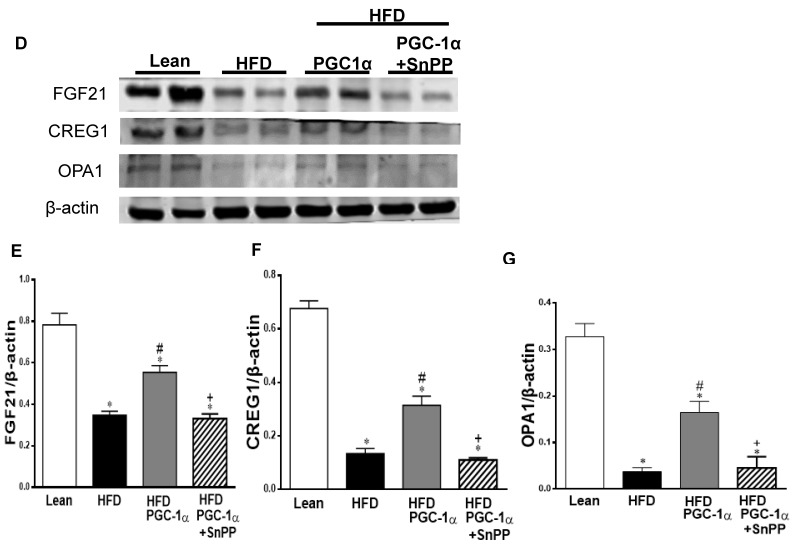
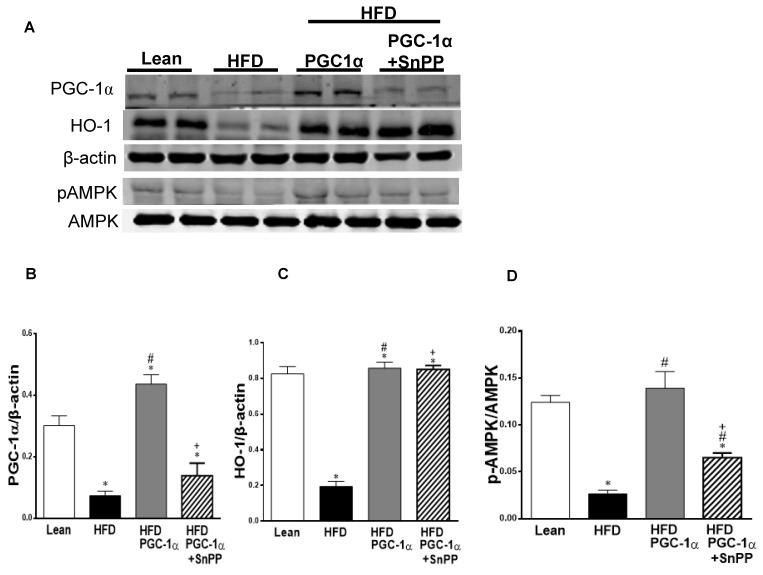
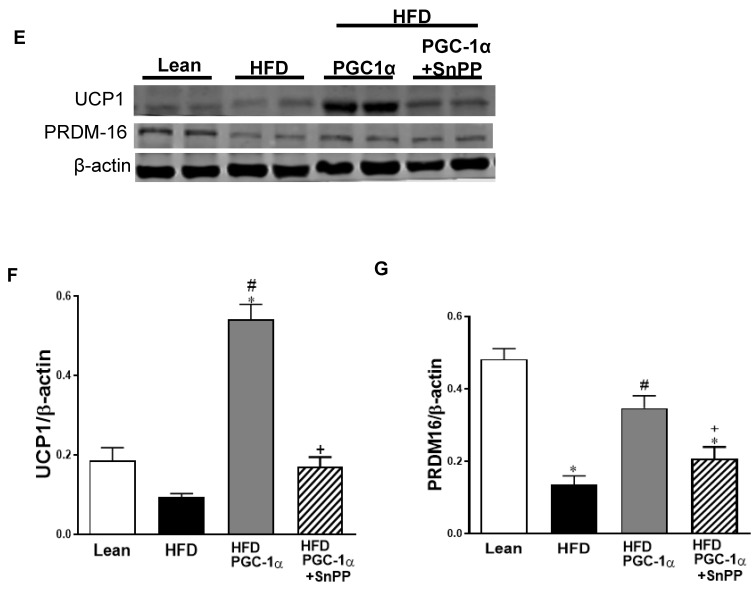
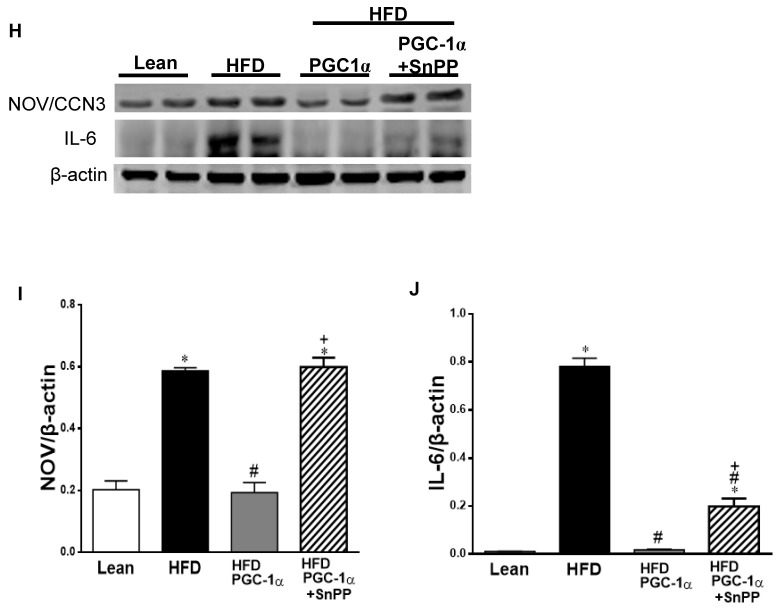
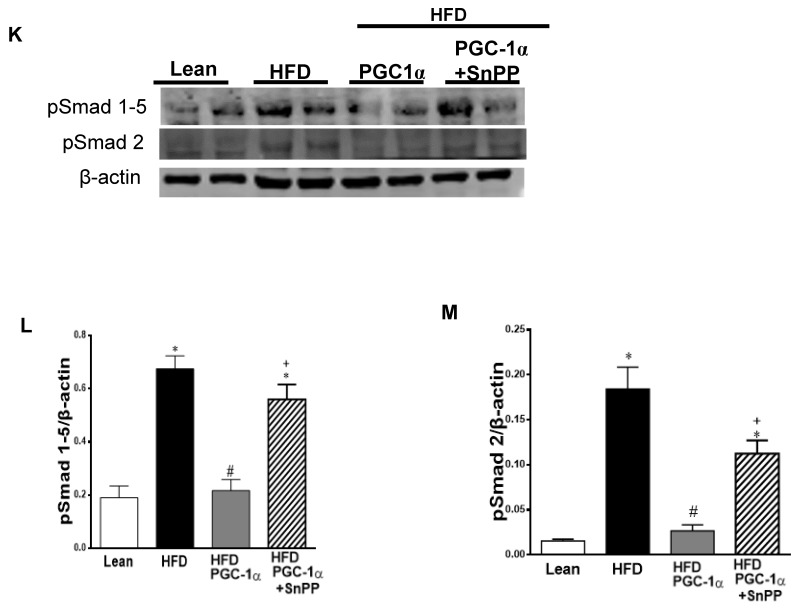
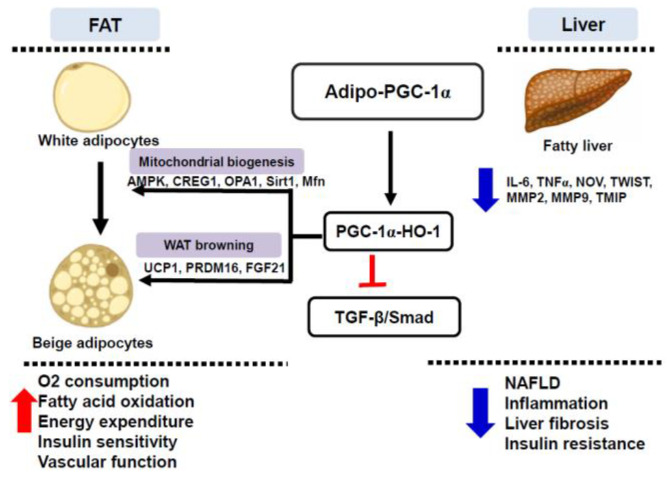
Recent studies suggest that PGC1-α plays a crucial role in mitochondrial and vascular function, yet the physiological significance of PGC1α and HO expression in adipose tissues in the context of obesity-linked vascular dysfunction remains unclear. We studied three groups of six-week-old C57BL/6J male mice: (1) mice fed a normal chow diet; (2) mice fed a high-fat diet (H.F.D.) for 28 weeks, and (3) mice fed a high-fat diet (H.F.D.) for 28 weeks, treated with adipose-specific overexpression of PGC-1α (transgenic-adipocyte-PGC-1α) at week 20, and continued on H.F.D. for weeks 20-28. R.N.A. arrays examined 88 genes involved in adipocyte proliferation and maturation. Blood pressure, tissue fibrosis, fasting glucose, and oxygen consumption were measured, as well as liver steatosis, and the expression levels of metabolic and mitochondrial markers. Obese mice exhibited a marked reduction of PGC1α and developed adipocyte hypertrophy, fibrosis, hepatic steatosis, and decreased mitochondrial respiration. Mice with adipose-specific overexpression of PGC1-α exhibited improvement in HO-1, mitochondrial biogenesis and respiration, with a decrease in fasting glucose, reduced blood pressure and fibrosis, and increased oxygen consumption. PGC-1α led to the upregulated expression of processes associated with the browning of fat tissue, including UCP1, FGF21, and pAMPK signaling, with a reduction in inflammatory adipokines, NOV/CCN3 expression, and TGFβ. These changes required HO-1 expression. The R.N.A. array analysis identified subgroups of genes positively correlated with contributions to the browning of adipose tissue, all dependent on HO-1. Our observations reveal a positive impact of adipose-PGC1-α on distal organ systems, with beneficial effects on HO-1 levels, reversing obesity-linked cardiometabolic disturbances.

Keywords: PGC-1α; brown fat; inflammation; mitochondria; obesity; type 2 diabetes.


Conflict of interest statement

The authors declare that they have no conflict of interest.

Figures

Figure 1
Figure 1
Effects of the adipocyte-specific overexpression of PGC-1α in high-fat-diet (HFD.)-fed mice. (A) Tissue expression levels of adipo-PGC1α; (B) glucose tolerance test; and (C) area under curve; (data are expressed as mean ± SEM (n = 5); * p < 0.05 versus lean; # p < 0.05 vs.HFD.
Figure 2
Figure 2
Effects of adipocyte-specific overexpression of PGC-1α in high-fat-diet (HFD)-fed mice compared to lean and untreated HFD mice. Histological analysis of adipose tissue using Hematoxylin–Eosin of (A) lean, (B) HFD, and (C) HFD+ PGC-1α mice; (D) Adipocyte number and (E) adipocyte diameter. Masson trichrome staining photomicrographs of PGC-1α expression at the adipose tissue level of (F) lean, (G) HFD, and (H) HFD + PGC-1α mice; (I) Percentage of adipocyte fibrosis, (JM) liver macrosteatosis, and (N) liver lipid droplet diameter. Bar 20 μm. Data are expressed as mean ± S.E.M. (n = 5); * p < 0.05 versus lean; # p < 0.05 vs. HFD.
Figure 3
Figure 3
Effects of the adipocyte-specific overexpression of PGC-1α in high-fat-diet (H.F.D.)-fed mice compared to lean and untreated HFD mice. Iimmunofluorescence photomicrographs of PGC-1α expression (red staining) at the adipose tissue level of (A) lean, (B) H.F.D., and (C) HFD + PGC-1α mice. Graph (D) summarizes the immune morphometrical measurement of the nuclear localization of PGC-1α (A.U.). Quantitative gene expression analysis of (E) PGC-1α, HO-1, Mfn1, and Mfn2; (F) Fis1 and NOV/CCN3 in adipose tissue of Transgenic-adipo-PGC-1α mice fed with a high-fat diet. Data are expressed as mean ± S.E.M. (n = 5); **** p < 0.05 versus lean; *** p < 0.05 versus HFD,* p < 0.05 versus HFD. ** p < 0.05 versus lean (G) Oxygen consumption rates (OCR) in PGC-1α knockdown (shPGC1α), overexpression (ORF PGC-1α), and control cultured adipocytes, n = 3. **** p < 0.005, versus control. The maximal respiration capacity represents the sum of all physiological mitochondrial oxygen consumption.
Figure 4
Figure 4
Effects of the Transgenic-adipo-PGC-1α treatment on the key proteins involved in mitochondrial fission and biogenesis and adipocyte browning. Representative Western blot analysis of (A) PGC-1α and HO-1 (B,C), (DG) MFN2, Fis1, and UCP1, (HK) Sirt1, Adiponectin and MnSOD2 with their corresponding β-actin in the adipose tissue of lean, HFD and Transgenic-adipo-PGC-1α mice. Data are expressed as mean ± S.E.M. (n = 5); * p < 0.05 versus lean; # p < 0.05 versus HFD.
Figure 4
Figure 4
Effects of the Transgenic-adipo-PGC-1α treatment on the key proteins involved in mitochondrial fission and biogenesis and adipocyte browning. Representative Western blot analysis of (A) PGC-1α and HO-1 (B,C), (DG) MFN2, Fis1, and UCP1, (HK) Sirt1, Adiponectin and MnSOD2 with their corresponding β-actin in the adipose tissue of lean, HFD and Transgenic-adipo-PGC-1α mice. Data are expressed as mean ± S.E.M. (n = 5); * p < 0.05 versus lean; # p < 0.05 versus HFD.
Figure 5
Figure 5
Expression of inflammatory mediators and insulin signaling in the adipose tissue of lean, high-fat-diet (H.F.D.)-fed, and Transgenic-adipo-PGC-1α mice. Representative Western blot analysis of (AD) MEST, NOV/CCN3 and TWIST, (EG) FGF21 and phosphorylated insulin receptor tyrosine 972 (pIRTyr972), (HJ) pAKT and pAMPK with their corresponding A.K.T. and AMPK in the adipose tissue of lean, H.F.D., and Transgenic-adipo-PGC-1α mice. Data are expressed as mean ± S.E.M. (n = 5); * p < 0.05 vs. lean; # p < 0.05 vs. H.F.D.
Figure 5
Figure 5
Expression of inflammatory mediators and insulin signaling in the adipose tissue of lean, high-fat-diet (H.F.D.)-fed, and Transgenic-adipo-PGC-1α mice. Representative Western blot analysis of (AD) MEST, NOV/CCN3 and TWIST, (EG) FGF21 and phosphorylated insulin receptor tyrosine 972 (pIRTyr972), (HJ) pAKT and pAMPK with their corresponding A.K.T. and AMPK in the adipose tissue of lean, H.F.D., and Transgenic-adipo-PGC-1α mice. Data are expressed as mean ± S.E.M. (n = 5); * p < 0.05 vs. lean; # p < 0.05 vs. H.F.D.
Figure 6
Figure 6
The mRNA expression of (A) Jun proto-oncogene (Jun), (B) lamin A (Lmna), (C) nuclear receptor subfamily 1 group H member 3 (Nr1h3), (D) R.B. transcriptional corepressor 1 (Rb1), (E) retinoid X receptor alpha (Rxra), and (F) secreted frizzled-related protein 1 (Sfrbf1) in the adipose tissue of lean, high-fat-diet (H.F.D.)-fed and Transgenic-adipo-PGC-1α mice. Data are expressed as mean ± S.E.M. (n = 5); * p < 0.05, ** p < 0.005 vs. lean; # p < 0.05, ## p < 0.005 vs. HFD.
Figure 7
Figure 7
The mRNA expression of (A) adiponectin, (B) insulin receptor precursor (Insr), (C) lipoprotein lipase (Lpl), (D) Prdm16, (E) Sonic hedgehog (Shh), (F) silent mating-type information regulation 2 homolog (Situin1), (G) solute carrier family 2 member 4 (Slc2), (H) Tafazzin (Taz), (I) Uncoupling protein 1 (UCP1), and (J) vitamin D receptor (Vdr) in the adipose tissue of lean, high-fat-diet (H.F.D.)-fed and Transgenic-adipo-PGC-1α mice. Data are expressed as mean ± S.E.M. (n = 5); * p < 0.05, ** p < 0.005 vs. lean; # p < 0.05, ## p < 0.005 vs. HFD.
Figure 7
Figure 7
The mRNA expression of (A) adiponectin, (B) insulin receptor precursor (Insr), (C) lipoprotein lipase (Lpl), (D) Prdm16, (E) Sonic hedgehog (Shh), (F) silent mating-type information regulation 2 homolog (Situin1), (G) solute carrier family 2 member 4 (Slc2), (H) Tafazzin (Taz), (I) Uncoupling protein 1 (UCP1), and (J) vitamin D receptor (Vdr) in the adipose tissue of lean, high-fat-diet (H.F.D.)-fed and Transgenic-adipo-PGC-1α mice. Data are expressed as mean ± S.E.M. (n = 5); * p < 0.05, ** p < 0.005 vs. lean; # p < 0.05, ## p < 0.005 vs. HFD.
Figure 8
Figure 8
Effects of SnPP treatment on insulin-receptor phosphorylation and mitochondrial fission in the adipose tissue of Transgenic-adipo-PGC-1α mice fed with high-fat diet (H.F.D.). Representative Western blots of (A) phosphorylated insulin-receptor substrate 1 serine307 (pIRS1 ser307) and phosphorylated insulin-receptor tyrosine972 (pIR Tyr972) with the corresponding quantitation to β-actin (B,C). (D) Representative Western blots of FGF21, CREG1, and OPA1 with the corresponding quantitation to β-actin (EG). Data are expressed as mean ± S.E.M. (n = 5); * p < 0.05 versus lean; # p < 0.05 versus H.F.D.; + p < 0.05 vs. PGC-1α.
Figure 8
Figure 8
Effects of SnPP treatment on insulin-receptor phosphorylation and mitochondrial fission in the adipose tissue of Transgenic-adipo-PGC-1α mice fed with high-fat diet (H.F.D.). Representative Western blots of (A) phosphorylated insulin-receptor substrate 1 serine307 (pIRS1 ser307) and phosphorylated insulin-receptor tyrosine972 (pIR Tyr972) with the corresponding quantitation to β-actin (B,C). (D) Representative Western blots of FGF21, CREG1, and OPA1 with the corresponding quantitation to β-actin (EG). Data are expressed as mean ± S.E.M. (n = 5); * p < 0.05 versus lean; # p < 0.05 versus H.F.D.; + p < 0.05 vs. PGC-1α.
Figure 9
Figure 9
Effects of SnPP treatment on browning markers and AMPK phosphorylation in the adipose tissue of Transgenic-adipo-PGC-1α mice fed with a high-fat diet. Representative Western blots of (A) PGC-1α, HO-1, pAMPK, and AMPK with the corresponding quantitation to β-actin (BD). (EG) UCP1 and PRDM16. Data are expressed as mean ± S.E.M. (n = 5); * p < 0.05 vs. lean; # p < 0.05 versus H.F.D.; + p < 0.05 vs. PGC-1α. Effects of SnPP treatment on inflammatory mediators and transforming growth factor β (TGF-β) signaling (pSmad 1–5 and pSmad 2) in the adipose tissue of Transgenic-adipo-PGC-1α mice fed with a high-fat diet. Representative Western blots of (HJ) NOV/CCN3 (H) and IL-6 (J) with the corresponding quantitation to β-actin; Representative Western blots of pSmad 1–5 and pSmad2 with the corresponding quantitation to β-actin (9; KM); and phosphorylation of pP38 MAPK (9N) with the corresponding quantitation to pP38 MAPK. Data are expressed as mean ± S.E.M. (n = 5); * p < 0.05 versus lean; # p < 0.05 versus H.F.D.; + p < 0.05 versus PGC-1α.
Figure 9
Figure 9
Effects of SnPP treatment on browning markers and AMPK phosphorylation in the adipose tissue of Transgenic-adipo-PGC-1α mice fed with a high-fat diet. Representative Western blots of (A) PGC-1α, HO-1, pAMPK, and AMPK with the corresponding quantitation to β-actin (BD). (EG) UCP1 and PRDM16. Data are expressed as mean ± S.E.M. (n = 5); * p < 0.05 vs. lean; # p < 0.05 versus H.F.D.; + p < 0.05 vs. PGC-1α. Effects of SnPP treatment on inflammatory mediators and transforming growth factor β (TGF-β) signaling (pSmad 1–5 and pSmad 2) in the adipose tissue of Transgenic-adipo-PGC-1α mice fed with a high-fat diet. Representative Western blots of (HJ) NOV/CCN3 (H) and IL-6 (J) with the corresponding quantitation to β-actin; Representative Western blots of pSmad 1–5 and pSmad2 with the corresponding quantitation to β-actin (9; KM); and phosphorylation of pP38 MAPK (9N) with the corresponding quantitation to pP38 MAPK. Data are expressed as mean ± S.E.M. (n = 5); * p < 0.05 versus lean; # p < 0.05 versus H.F.D.; + p < 0.05 versus PGC-1α.
Figure 10
Figure 10
Schematic depiction of the postulated hypothesis showing that adipocyte-specific PGC-1α expression coordinates HO-1 to induce the conversion of white adipocytes to the beige phenotype, and improves mitochondrial biogenesis/fusion, energy expenditure, and insulin sensitivity as well as vascular function. Adipo-PGC-1α inhibits TGF-β/Smad signaling (pSmad 1–5, Smad 2 and P38MAPK) and inflammatory adipokines (NOV/CCN3 and IL-6). Selective expression of adipocyte PGC-1α provides a genetic approach for obesity, fatty liver, and associated metabolic syndrome management.

Similar articles

Cited by

References

    1. Mitchell S., Shaw D. The worldwide epidemic of female obesity. Best Pract. Research. Clin. Obstet. Gynaecol. 2015;29:289–299. doi: 10.1016/j.bpobgyn.2014.10.002. - DOI - PubMed
    1. Ladhani M., Craig J.C., Irving M., Clayton P.A., Wong G. Obesity and the risk of cardiovascular and all-cause mortality in chronic kidney disease: A systematic review and meta-analysis. Nephrol. Dial. Transplant. Off. Publ. Eur. Dial. Transpl. Assoc. Eur. Ren. Assoc. 2017;32:439–449. doi: 10.1093/ndt/gfw075. - DOI - PubMed
    1. Wild S., Roglic G., Green A., Sicree R., King H. Global prevalence of diabetes: Estimates for the year 2000 and projections for 2030. Diabetes Care. 2004;27:1047–1053. doi: 10.2337/diacare.27.5.1047. - DOI - PubMed
    1. Mouton A.J., Li X., Hall M.E., Hall J.E. Obesity, Hypertension, and Cardiac Dysfunction: Novel Roles of Immunometabolism in Macrophage Activation and Inflammation. Circ. Res. 2020;126:789–806. doi: 10.1161/CIRCRESAHA.119.312321. - DOI - PMC - PubMed
    1. Lee B.Y., Bartsch S.M., Mui Y., Haidari L.A., Spiker M.L., Gittelsohn J. A systems approach to obesity. Nutr. Rev. 2017;75:94–106. doi: 10.1093/nutrit/nuw049. - DOI - PMC - PubMed

LinkOut - more resources