

Biofilm Formation of Staphylococcus aureus from Pets, Livestock, and Wild Animals: Relationship with Clonal Lineages and Antimicrobial Resistance
- PMID: 35740178
- PMCID: PMC9219840
- DOI: 10.3390/antibiotics11060772
Biofilm Formation of Staphylococcus aureus from Pets, Livestock, and Wild Animals: Relationship with Clonal Lineages and Antimicrobial Resistance
Abstract
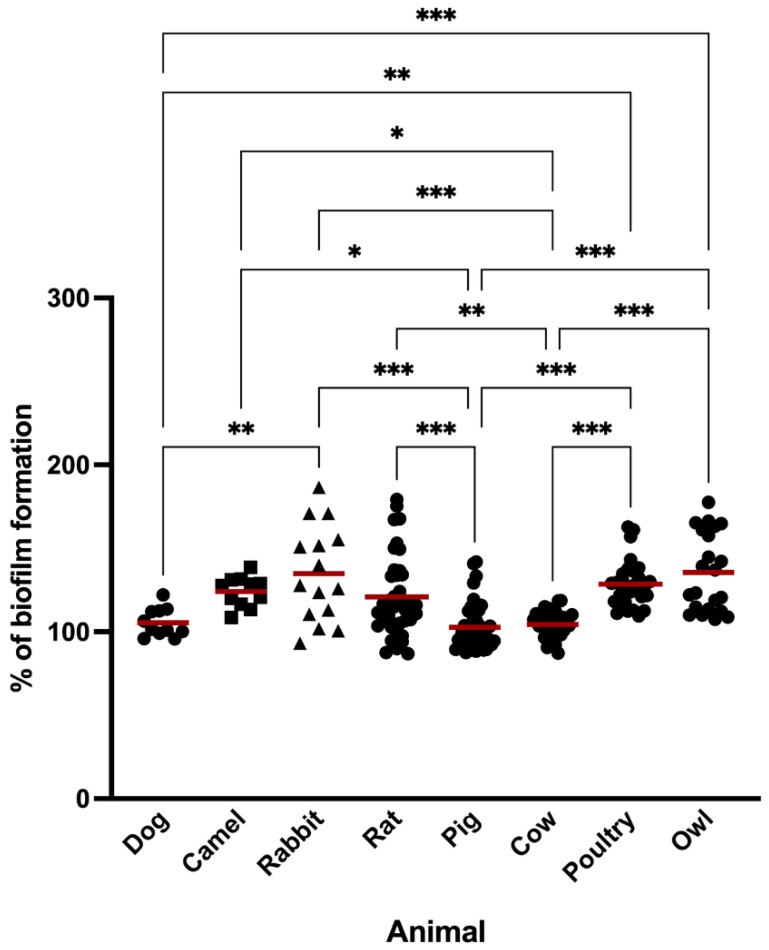
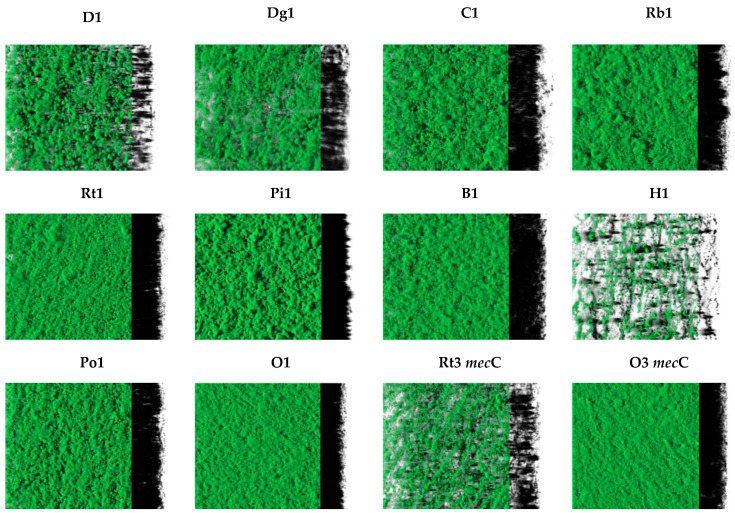
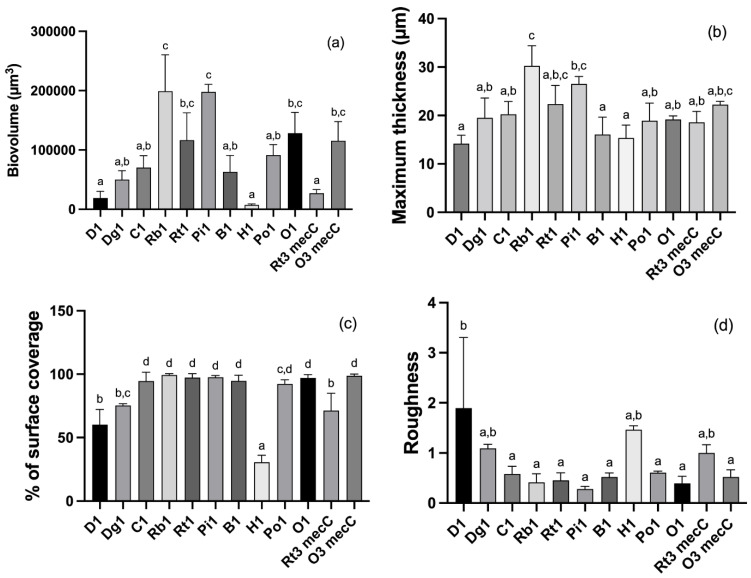
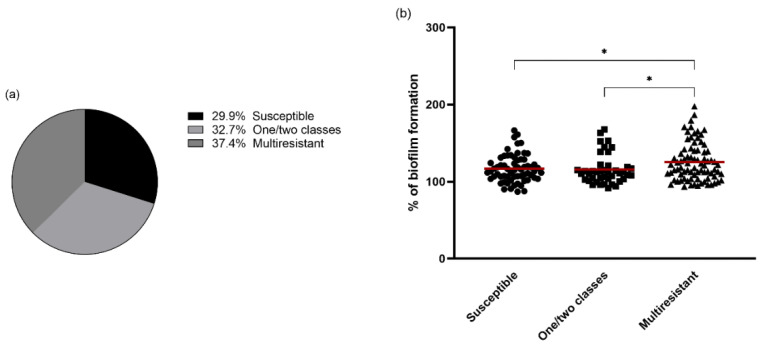
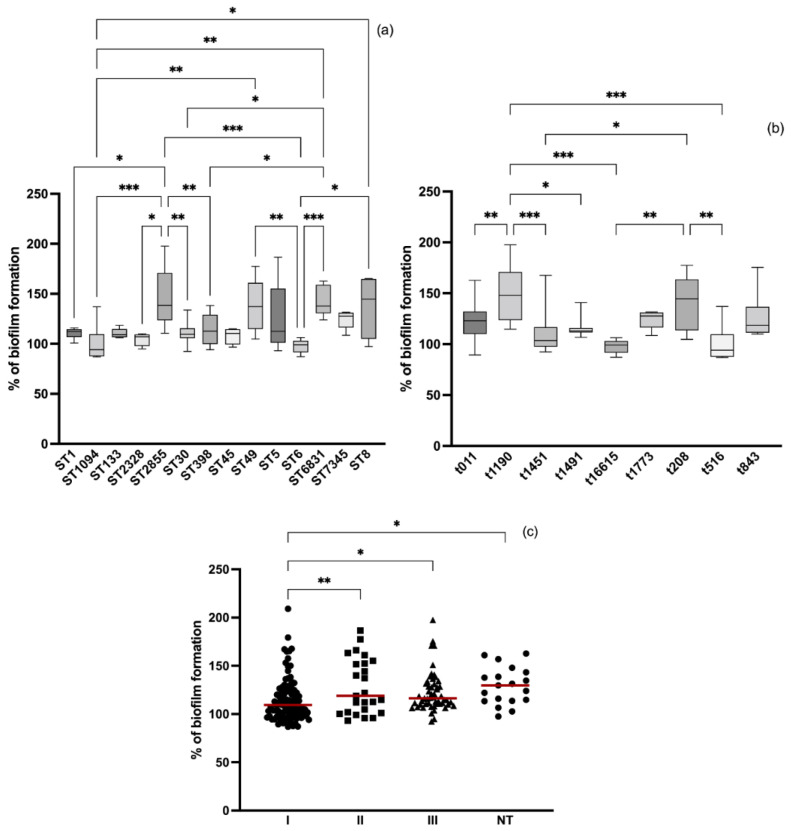
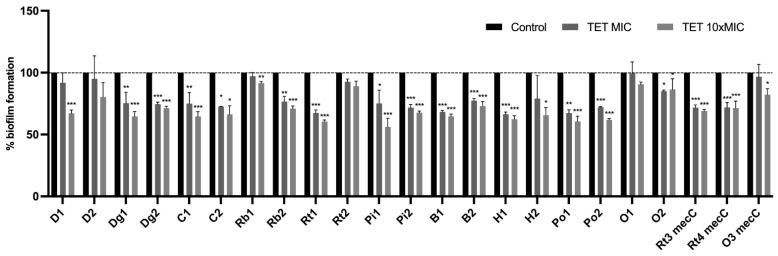
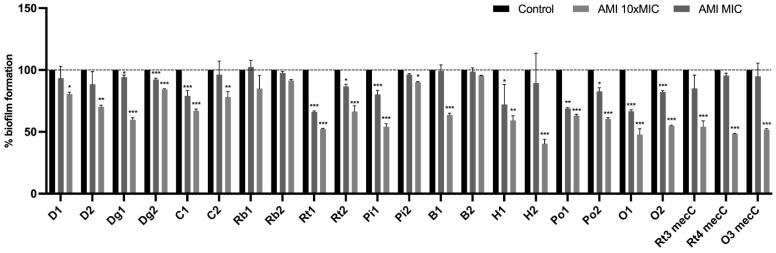
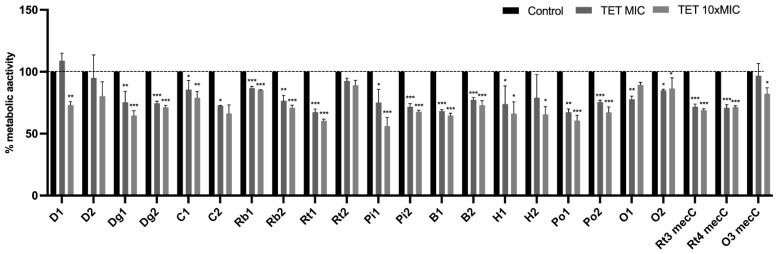
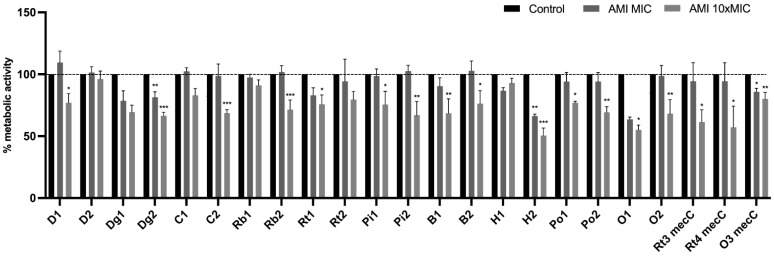
This study aimed to compare the biofilm formation ability of Staphylococcus aureus isolated from a wide range of animals and study the association between biofilm formation and antimicrobial resistance and genetic lineages. A total of 214 S. aureus strains isolated from pets, livestock, and wild animals were evaluated regarding their ability to form biofilms by the microtiter biofilm assay and their structure via confocal scanning laser microscopy. Statistical analysis was used to find an association between biofilm formation and antimicrobial resistance, multidrug resistance, sequence types (STs), spa and agr-types of the isolates. The antimicrobial susceptibility of 24 h-old biofilms was assessed against minimum inhibitory concentrations (MIC) and 10× MIC of amikacin and tetracycline, and the biomass reduction was measured. The metabolic activity of biofilms after antimicrobial treatment was evaluated by the XTT assay. All isolates were had the ability to form biofilms. Yet, significant differences in biofilm biomass production were detected among animal species. Multidrug resistance had a positive association with biofilm formation as well as methicillin-resistance. Significant differences were also detected among the clonal lineages of the isolates. Both tetracycline and amikacin were able to significantly reduce the biofilm mass. However, none of the antimicrobials were able to eradicate the biofilm at the maximum concentration used. Our results provide important information on the biofilm-forming capacity of animal-adapted S. aureus isolates, which may have potential implications for the development of new biofilm-targeted therapeutics.
Keywords: MRSA; S. aureus; animals; antimicrobial resistance; biofilms; genetic linages.
Conflict of interest statement
The authors declare no conflict of interest.
Figures
Similar articles
-
Exploring the Biofilm Formation Capacity in S. pseudintermedius and Coagulase-Negative Staphylococci Species.Pathogens. 2022 Jun 16;11(6):689. doi: 10.3390/pathogens11060689. Pathogens. 2022. PMID: 35745543 Free PMC article.
-
Genetic analysis of methicillin-susceptible Staphylococcus aureus clinical isolates: High prevalence of multidrug-resistant ST239 with strong biofilm-production ability.J Clin Lab Anal. 2020 Nov;34(11):e23494. doi: 10.1002/jcla.23494. Epub 2020 Jul 21. J Clin Lab Anal. 2020. PMID: 32696587 Free PMC article.
-
Biofilm Formation of Multidrug-Resistant MRSA Strains Isolated from Different Types of Human Infections.Pathogens. 2021 Jul 30;10(8):970. doi: 10.3390/pathogens10080970. Pathogens. 2021. PMID: 34451434 Free PMC article.
-
Correlation Between Biofilm Formation and Antibiotic Resistance in MRSA and MSSA Isolated from Clinical Samples in Iran: A Systematic Review and Meta-Analysis.Microb Drug Resist. 2020 Sep;26(9):1071-1080. doi: 10.1089/mdr.2020.0001. Epub 2020 Mar 10. Microb Drug Resist. 2020. PMID: 32159447
-
Staphylococcus aureus and biofilms: transmission, threats, and promising strategies in animal husbandry.J Anim Sci Biotechnol. 2024 Mar 13;15(1):44. doi: 10.1186/s40104-024-01007-6. J Anim Sci Biotechnol. 2024. PMID: 38475886 Free PMC article. Review.
Cited by
-
Rabbits as a Reservoir of Multidrug-Resistant Escherichia coli: Clonal Lineages and Public Health Impact.Antibiotics (Basel). 2024 Apr 20;13(4):376. doi: 10.3390/antibiotics13040376. Antibiotics (Basel). 2024. PMID: 38667052 Free PMC article.
-
Unraveling the Challenges: A Compelling Case of Staph Meningitis and Graft Infection in a Bovine Brain Graft Recipient.Cureus. 2024 Jul 18;16(7):e64806. doi: 10.7759/cureus.64806. eCollection 2024 Jul. Cureus. 2024. PMID: 39156475 Free PMC article.
-
Antimicrobial Activity, Genetic Relatedness, and Safety Assessment of Potential Probiotic Lactic Acid Bacteria Isolated from a Rearing Tank of Rotifers (Brachionus plicatilis) Used as Live Feed in Fish Larviculture.Animals (Basel). 2024 May 9;14(10):1415. doi: 10.3390/ani14101415. Animals (Basel). 2024. PMID: 38791633 Free PMC article.
-
Insights into the Virulence and Antimicrobial Resistance of Staphylococcus hyicus Isolates from Spanish Swine Farms.Antibiotics (Basel). 2024 Sep 11;13(9):871. doi: 10.3390/antibiotics13090871. Antibiotics (Basel). 2024. PMID: 39335044 Free PMC article.
-
Antioxidant and Antimicrobial Properties of Helichrysum italicum (Roth) G. Don Hydrosol.Antibiotics (Basel). 2022 Jul 28;11(8):1017. doi: 10.3390/antibiotics11081017. Antibiotics (Basel). 2022. PMID: 36009886 Free PMC article.
References
-
- Olaniyi R., Pozzi C., Grimaldi L., Bagnoli F. Staphylococcus aureus. Springer; Berlin/Heidelberg, Germany: 2016. Staphylococcus aureus-associated skin and soft tissue infections: Anatomical localization, epidemiology, therapy and potential prophylaxis; pp. 199–227. - PubMed
Grants and funding
LinkOut - more resources
Full Text Sources
