

Metabolic Profile and Pathological Alterations in the Muscle of Patients with Early-Stage Amyotrophic Lateral Sclerosis
- PMID: 35740329
- PMCID: PMC9220134
- DOI: 10.3390/biomedicines10061307
Metabolic Profile and Pathological Alterations in the Muscle of Patients with Early-Stage Amyotrophic Lateral Sclerosis
Abstract
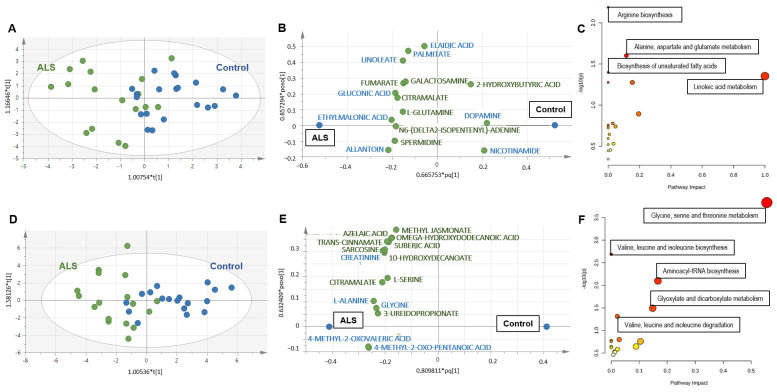
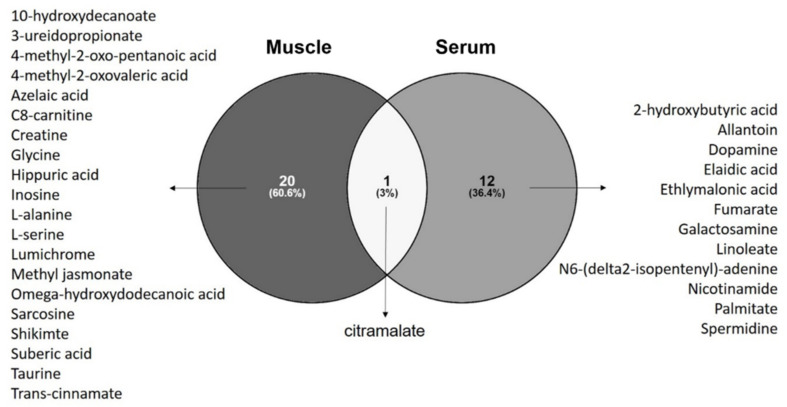
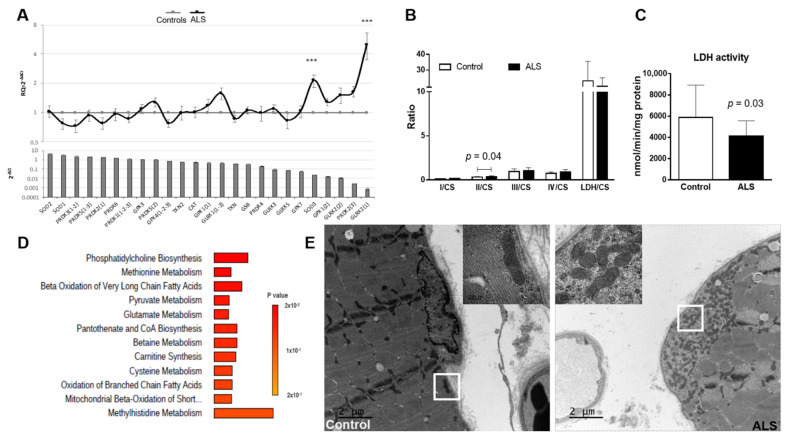
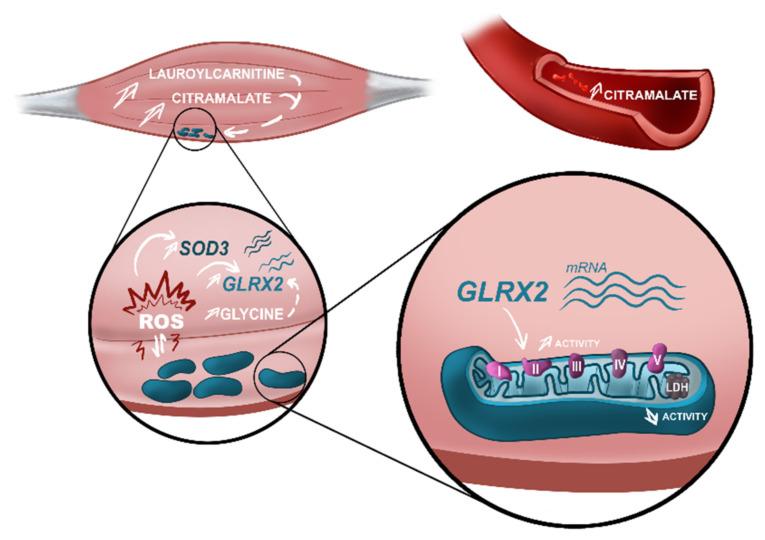
Diverse biomarkers and pathological alterations have been found in muscle of patients with Amyotrophic lateral sclerosis (ALS), but the relation between such alterations and dysfunction in energetic metabolism remains to be investigated. We established the metabolome of muscle and serum of ALS patients and correlated these findings with the clinical status and pathological alterations observed in the muscle. We obtained data from 20 controls and 17 ALS patients (disease duration: 9.4 ± 6.8 months). Multivariate metabolomics analysis identified a distinct serum metabolome for ALS compared to controls (p-CV-ANOVA < 0.035) and revealed an excellent discriminant profile for muscle metabolome (p-CV-ANOVA < 0.0012). Citramalate was discriminant for both muscle and serum. High lauroylcarnitine levels in muscle were associated with low Forced Vital Capacity. Transcriptomics analysis of key antioxidant enzymes showed an upregulation of SOD3 (p = 0.0017) and GLRX2(1) (p = 0.0022) in ALS muscle. Analysis of mitochondrial enzymatic activity in muscle revealed higher complex II/CS (p = 0.04) and lower LDH (p = 0.03) activity in ALS than in controls. Our study showed, for the first time, a global dysfunction in the muscle of early-stage ALS patients. Furthermore, we identified novel metabolites to be employed as biomarkers for diagnosis and prognosis of ALS patients.
Keywords: Amyotrophic lateral sclerosis; metabolomics; mitochondria dysfunction; muscle; transcriptomics.
Conflict of interest statement
The authors declare no conflict of interest.
Figures
Similar articles
-
Metabolomic and Proteomic Profiling of Serum-Derived Extracellular Vesicles from Early-Stage Amyotrophic Lateral Sclerosis Patients.J Mol Neurosci. 2025 Feb 15;75(1):21. doi: 10.1007/s12031-025-02315-w. J Mol Neurosci. 2025. PMID: 39954028
-
Disease-related changes in the cerebrospinal fluid metabolome in amyotrophic lateral sclerosis detected by GC/TOFMS.PLoS One. 2011 Apr 4;6(4):e17947. doi: 10.1371/journal.pone.0017947. PLoS One. 2011. PMID: 21483737 Free PMC article.
-
Metabo-lipidomics of Fibroblasts and Mitochondrial-Endoplasmic Reticulum Extracts from ALS Patients Shows Alterations in Purine, Pyrimidine, Energetic, and Phospholipid Metabolisms.Mol Neurobiol. 2019 Aug;56(8):5780-5791. doi: 10.1007/s12035-019-1484-7. Epub 2019 Jan 24. Mol Neurobiol. 2019. PMID: 30680691
-
Transcriptomics and Metabolomics in Amyotrophic Lateral Sclerosis.Adv Exp Med Biol. 2020;1195:205-212. doi: 10.1007/978-3-030-32633-3_29. Adv Exp Med Biol. 2020. PMID: 32468479 Review.
-
Metabolomics: A Tool to Understand the Impact of Genetic Mutations in Amyotrophic Lateral Sclerosis.Genes (Basel). 2020 May 11;11(5):537. doi: 10.3390/genes11050537. Genes (Basel). 2020. PMID: 32403313 Free PMC article. Review.
Cited by
-
Metabolomics as a Crucial Tool to Develop New Therapeutic Strategies for Neurodegenerative Diseases.Metabolites. 2022 Sep 14;12(9):864. doi: 10.3390/metabo12090864. Metabolites. 2022. PMID: 36144268 Free PMC article. Review.
-
Brown Adipose Tissue undergoes pathological perturbations and shapes C2C12 myoblast homeostasis in the SOD1-G93A mouse model of Amyotrophic Lateral Sclerosis.Heliyon. 2025 Jan 23;11(3):e41801. doi: 10.1016/j.heliyon.2025.e41801. eCollection 2025 Feb 15. Heliyon. 2025. PMID: 39916853 Free PMC article.
-
Amyotrophic Lateral Sclerosis Pathoetiology and Pathophysiology: Roles of Astrocytes, Gut Microbiome, and Muscle Interactions via the Mitochondrial Melatonergic Pathway, with Disruption by Glyphosate-Based Herbicides.Int J Mol Sci. 2022 Dec 29;24(1):587. doi: 10.3390/ijms24010587. Int J Mol Sci. 2022. PMID: 36614029 Free PMC article. Review.
-
Interrogating the Metabolomic Profile of Amyotrophic Lateral Sclerosis in the Post-Mortem Human Brain by Infrared Matrix-Assisted Laser Desorption Electrospray Ionization (IR-MALDESI) Mass Spectrometry Imaging (MSI).Metabolites. 2022 Nov 10;12(11):1096. doi: 10.3390/metabo12111096. Metabolites. 2022. PMID: 36355179 Free PMC article.
-
Metabolomic and Proteomic Profiling of Serum-Derived Extracellular Vesicles from Early-Stage Amyotrophic Lateral Sclerosis Patients.J Mol Neurosci. 2025 Feb 15;75(1):21. doi: 10.1007/s12031-025-02315-w. J Mol Neurosci. 2025. PMID: 39954028
References
Grants and funding
LinkOut - more resources
Full Text Sources
Miscellaneous
