. 2022 Jun 7;10(6):1343.
doi: 10.3390/biomedicines10061343.

Comprehensive Analysis of Disease Pathology in Immunocompetent and Immunocompromised Hosts following Pulmonary SARS-CoV-2 Infection

Affiliations

Comprehensive Analysis of Disease Pathology in Immunocompetent and Immunocompromised Hosts following Pulmonary SARS-CoV-2 Infection

Santhamani Ramasamy et al. Biomedicines. .

Abstract

The Coronavirus disease 2019 (COVID-19) pandemic disproportionately affects immunocompetent and immunocompromised individuals, with the latter group being more vulnerable to severe disease and death. However, the differential pathogenesis of SARS-CoV-2 in the context of a specific immunological niche remains unknown. Similarly, systematic analysis of disease pathology in various extrapulmonary organs in immunocompetent and immunocompromised hosts during SARS-CoV-2 infection is not fully understood. We used a hamster model of SARS-CoV-2 infection, which recapitulates the pathophysiology of patients with mild-to-moderate COVID-19, to determine the dynamics of SARS-CoV-2 replication and histopathology at organ-level niches and map how COVID-19 symptoms vary in different immune contexts. Hamsters were intranasally infected with low (LD) or high (HD) inoculums of SARS-CoV-2, and the kinetics of disease pathology and viral load in multiple organs, antibody response, inflammatory cytokine expression, and genome-wide lung transcriptome by RNAseq analysis were determined and compared against corresponding responses from chemically induced immunocompromised hamsters. We observed transient body weight loss proportional to the SARS-CoV-2 infectious dose in immunocompetent hamsters. The kinetics of viral replication and peak viral loads were similar between LD and HD groups, although the latter developed more severe disease pathology in organs. Both groups generated a robust serum antibody response. In contrast, infected immunocompromised animals showed more prolonged body weight loss and mounted an inadequate SARS-CoV-2-neutralizing antibody response. The live virus was detected in the pulmonary and extrapulmonary organs for extended periods. These hamsters also had persistent inflammation with severe bronchiolar-alveolar hyperplasia/metaplasia. Consistent with the differential disease presentation, distinct changes in inflammation and immune cell response pathways and network gene expression were seen in the lungs of SARS-CoV-2-infected immunocompetent and immunocompromised animals.

Keywords: COVID-19; RNAseq; animal models; antibody; extrapulmonary; gene networks; immune suppression; immunopathology; thrombosis.


Conflict of interest statement

The authors declare no conflict of interest.

Figures

Figure 1
Figure 1
COVID-19 disease in SARS-CoV-2-infected hamsters. Comparison of body weight change (a) in LD (102.5 PFU, n = 30), HD (105 PFU, n = 15), and CP-LD (immunocompromised; 102.5 PFU, n = 30) SARS-CoV-2-infected hamsters over 2–16 dpi. Median weight change (g) over 2–16 dpi, compared to weight at the time of infection. Comparison of viral load (bf) in SARS-CoV-2-infected hamsters (LD vs. HD, and LD vs. CP-LD) at 2–16 dpi, expressed as PFU/g of tissues. The expression of SARS-CoV-2 N gene copies/g of lungs over 2–16 dpi in LD, HD, and CP-LD-infected hamsters (g). Kinetics of plaque reduction neutralization titer in hamster sera collected at 2–16 dpi (h). Data represent mean ±SD. and each dot represents data from an individual hamster. LD and CP-LD; n = 4–6, HD, n = 3 per time point; only animals that showed a positive response were included in the plots. Statistical analysis was performed by one-way ANOVA with Tukey’s multiple group comparisons. ** p < 0.01; *** p < 0.005. Significant p-values in (bg) are indicated above the plots.
Figure 2
Figure 2
Expression of pro and anti-inflammatory cytokines/chemokines in SARS-CoV-2-infected hamster lungs. Comparative expression levels of IL6, IFNγ, CCL2, CCL5, IL10, IL4, TNFα, IL1β, MIP1α, and IL7 gene transcripts in immunocompetent LD (blue) and HD (green), or immunocompromised LD (CP-LD) SARS-CoV-2-infected hamster lungs collected at 2, 4, 7, 12, and 16 dpi. (n = 3 for each time point and condition repeated 3 times; each dot represents the average of 3 technical replicates). The gene expression levels of target genes were normalized to GAPDH transcript levels and represent the fold change in expression compared to uninfected hamsters. Statistical analysis was performed using an unpaired Student’s t-test with Welch correction. Data represent mean ± SD.
Figure 3
Figure 3
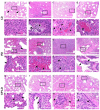
Interstitial pneumonia, bronchioalveolar, and vascular pathology in SARS-CoV-2-infected hamsters. Histopathological analysis of LD, HD, and CP-LD-infected hamster lungs revealed infiltration of mononuclear cells in the interstitium (ah; arrows in a), in the bronchiolar lumen (b,f; arrows in f), alveolar and interstitial edema (c,g; arrows in g), foamy macrophages (arrows heads in g) and early thrombus (c,d,g,h; arrow in h), interstitial/alveolar capillary congestion (b) of LD-infected hamsters. Bronchiolar hyperplasia (i,l,m,p; arrow in i), alveolar epithelial hyperplasia (i,m; arrow in m), interstitial hemorrhages (j,n; arrows in n), and severe infiltration of inflammatory cells in the alveoli and interstitium caused the obliteration of alveoli in HD-infected hamsters. Foamy macrophages (j,k,n,o; arrows in o), bronchiolar epithelial hyperplasia and detachment, bronchiolitis, and bronchiolar smooth muscle hyperplasia (l,p; arrows in p) were also noted in HD-infected hamsters. Moderate infiltration of mononuclear cells and congestion of the interstitium (qx; arrows in u), multiple alveolar epithelial hyperplasia (arrows in v), and obliteration of alveoli (r,s,v,w), severe bronchiolar epithelial hyperplasia, and obliteration of lumen (t,x) were observed in the immunosuppressed infected (CP-LD) hamsters. Images (ad,il,qt) are 100× magnifications, and (e,f,mp,ux) are 400× magnifications (marked in 100× images). Scale bar represents 100 µ (e,f,mp,ux) or 400 µ (ad,il,qt). Note: panels (a,b,e,f,i,j,m,n,q,t,u,x) are 4 dpi, (c,g,k,o,r,v) are 7 dpi, and (d,h,j,p,s,w) are 16 dpi.
Figure 4
Figure 4
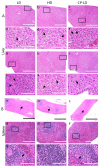
Arteriolar pathology in lungs and kidneys of SARS-CoV-2-infected hamsters. Histopathological analysis of pulmonary parenchyma revealed mild arteriolar smooth muscle hyperplasia (a), severe perivasculitis and smooth muscle hyperplasia (b; arrows), detachment of endothelial cells into the arteriolar lumen, and mild perivasculitis (c) in LD, HD, and CP-LD-infected hamsters, respectively. The images (df) are a magnification of the boxed area in (ac), respectively. Moderate (LD and CP-LD) (g,i) to severe (HD) (h) vascular smooth muscle hyperplasia in the renal arterioles in SARS-CoV-2-infected hamsters. The images in (j,k,l) are a magnification of the boxed areas in (gi), respectively. The images (ac,gi) are 100×, and (df,jl) are 400× magnifications (marked in 100× images). Scale bar represents 100 µm (df,jl) or 400 µm (ac,gi).
Figure 5
Figure 5
Histopathology of liver (A) and spleen (B) in SARS-CoV-2-infected hamsters. (A): Histopathological analysis of LD, HD, and CP-LD-infected hamster liver (4, 7, and 16 dpi, n = 3 per time point) showed the infiltration of lymphocytes in sinusoids at 4 dpi (a,d), and pyknosis (arrows in d), karyorrhexis, and karyolysis in necrotic hepatocytes (g, arrows in j) at 7 dpi. Necrotic hepatocytes with pyknotic nuclei and mild to moderate steatosis (b, arrows in e) and severe congestion in the portal vein (h) were noted at 4 dpi, while severe congestion in the portal vein, sinusoids, and mild steatosis (c, arrows in k) were observed at 7 dpi in HD-infected hamsters. Severe degeneration and necrosis of hepatocytes near the parietal surface were observed at 4 dpi in CP-LD animals (i, arrows in l). Images (ac,gi) are 100×, and (df,jl) are 400× magnifications. Scale bar represents 100 µm (df,jl), or 400 µm (ac,gi). (B): Histopathological analysis of the spleen revealed a reduction in the number and area of white pulp lesions and cellular composition with increased trabecular connective tissues at 4 dpi in LD (a,d,g), HD (b,e,h), and CP-LD (c,f,i)-infected hamsters. Images (ac) are 40×, (df) are 100×, and (gi) are 400× magnifications. Scale bar represents 100 (gi), 400 (df), or 1000 µm (ac).
Figure 6
Figure 6
Spatial expression of SARS-CoV-2 host cell entry receptors in immunocompetent and immunocompromised hamsters. Lung sections were stained for SARS-CoV-2 (af), ACE-2 receptor (gl), or CD147 (mr). Images (a,g,m) are uninfected immunocompetent hamster lung sections, and (b,h,n) are uninfected immunocompromised hamster lung sections. Images (c,i,o) are SARS-CoV-2-infected immunocompetent hamster lung sections at 4 dpi; and (d,j,p) are SARS-CoV-2-infected immunocompromised hamster lung sections at 4 dpi. Images (e,k,q) are SARS-CoV-2-infected immunocompetent hamster lung sections at 16 dpi; and (f,l,r) are SARS-CoV-2-infected immunocompromised hamster lung sections at 16 dpi. The red color in (cf) indicates the presence of SARS-CoV-2, and the green color indicates ACE-2 receptor expression in (gl) or CD147 expression in (mr). Image (s) shows lung cells positive for SARS-CoV-2 in immunocompetent (LD) and immunocompromised (Cyclo) hamsters at 4 (D4) and 16 dpi (D16); image (t) shows lung cells positive for ACE-2 in uninfected and SARS-CoV-2-infected immunocompetent (LD) and immunocompromised (Cyclophosphamide-treated) hamsters at 4 (D4), and 16 dpi (D16) and (u) shows lung cells positive for CD147 in uninfected and SARS-CoV-2-infected immunocompetent (LD) and immunocompromised (Cyclophosphamide-treated) hamsters at 4 (D4) and 16 dpi (D16). n = 3 per group.
Figure 7
Figure 7
Genome-wide lung transcriptome analysis of immunocompetent and immunocompromised hamsters infected with SARS-CoV-2. (a) PCA plot of immunocompetent and immunocompromised hamsters without infection at 4 dpi. (b) PCA plot of immunocompetent and immunocompromised hamsters without infection at 16 days post SARS-CoV-2 infection. (c) Venn diagram showing the number of significantly differentially expressed genes (SDEG) in the lungs of immunocompetent and immunocompromised hamsters at 4 or 16 dpi. Data from the infected animals were normalized to corresponding uninfected animal data. (d) Heat-map of SDEGs commonly perturbed in all four groups. Scale bar shows up (red) and downregulation (cyan). n = 3 per group.
Figure 8
Figure 8
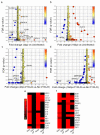
Distribution of differentially expressed genes in immunocompetent and immunocompromised hamsters infected with SARS-CoV-2. (a) Scatter plot of SDEG in immunocompetent hamster lungs at 4 dpi. (b) Scatter plot of SDEG in immunocompetent hamster lungs at 16 dpi. (c) Scatter plot of SDEG in immunocompromised hamster lungs at 4 dpi. (d) Scatter plot of SDEG in immunocompromised hamster lungs at 16 dpi. (e) Heat-map of SDEG involved in the hypercytokinemia/chemokinemia network. (f) Heat-map of SDEG involved in the canonical IFN signaling pathway. Scale bar shows upregulation (red) and no expression (black). FDR—false discovery rate.
Figure 9
Figure 9
Expression of network genes in immunocompetent and immunocompromised hamsters infected with SARS-CoV-2. (a) Heat map of SDEG involved in the inflammatory response in immunocompetent hamster lungs at 4 dpi. (b) Heat map of SDEG involved in the inflammatory response in immunocompromised hamster lungs at 4 dpi (4 dpi CP). (c) Heat map of SDEG involved in NK cell activation network in immunocompetent (4 dpi) and immunocompromised (4 dpi CP) hamster lungs at 4 dpi. (d) Heat map of SDEG involved in canonical MPN-RON signaling in macrophages network in immunocompetent (16 dpi) and immunocompromised (16 dpi CP) hamster lungs at 16 dpi. (e) Heat map of SDEG involved in prothrombin signaling network in immunocompetent (16 dpi) and immunocompromised (16 dpi CP) hamster lungs at 16 dpi. (f) Heat map of SDEG involved in canonical LXR/RXR signaling pathway in immunocompetent (16 dpi) and immunocompromised (16 dpi CP) hamster lungs at 16 dpi. (g) Heat map of SDEG involved in B cell recruitment and accumulation network in immunocompetent (16 dpi) and immunocompromised (16 dpi CP) hamster lungs at 16 dpi. Scale bar shows up (red) and downregulation (green).
Figure 10
Figure 10
Graphical summary of experimental design and key findings of this study. LD infection of immunocompetent hamsters was associated with mild body weight changes, rapid viral clearance, elevated CCL2 and CCL5 expression, and the presence of neutralizing plasma antibodies. HD infection of immunocompetent hamsters was associated with severe body weight loss and disease pathology, elevated IFN-γ expression, and strong neutralizing antibody in the plasma. In contrast, LD infection of immunocompromised hamsters was associated with less severe but prolonged bodyweight changes, persistent viral load, elevated IL10, IL1b, MIP1A, and dampened IL4 expression. No neutralizing antibodies were detected in the plasma of these animals. LD—low-dose infection; HD—high-dose infection; CP-LD—Cyclophosphamide (immunosuppressed)-treated-low dose infection.

Similar articles

Cited by

References

    1. WHO Coronavirus (COVID-19) Dashboard. [(accessed on 12 April 2022)]. Available online: https://covid19.who.int/
    1. Qin C., Zhou L., Hu Z., Zhang S., Yang S., Tao Y., Xie C., Ma K., Shang K., Wang W., et al. Dysregulation of Immune Response in Patients with Coronavirus 2019 (COVID-19) in Wuhan, China. Clin. Infect. Dis. 2020;71:762–768. doi: 10.1093/cid/ciaa248. - DOI - PMC - PubMed
    1. Hadjadj J., Yatim N., Barnabei L., Corneau A., Boussier J., Smith N., Pere H., Charbit B., Bondet V., Chenevier-Gobeaux C., et al. Impaired type I interferon activity and inflammatory responses in severe COVID-19 patients. Science. 2020;369:718–724. doi: 10.1126/science.abc6027. - DOI - PMC - PubMed
    1. Zhou F., Yu T., Du R., Fan G., Liu Y., Liu Z., Xiang J., Wang Y., Song B., Gu X., et al. Clinical course and risk factors for mortality of adult inpatients with COVID-19 in Wuhan, China: A retrospective cohort study. Lancet. 2020;395:1054–1062. doi: 10.1016/S0140-6736(20)30566-3. - DOI - PMC - PubMed
    1. Chang M.G., Yuan X., Tao Y., Peng X., Wang F.S., Xie L., Sharma L., Dela Cruz C.S., Qin E. Time Kinetics of Viral Clearance and Resolution of Symptoms in Novel Coronavirus Infection. Am. J. Respir. Crit. Care Med. 2020;201:1150–1152. doi: 10.1164/rccm.202003-0524LE. - DOI - PMC - PubMed