. 2022 Jun 19;10(6):1446.
doi: 10.3390/biomedicines10061446.

Modulating Microglia/Macrophage Activation by CDNF Promotes Transplantation of Fetal Ventral Mesencephalic Graft Survival and Function in a Hemiparkinsonian Rat Model

Affiliations

Modulating Microglia/Macrophage Activation by CDNF Promotes Transplantation of Fetal Ventral Mesencephalic Graft Survival and Function in a Hemiparkinsonian Rat Model

Kuan-Yin Tseng et al. Biomedicines. .

Abstract

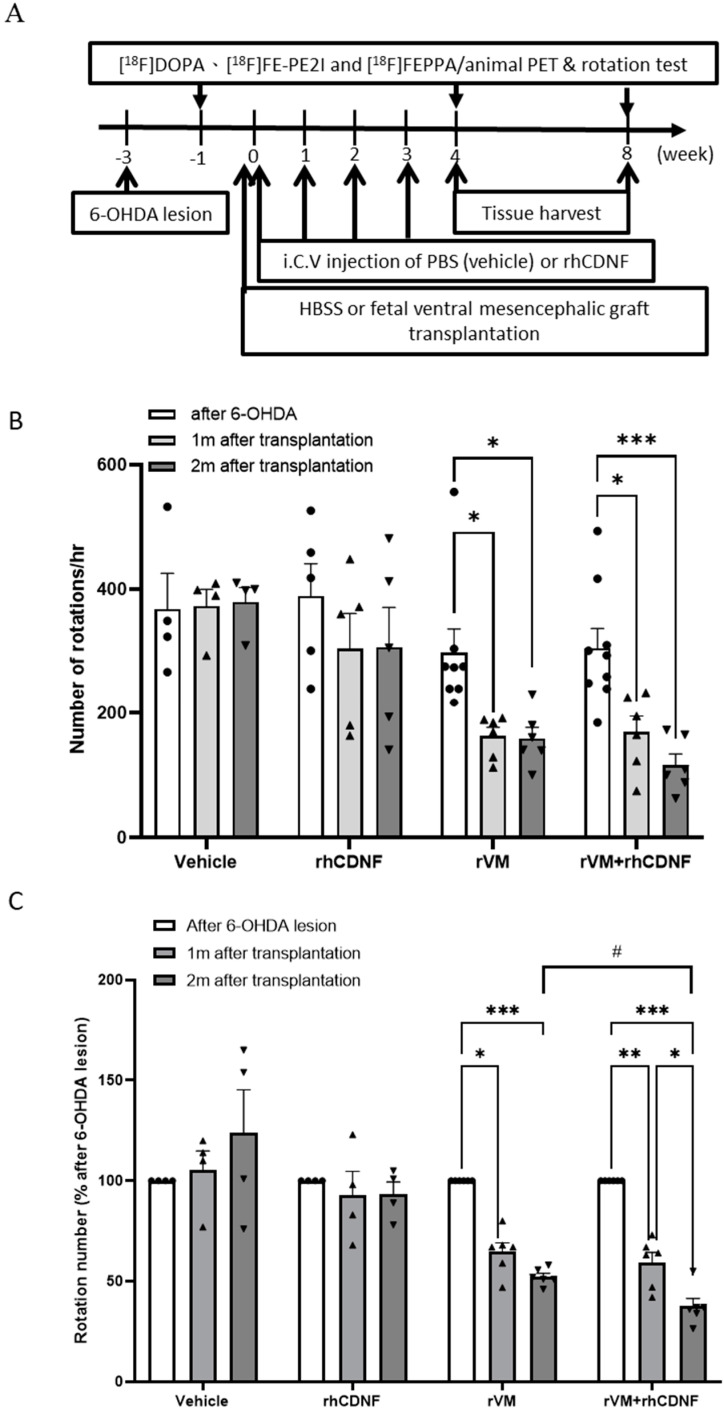
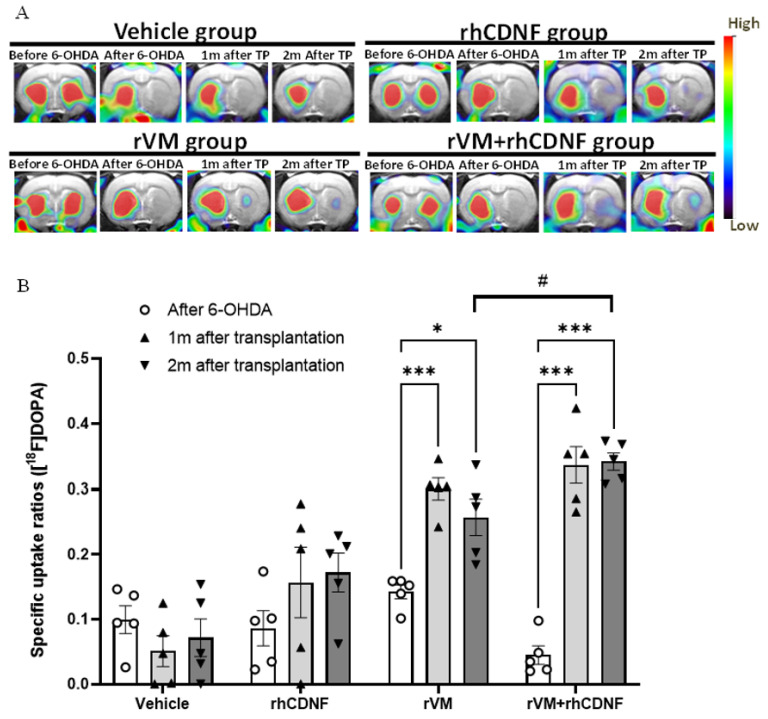
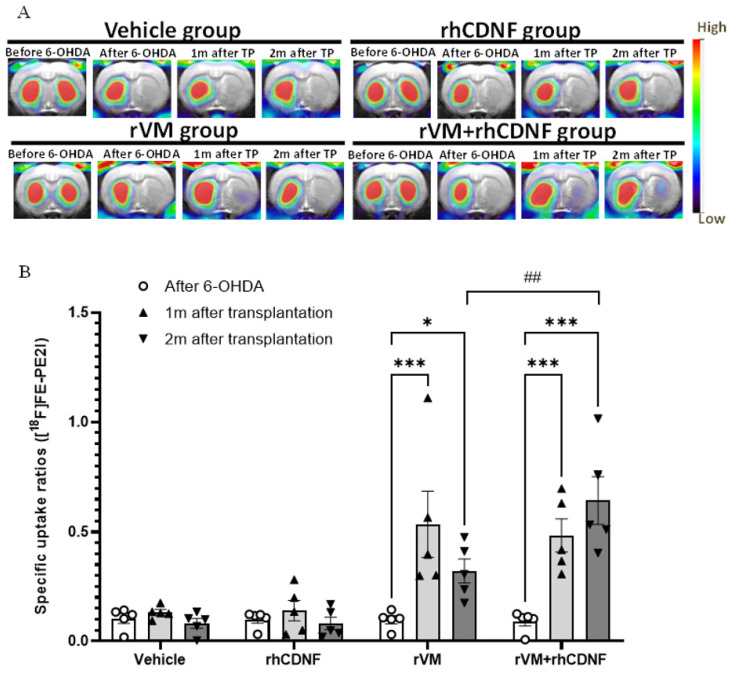
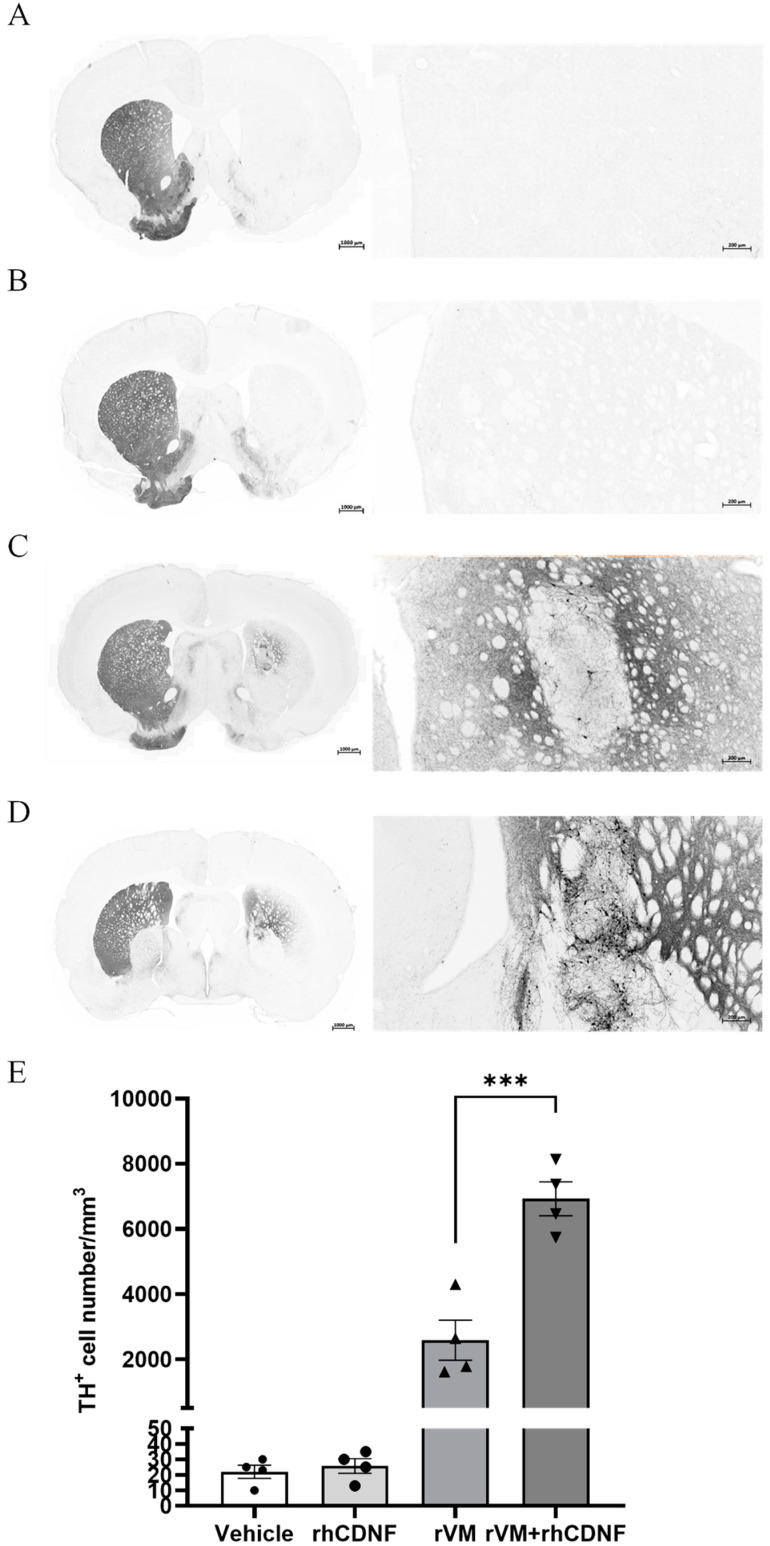
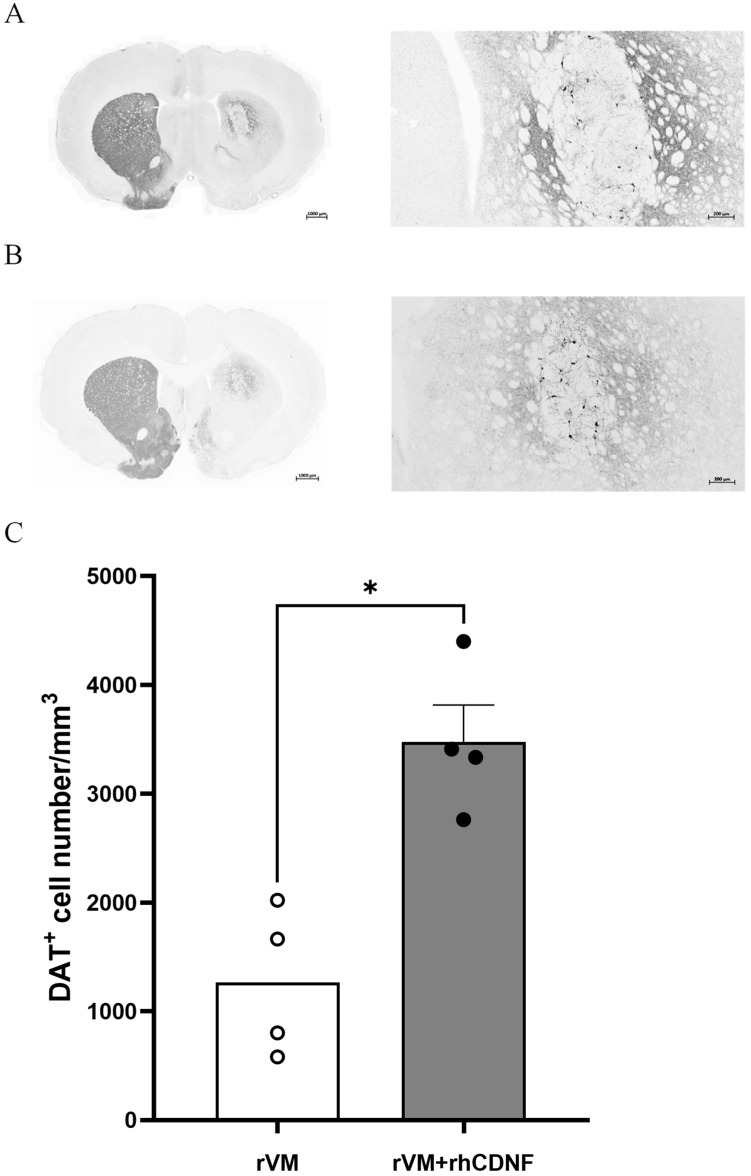
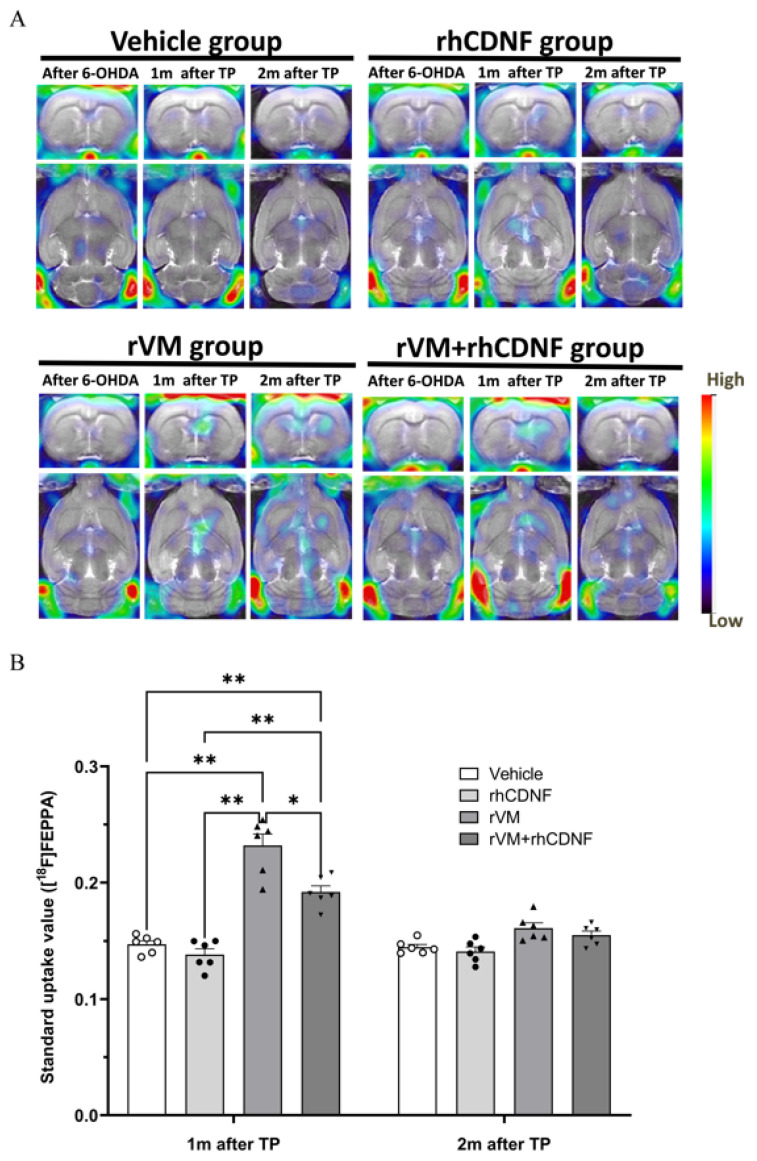
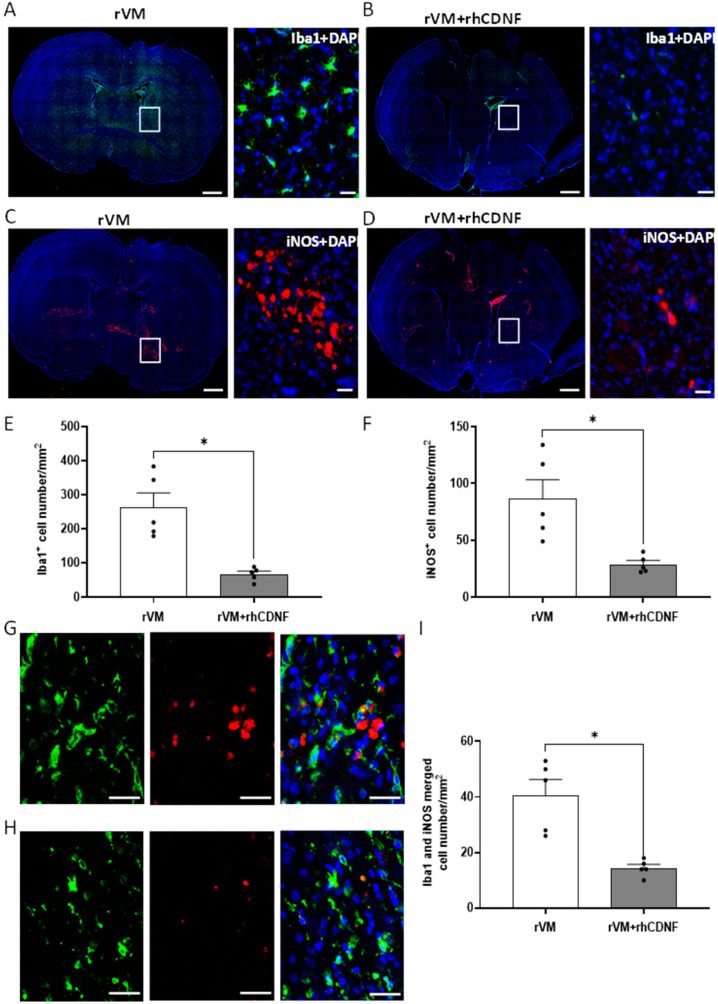
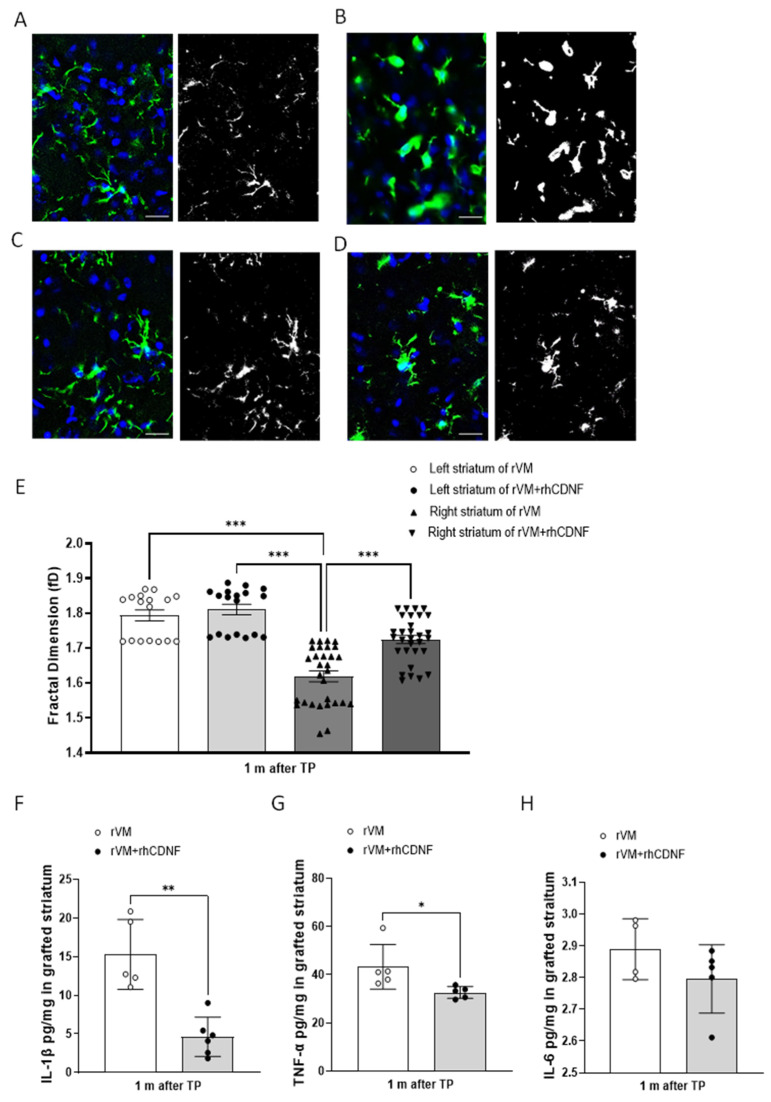
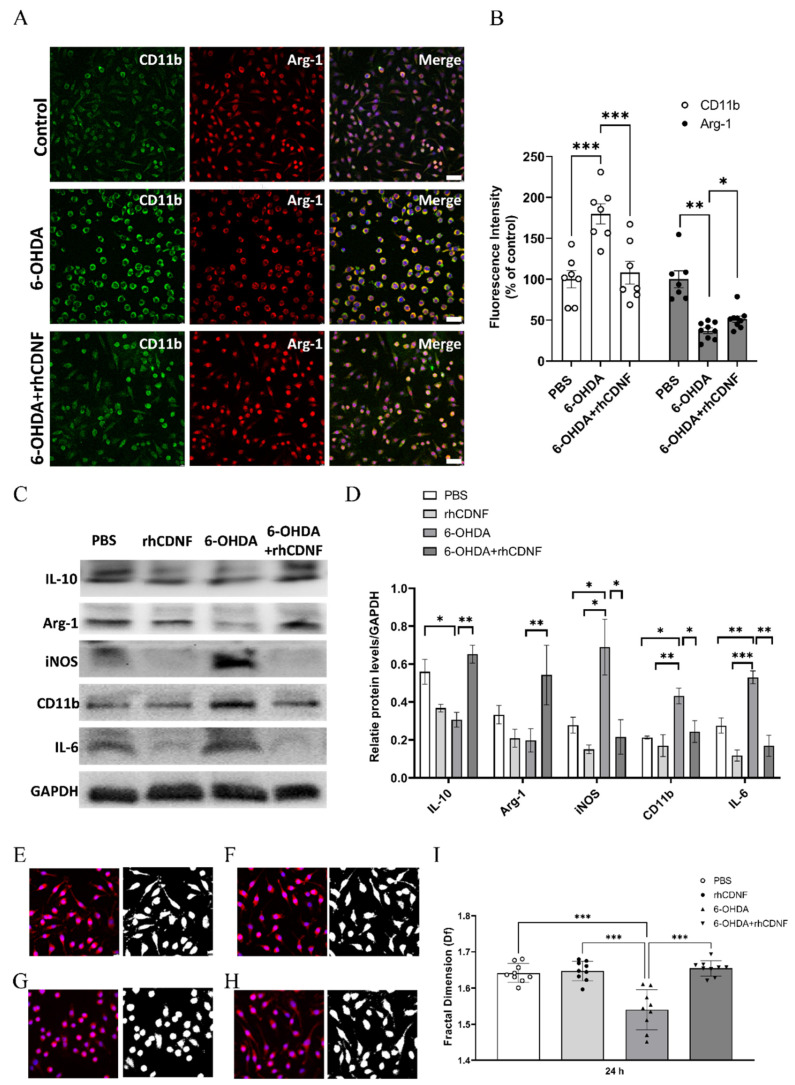
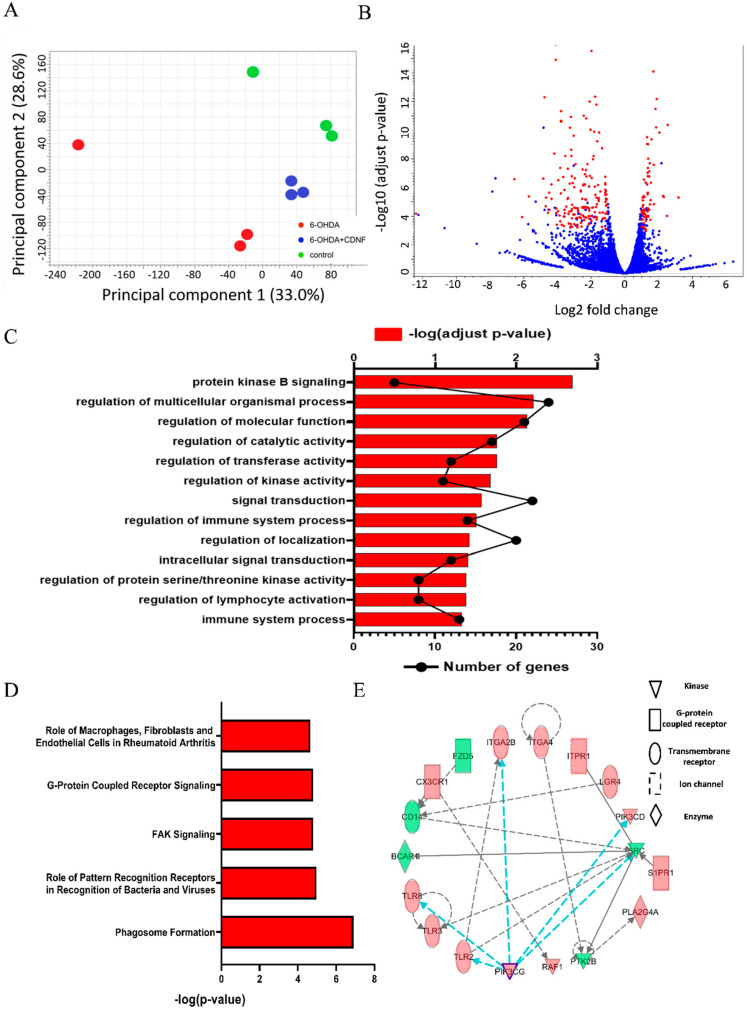
Parkinson's disease (PD) is characterized by the loss of dopaminergic neurons in substantia nigra pars compacta, which leads to the motor control deficits. Recently, cell transplantation is a cutting-edge technique for the therapy of PD. Nevertheless, one key bottleneck to realizing such potential is allogenic immune reaction of tissue grafts by recipients. Cerebral dopamine neurotrophic factor (CDNF) was shown to possess immune-modulatory properties that benefit neurodegenerative diseases. We hypothesized that co-administration of CDNF with fetal ventral mesencephalic (VM) tissue can improve the success of VM replacement therapies by attenuating immune responses. Hemiparkinsonian rats were generated by injecting 6-hydroxydopamine (6-OHDA) into the right medial forebrain bundle of Sprague Dawley (SD) rats. The rats were then intrastriatally transplanted with VM tissue from rats, with/without CDNF administration. Recovery of dopaminergic function and survival of the grafts were evaluated using the apomorphine-induced rotation test and small-animal positron emission tomography (PET) coupled with [18F] DOPA or [18F] FE-PE2I, respectively. In addition, transplantation-related inflammatory response was determined by uptake of [18F] FEPPA in the grafted side of striatum. Immunohistochemistry (IHC) examination was used to determine the survival of the grated dopaminergic neurons in the striatum and to investigate immune-modulatory effects of CDNF. The modulation of inflammatory responses caused by CDNF might involve enhancing M2 subset polarization and increasing fractal dimensions of 6-OHDA-treated BV2 microglial cell line. Analysis of CDNF-induced changes to gene expressions of 6-OHDA-stimulated BV2 cells implies that these alternations of the biomarkers and microglial morphology are implicated in the upregulation of protein kinase B signaling as well as regulation of catalytic, transferase, and protein serine/threonine kinase activity. The effects of CDNF on 6-OHDA-induced alternation of the canonical pathway in BV2 microglial cells is highly associated with PI3K-mediated phagosome formation. Our results are the first to show that CDNF administration enhances the survival of the grafted dopaminergic neurons and improves functional recovery in PD animal model. Modulation of the polarization, morphological characteristics, and transcriptional profiles of 6-OHDA-stimualted microglia by CDNF may possess these properties in transplantation-based regenerative therapies.

Keywords: Parkinson’s disease; cerebral dopamine neurotrophic factor (CDNF); microglia activation; positron emission tomography; transplantation; ventral mesencephalic tissue.


Conflict of interest statement

The authors declare there are no conflicts of interest.

Figures

Figure 1
Figure 1
(A) Experimental flowchart. [18F] DOPA, [18F] FE−PE2I, and [18F] FEPPA scans were performed at four time points (one before and three after a unilateral 6−hydroxydopamine (6−OHDA) lesion was made to medial forebrain bundle of the animals. Behavior test refers to the apomorphine-induced rotation test. Transplantation was performed three weeks after the 6−OHDA lesion was made. RhCDNF or PBS (vehicle) was administered via intracerebroventricular route at four time points. At 4 and 8 weeks after transplantation, the rats were sacrificed for immunohistochemistry (IHC) studies. (B) The apomorphine−induced rotation behavior test was used to evaluate dopaminergic (DA) function of hemiparkinsonian rats that received PBS (vehicle), rhCDNF alone, rVM, or rVM + rhCDNF. The test was performed before and after transplantation. (C) Functional recovery of the PD rats with rVM grafting at 4 and 8 weeks after transplantation, as revealed by proportion of apomorphine-induced rotation number after 6−OHDA lesioning to after transplantation. RhCDNF treatment further improved functional recovery of PD rats at 8 weeks after transplantation, compared to only rVM grafting. * p < 0.05, ** p < 0.01, *** p < 0.001 by Tukey’s multiple comparisons test, following two-way ANOVA. # p < 0.05 indicates comparison with the rVM + rhCDNF group with two-way ANOVA and Tukey’s post hoc test. The data represent mean ± SEM.
Figure 2
Figure 2
PET images of [18F] DOPA uptake distribution in rat brains. (A) Coronal (upper panel) and horizontal (lower panel) sections of each group were acquired 50−80 min after injection of 18F-DOPA. Left, middle, and right columns of each group represent 18F-DOPA uptake before the 6−OHDA lesion, after the 6−OHDA lesion, and at 4 and 8 weeks after transplantation, respectively. (B) Specific uptake ratios (SURs) of 18F−DOPA of the grafted striatum at different time points and under differ therapeutic regimen. * p < 0.05, *** p < 0.001 by Tukey’s multiple comparisons test, following two-way ANOVA. # p < 0.05 indicates comparison with the rVM + rhCDNF group with two-way ANOVA and Tukey’s post hoc test. The data represent mean ± SEM.
Figure 3
Figure 3
PET images of [18F] FE−PE2I uptake distribution in rat brains. (A) Coronal (upper panel) and horizontal (lower panel) sections of each group were acquired 20–40 min after injection of 18F-FE-PE2I. Left, middle, and right columns of each group represent 18F-FE−PE2I uptake before the 6−OHDA lesion, after the 6-OHDA lesion, and at 4 and 8 weeks after transplantation, respectively. (B) Specific uptake ratios (SURs) of 18F−FE−PE2I of the grafted striatum at different time points and under differ therapeutic regimen. * p < 0.05, *** p < 0.001 by Tukey’s multiple comparisons test, following two-way ANOVA. ## p < 0.01 indicates comparison with the rVM + rhCDNF group with two-way ANOVA and Tukey’s post hoc test. The data represent mean ± SEM.
Figure 4
Figure 4
Photomicrographs of tyrosine hydroxylase immunoreactive (TH−ir) cells in hemiparkinsonian rat striatum at 8 weeks following transplantation. TH-ir cell bodies and fibers in the grafted side (right side of coronal brain sections) of the rVM and rVM + rhCDNF groups. Higher density of TH−ir cells was found in the rVM + rhCDNF group as compared to the rVM group. (A) Vehicle group. (B) rhCDNF alone group. (C) rVM group. (D) rVM + rhCDNF group. (E) Quantification of TH−ir cell density. *** p < 0.001 vs. rVM and rVM + rhCDNF. N= 4–5 rats in each group.
Figure 5
Figure 5
Photomicrographs of DAT immunoreactive (DAT−ir) cells in hemiparkinsonian rat striatum at 8 weeks following transplantation. DAT−ir cell bodies in the grafted side (right side of coronal brain sections) of the rVM and rVM + rhCDNF groups. Higher density of DAT−ir cells was found in the rVM + rhCDNF group as compared to the rVM group. (A) Rvm group. (B) rVM + rhCDNF group. (C) Quantification of DAT-ir cell density. * p < 0.05 vs. rVM and rVM + rhCDNF. N = 4 rats in each group.
Figure 6
Figure 6
PET images of [18F] FEEPA uptake distribution in rat brains. (A) Coronal (upper panel) and horizontal (lower panel) sections of each group were acquired after injection of 18F−FEEPA. Left, middle, and right columns of each group represent 18F-FEEPA uptake after the 6−OHDA lesion, at 4, and 8 weeks after transplantation, respectively. (B) Specific uptake ratios (SURs) of 18F-FEEPA of the grafted striatum at different time points and under different therapeutic regimen. * p < 0.05, ** p < 0.01 by Tukey’s multiple comparisons test, following two-way ANOVA. The data represent mean ± SEM.
Figure 7
Figure 7
Distribution of microglia/macrophage marker, Iba1, and inflammatory marker in the grafted striatum at four weeks after transplantation. (A,B) Representative images of grafted striatum sections immunostained with Iba1 and counterstained with DAPI (blue). In the rVM group, there is a large number of Iba1−positive cells in the grafted striatum (A), while less Iba1−postive staining was found in the corresponding area of rVM + rhCDNF group (B). The right column, representation of panel in left column, shows microglia/macrophage in higher magnification stained with Iba1. Scale bar = 1000 μm in left column of each group. Scale bar = 20 μm in right column of each group. (C,D) Representative images of grafted striatum immunostained with iNOS. The insets show cells in higher magnification stained with iNOS antibody. Less iNOS-positive staining was found in the grafted striatum of rVM + rhCDNF (D) compared to rVM group (D). Scale bar = 1000 μm in left column of each group. Scale bar = 20 μm in right column of each group. (E) Quantitation of Iba1-positive cells in the grafted striatum at 4 weeks after transplantation showing accumulation of microglia/macrophages in rVM group. In the rVM + rhCDNF group, there is a significant decrease in Iba1−postive microglia/macrophage density in the corresponding area. (F) Quantitation of iNOS−positive cells in the grafted striatum at 4 weeks after transplantation showing accumulation of inflammatory cells in rVM group. In the rVM + rhCDNF group, there is a significant decrease in iNOS-positive immune cell density in the corresponding area. (G,H) Section of grafted striatum at 4 weeks after transplantation double-stained with Iba1 (green) and iNOS (red). rVM + rhCDNF group (G) showed fewer Iba1− and iNOS−positive cells compared with the rVM group (H). Scale bar = 20 μm. (I) Quantification of Ib1−and iNOS−positive cell numbers * p < 0.05 indicates comparison with rVM group with Student’s t-test. The data represent mean ± SEM.
Figure 8
Figure 8
CDNF affects complexity analysis of Iba1−positive cell morphologies and suppresses the production of proinflammatory cytokines in the grafted striatum at one month after transplantation. (AD) Fractal analysis of microglia/macrophages in Iba1-stained tissue. Original photomicrographs were subjected to a series of uniform ImageJ plugin protocols prior to conversion to binary images. Binary images were subsequently analyzed by using FracLac of ImageJ, which quantifies single cell complexity (fractal dimension, fD). Representative images of morphological changes in Iba1−staining cells within the left striatum in rVM−grafted rats (A), the right striatum in rVM-grafted rats (B), the left striatum in rVM + rhCDNF−grafted rats (C), and the right striatum in rVM + rhCDNF−grafted rats (D). Scale bar = 20 µm. (E) Summary data and statistical analysis of fractal dimension at one month after transplantation (n = 17−30, one-way ANOVA p < 0.001, *** p < 0.001 compared to the right striatum in rVM-grafted rats, Tukey’s post hoc test). (F) IL-1β concentrations in the grafted striatum were measured by ELISA. (G) TNF−α concentrations in the grafted striatum were measured by ELISA. (H) IL−6 concentrations in the grafted striatum were measured by ELISA. * p < 0.05, ** p < 0.01 indicates comparison with rVM group with Student’s t-test. The data represent mean ± SEM.
Figure 9
Figure 9
Effects of CDNF on 6−OHDA−stimulated BV2 microglial cells. (A) Representative pictures of BV2 cells double-stained for CD11b (green) or Arginase−1 (Arg−1; red), and nuclei were counterstained with DAPI (blue). Photomicrographs were taken with an epifluorescence microscope; scale bar = 50 µm. (B) The fluorescent intensities divided by the untreated BV2 cells (control group). There was an increase in CD11b fluorescent intensity in BV2 cells after 6−OHDA treatment as compared with the untreated BV2 cells (control group), and rhCDNF given simultaneously with 6-OHDA decreased activated CD11b intensity in BV2 cells. In contrast, the fluorescent intensity of Arg-1 in 6-OHDA-stimulated BV2 cells was lower than the control group, which was upregulated by CDNF supplementation. (C) Lysates from BV2 cells after PBS, rhCDNF, 6-OHDA, or 6-OHDA + rhCDNF treatment were immunoblotted and IL10, Arg−1, iNOS, CD11b, IL−6, and GAPDH levels were analyzed. (D) Protein levels were quantified in relation to levels of GAPDH, a housekeeping protein (n = 5, mean ± S.E.M). (EH) Morphological analysis of Iba1−stained BV2 cells. The process to prepare photomicrographs for morphological analysis: Original photomicrographs were subjected to a series of uniform ImageJ plugin protocols prior to conversion to binary images. Binary images were then analyzed by using FracLac for ImageJ, which quantifies single cell complexity (fractal dimension, fD). The calculated fD of the cell is shown below its binary image. Representative images of morphological changes in Iba1-staining cells within PBS-treated BV2 cells (E), rhCDNF−treated BV2 cells (F), 6−OHDA-treated BV2 cells (G), and rhCDNF supplementation in 6−OHDA−treated BV2 cells (H). (I) Summary data and statistical analysis of fractal dimension in 24 h cultured BV2 cells. Fractal dimension was decreased in the 6−OHDA compared with the PBS or rhCDNF alone treatment. However, rhCDNF given simultaneously with 6-OHDA treatment restored the fractal dimension of Iba1−positive cells (n = 18−22, one-way ANOVA p < 0.001, *** p < 0.001, ** p < 0.01, * p < 0.05 compared to 6-OHDA, Tukey’s post hoc test). The data represent mean ± SEM.
Figure 10
Figure 10
CDNF treatment regulates gene expression in the 6−OHDA−stimulated BV2 microglial cells. (A) Principal component analysis (PCA) of the transcriptomes among control, 6−OHDA, and 6−OHDA + rhCDNF groups. (B) Volcano plot comparing the log2fold changes and adjusted p-values of 21,860 gene expressions. The red dots indicate genes significantly regulated (log2fold change >1 or <−1 adjusted p-value < 0.001), and the blue dots indicate genes with no significant change between 6−OHDA and 6−OHDA + rhCDNF. (C) GO biological processes overrepresentation analysis based on 253 DEGs. (D) Ingenuity® Bioinformatics pathway analysis revealed that highly canonical pathways were differentially expressed in PBS−treated and rhCDNF−treated BV2 cell lines in response to 6−OHDA stimulation. The canonical pathways included in this analysis are shown along the y-axis of the bar chart. The x−axis indicates the statistical significance. Calculated using the right-tailed Fisher exact test, the p−value indicates which biologic annotations are significantly associated with the input molecules relative to all functionally characterized mammalian molecules. (E) The activity of highly connected positive regulators of the inflammatory genes PI3KCG, PI3KCD, TLR2, and TLR8 led to the activation of this phagosome formation network, as assessed using the IPA molecule activity predictor in rhCDNF−treated BV2 cells after 24 h 6−OHDA stimulation.

Similar articles

Cited by

References

    1. Lewis P.A. James Parkinson: The man behind the shaking palsy. J. Parkinsons Dis. 2012;2:181–187. doi: 10.3233/JPD-2012-012108. - DOI - PubMed
    1. Ling Z., Zhu Y., Tong C., Snyder J.A., Lipton J.W., Carvey P.M. Progressive dopamine neuron loss following supra-nigral lipopolysaccharide (LPS) infusion into rats exposed to LPS prenatally. Exp. Neurol. 2006;199:499–512. doi: 10.1016/j.expneurol.2006.01.010. - DOI - PubMed
    1. Carvey P.M., Punati A., Newman M.B. Progressive dopamine neuron loss in Parkinson’s disease: The multiple hit hypothesis. Cell Transplant. 2006;15:239–250. doi: 10.3727/000000006783981990. - DOI - PubMed
    1. Bastide M.F., Meissner W.G., Picconi B., Fasano S., Fernagut P.-O., Feyder M., Francardo V., Alcacer C., Ding Y., Brambilla R. Pathophysiology of L-dopa-induced motor and non-motor complications in Parkinson’s disease. Prog. Neurobiol. 2015;132:96–168. doi: 10.1016/j.pneurobio.2015.07.002. - DOI - PubMed
    1. de la Fuente-Fernández R., Sossi V., Huang Z., Furtado S., Lu J.-Q., Calne D.B., Ruth T.J., Stoessl A.J. Levodopa-induced changes in synaptic dopamine levels increase with progression of Parkinson’s disease: Implications for dyskinesias. Brain. 2004;127:2747–2754. doi: 10.1093/brain/awh290. - DOI - PubMed

LinkOut - more resources