. 2022 Jun 19;10(6):1447.
doi: 10.3390/biomedicines10061447.

Traumatic and Diabetic Schwann Cell Demyelination Is Triggered by a Transient Mitochondrial Calcium Release through Voltage Dependent Anion Channel 1

Affiliations

Traumatic and Diabetic Schwann Cell Demyelination Is Triggered by a Transient Mitochondrial Calcium Release through Voltage Dependent Anion Channel 1

Nicolas Tricaud et al. Biomedicines. .

Abstract

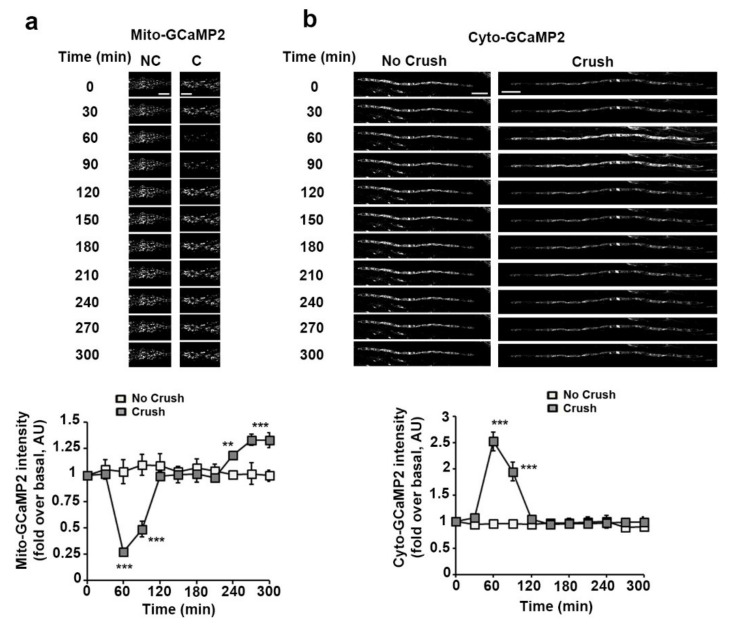
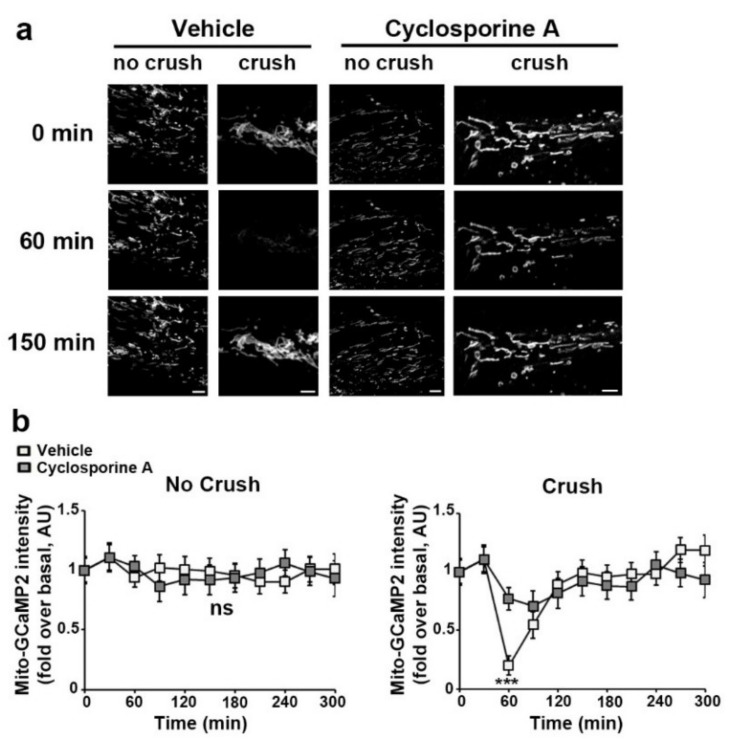
A large number of peripheral neuropathies, among which are traumatic and diabetic peripheral neuropathies, result from the degeneration of the myelin sheath, a process called demyelination. Demyelination does not result from Schwann cell death but from Schwann cell dedifferentiation, which includes reprograming and several catabolic and anabolic events. Starting around 4 h after nerve injury, activation of MAPK/cJun pathways is the earliest characterized step of this dedifferentiation program. Here we show, using real-time in vivo imaging, that Schwann cell mitochondrial pH, motility and calcium content are altered as soon as one hour after nerve injury. Mitochondrial calcium release occurred through the VDAC outer membrane channel and mPTP inner membrane channel. This calcium influx in the cytoplasm induced Schwann-cell demyelination via MAPK/c-Jun activation. Blocking calcium release through VDAC silencing or VDAC inhibitor TRO19622 prevented demyelination. We found that the kinetics of mitochondrial calcium release upon nerve injury were altered in the Schwann cells of diabetic mice suggesting a permanent leak of mitochondrial calcium in the cytoplasm. TRO19622 treatment alleviated peripheral nerve defects and motor deficit in diabetic mice. Together, these data indicate that mitochondrial calcium homeostasis is instrumental in the Schwann cell demyelination program and that blocking VDAC constitutes a molecular basis for developing anti-demyelinating drugs for diabetic peripheral neuropathy.

Keywords: VDAC; mitochondria; myelin; peripheral nerve.


Conflict of interest statement

The authors declare no conflict of interest.

Figures

Figure 1
Figure 1
Live imaging technique and fluorescent probes validation (a)—Schematic representation of the imaging technique used in this work. The sciatic nerve (SN) of anesthetized mice illustrated by the black line was exposed under the lens of a multiphoton microscope. Myelinating SC, stained for E-cadherin (white), contains mitochondria labelled through adenovirus-delivered mito-Dsred2 expression (red) in particular around the cell nucleus labelled with TOPRO3 (blue) (scale bar= 10 µm). This technique allows the selective in vivo multiphoton imaging of mitochondria in some parts of living SC (scale bar = 5 µm. Same magnification for all pictures.). All mice were 8 to 11 weeks old. (b) Mouse sciatic nerves expressing mito-GCaMP2 were incubated in a bath containing Leibovitz’s L15 medium without (Cont) or with EDTA (1 mM) or calcium chloride (CaCl2, 100 µM). Probe fluorescence was imaged (upper panels pictures, scale bar = 5 µm. Same magnification for all pictures.) and measured (lower panel graph). (c) Mouse sciatic nerves expressing cyto-GCaMP2 were incubated in a bath containing Leibovitz’s L15 medium without (Cont) or with EDTA (1 mM) or calcium chloride (CaCl2, 100 µM). Probe fluorescence was imaged (upper panels pictures, scale bar = 50 µm. Same magnification for all pictures.) and measured (lower panel graph). (d) Mouse sciatic nerves expressing mito-Sypher were incubated in a bath containing Leibovitz’s L15 medium without (Cont) or with sodium azide (Na3, 3 mM pH 3.2) or ammonium chloride (NH4Cl, 30 mM pH 8). Probe fluorescence was imaged (upper panels pictures, scale bar = 5 µm. Same magnification for all pictures.) and measured (lower panel graph). Error bars show SEM. Statistical tests are one-way ANOVA comparing the control with each other condition. * p < 0.05, ** p < 0.01.
Figure 2
Figure 2
Mitochondrial mobility and pH change during Schwann cell demyelination. (a) Mitochondrial velocity in myelinating SC of control (No crush, n = 2 mice) and crushed (Crush, n = 5 mice) nerves was measured using adenovirus-delivered mito-DsRed2. Velocity is shown in mm traveled in one minute. Nerve injury occurs at t = 0. (b) Upper panels: Representative in vivo images of SC mitochondria (left panels) showing how mitochondrial length is characterized and quantified (right panels) in non-crushed and crushed nerves. Lower panel: Frequency histogram of mitochondrial size in control (No crush, n = 2 mice) and crushed (Crush, n = 5 mice) conditions at three successive time points. Scale bar = 3µm. Same magnification for all pictures. (c) Upper panels: Representative in vivo images of SC mitochondria labeled with adenovirus-delivered mito-Sypher probe in non-crushed (No Crush) and crushed nerves (Crush) at successive time points. Scale bar= 5 μm. Same magnification for all pictures. Lower panel: the average fluorescence intensity of the probe was measured for more than 100 mitochondria at the successive indicated time points in non-crushed (No Crush, n = 3 mice) and crushed nerves (Crush, n = 4 mice). The probe fluorescence intensity is normalized over the basal condition before crush. Error bars indicate SEM. Statistical tests are repeated measures two-way ANOVA Sidak post hoc test comparing non-crushed to crushed nerves values. All mice were 8 to 11 weeks old. ** p < 0.01, *** p < 0.001.
Figure 3
Figure 3
Mitochondrial and cytoplasmic calcium dynamics in SC following nerve injury. (a) Upper panels: Representative in vivo images of SC mitochondria labeled with adenovirus-delivered mito-GCaMP2 probe in non-crushed (No Crush) and crushed nerves (Crush) at successive time points. Scale bar= 5 μm. Same magnification for all pictures. Lower panel: the average fluorescence intensity of the probe was measured for more than 100 mitochondria at the successive indicated time points in non-crushed (No Crush, n = 3 mice) and crushed nerves (Crush, n = 5 mice). The probe fluorescence intensity is normalized over the basal condition before crush. (b) Upper panels: Representative in vivo images of SC mitochondria labeled with adenovirus-delivered cyto-GCaMP2 probe in non-crushed (No Crush) and crushed nerves (Crush) at successive time points. Scale bar= 50 μm. Same magnification for all pictures. Lower panel: the average fluorescence intensity of the probe was measured for more than 100 mitochondria at the successive indicated time points in non-crushed (No Crush, n = 3 mice) and crushed nerves (Crush, n = 4 mice). The probe fluorescence intensity is normalized over the basal condition before crush. Error bars indicate SEM. Statistical tests are two-way ANOVA Sidak post hoc test comparing non-crushed to crushed nerves values. All mice were 8 to 11 weeks old. ** p < 0.01, *** p < 0.001.
Figure 4
Figure 4
VDAC1 mediates mitochondrial calcium release during SC demyelination. (a) MSC80 SC were transfected with plasmids expressing puromycin and a control shRNA with no mammalian target (C) or 5 shRNAs (1–5) specifically targeting mouse VDAC1 under a U6 promoter. After a selection with puromycin, cells were lysed and their VDAC protein expressions were analyzed by WB. GAPDH is used as loading control. (b) AAV virus expressing VDAC1 shRNAs 2 or 3 in addition to GFP were injected in the sciatic nerve of mice. Three weeks later animals were sacrificed and the expression of VDAC in infected SC was analyzed by immunostaining on teased fibers. Infected cells expressing control shRNA and GFP (green, arrowheads) show mitochondria (mitotracker, red) harboring VDAC (white) while cells expressing VDAC1 shRNAs show reduced expression of VDAC. Scale bar = 5 μm. Same magnification for all pictures. (c) AAV virus expressing VDAC1 shRNAs 2 or 3 in addition to mito- or cyto-GCaMP2o was injected in the sciatic nerve of mice. The average fluorescence intensity of the mito-GCaMP2 (upper panel) and cyto-GCaMP2 (lower panel) probes was measured for more than 100 mitochondria at the successive indicated time points in non-crushed (No Crush, n = 3 mice) and crushed nerves (Crush, n = 4–5 mice). The probe fluorescence intensity is normalized over the basal condition before crush. Error bars indicate SEM. Statistical tests are two-way ANOVA Sidak post hoc test comparing crushed with control shRNA to crushed with VDAC1 shRNAs conditions. All mice were 8 to 11 weeks old. (d) Sciatic nerves transduced with viruses expressing mito-GCaMP2 (left panel, n = 3 mice and >100 mitochondria for both TRO and vehicle) or cyto-GCaMP2 (right panel, n = 3 and > 100 mitochondria mice for both TRO and vehicle) were injected with 2 μL of 20 μM TRO19622 (TRO) solution or vehicle 30 min before nerve injury and then live imaging. Probes’ fluorescence intensities were measured before injury and then 60 min after injury at the peak of mitochondrial calcium release. Values at t = 60 min are presented in percentage of basal values before crush. The dotted lines indicate 100% of the basal values. Error bars indicate SEM. Statistical tests are two-tailed Student’s t-test. All mice were 8 to 11 weeks old. (e) Sciatic nerves transduced with viruses expressing mito-GCaMP2 (left panel, n = 89 and 109 mitochondria for vehicle and MJ respectively, in four mice each) were injected with 1 μL of 57 μM methyl jasmonate (MJ) solution or vehicle 10 min before live imaging. No crush was performed and fluorescent mitochondria were imaged again 2 h later. Values at t = 2 h are presented in percentage values at t = 10 min. The dotted lines indicate 100% of the basal values. Error bars indicate SEM. Statistical tests are two-tailed Student’s t-test. All mice were 8 to 11 weeks old. ** p < 0.01, *** p < 0.001.
Figure 5
Figure 5
Blocking mPTP with cyclosporine A prevents mitochondrial calcium release in mSC following nerve injury. (a) Representative images of mSC mitochondria labeled with adenovirus-delivered mito-GCaMP2 probe in non-crushed (No Crush) and crushed (Crush) nerves at successive time points following treatment with 500 µm cyclosporine A (right panels) or vehicle (left panels). Scale bar= 3 μm. Same magnification for all pictures. (b) Left panel: Average fluorescence intensity of mito-GCaMP2 was measured for more than 100 mitochondria at successive time points in non-crushed nerves treated with cyclosporine A or vehicle. Right panel: Average fluorescence intensity of mito-GCaMP2 was measured for more than 100 mitochondria at the successive time points in crushed nerves treated with cyclosporine A or vehicle. The probe fluorescence intensity is normalized over the basal condition before crush or at the first imaging time point for non-crushed nerves. Error bars indicate SEM. Statistical tests are two-way ANOVA Sidak’s post hoc test comparing cyclosporine A and vehicle treated conditions. n = 3 animals for each condition. All mice were 8 to 11 weeks old. *** p < 0.001.
Figure 6
Figure 6
Demyelination is decreased after treatment with TRO19622 and spontaneously induced after treatment with MJ. (a) Upper panels: Western blot analysis for phospho-ERK1/2 (P-ERK1/2), phospho-p38 (P-p38), phospho-JNK (P-JNK), phospho-cJun (P-cJun), activated cleaved-caspase3 (a-caspase3) and phospho-Bcl2 (P-Bcl2) in the sciatic nerve of mice without injury (No crush), 4 h after injury (Crush), 4 h after injury with TRO19622 treatment 30 min before injury (Crush + TRO), or without injury but 4 h after methyl jasmonate treatment (No crush + MJ). GAPDH was used as loading control. Blots were stripped and re-hybridized with different antibodies against proteins of interest, so GAPDH is a loading control for different immunoblots. n = 3 independent experiments. Lower panels: WB results analyzed by densitometry and normalized on GAPDH respective values on the same blot. As similar changes were observed at 4 and 12 h after injury (see Figure S3 for 12 h representative images), data from both experiments were pooled except for P-cJun, for which changes were consistent but much higher at 12 h. So, only 4 h data are presented. All data are presented as fold over No crush condition. Error bars show SD. Statistical tests are one-way ANOVA followed by a Dunnett’s multiple comparison post hoc tests for each marker. n = 2 (P-cJun) to 4 mice. ns= non-significant. (b) Immunohistochemistry for phospho-cJun (P-cJun, red) and nuclear TOPRO3 (blue) on teased fibers of mouse nerve transduced with virus expressing control shRNA or shRNA 2 or 3 targeting VDAC1 in addition to GFP (green). Without injury (No crush) non infected cells or cells expressing control shRNA and GFP show no P-cJun in their nucleus. Four days after injury (Crush), non-infected cells and cells expressing control shRNA and GFP express P-cJun in their nucleus, while cells expressing shRNA2 or 3 and GFP show low amount of P-cJun in their nucleus (arrowheads). Scale bars = 10 μm. Same magnification for all pictures. (c)—Immunohistochemistry for phospho-cJun (P-cJun, red) and nuclear TOPRO3 (white) on teased fibers of mouse nerve without injury (No crush) or 4 days after injury (Crush). In both cases, animals were treated with TRO19622 (TRO) or vehicle, once intraperitoneally (3 mg/kg) 10 h before injury, once intrasciatically (2 µL 20 µM) 30 min before injury, and then intraperitoneally for 4 consecutive days. Scale bars = 10 μm. Same magnification for all pictures. (d) Immunohistochemistry for phospho-cJun (P-cJun, red) and nuclear TOPRO3 (white) on teased fibers of mouse nerve without injury (No crush) 4 days after treatment with methyl jasmonate (MJ) or vehicle. Scale bars = 10 μm. Same magnification for all pictures. (e) Representative images of the morphological features occurring in myelinating SC during demyelination 4 days after nerve injury. These cells express virally-delivered GFP (Green). Arrowheads show myelinating SC and arrows non-myelin-forming SC. Scale bars = 100 μm. (f) Quantification of myelinating and non-myelinating SC frequency in nerves transduced with AAV- expressing Control shRNA (Cont sh) or shRNAs 2 or 3 targeting VDAC1 (VDAC1 sh) in addition to GFP with (Crush) or without nerve injury (No crush). Nerves were collected 4 days after the nerve injury and GFP-positive cells were counted as myelinating or non-myelin forming as shown in Figure 6e. Data are represented as mean ±SD. Statistical significances were determined using a two-tailed Student’s t-test. n= 5 (No Crush, Cont sh), 4 (Crush, Cont sh) and 4 (Crush, VDAC1 sh) mice. (g) Representative CARS images of sciatic nerves freshly collected in non-injured control animals (Control), in animals 4 days after crush nerve injury and after vehicle (Crush + vehicle) or TRO19622 (Crush + TRO, 3 mg/kg) treatment or in animals 4 days after injection of MJ in the sciatic nerve (No Crush + MJ). Scale bars= 20 μm. (h) The number of ovoid per surface unit (left) and the percentage of demyelinated fibers (right) were measured on the CARS images. Data are presented as mean ± SEM. n = 6 (Crush + vehicle), 6 (Crush + TRO) and 4 (No Crush + MJ) animals. Statistical analysis shows one-way ANOVA Sidak’s post hoc test. * p < 0.05, ** p < 0.01, or *** p < 0.001.
Figure 7
Figure 7
SCs of db/db diabetic mice show an altered mitochondrial calcium homeostasis and TRO19622 prevents motor, electrophysiological and cellular defects in these mice. Mitochondrial calcium (Mito-GCaMP2) (a), cytoplasmic calcium (Cyto-GCaMP2) (b) probe intensity in mSCs of control (db/+) and diabetic (db/db) mice in basal conditions. Mitochondrial calcium is decreased and cytoplasmic calcium increased in the mSCs of diabetic mice. Error bars indicate SEM. Statistical tests are unpaired Student’s t-test. (a) n= 77 (db/+), 168 (db/db) mitochondria (6 animals each genotype). (b) n = 11 (db/+), 9 (db/db) mSCs (3 mice each genotype). All mice were 8 to 11 weeks old. (c) Mitochondrial calcium (left) and cytoplasmic calcium (right) probe intensity in mSCs of control (db/+) and diabetic (db/db) mice following nerve crush (t = 0). Mitochondrial calcium release is significantly sustained at t = 90 min. The probe fluorescence intensity is normalized over the basal condition before crush. Error bars indicate SEM. Statistical tests are two-way ANOVA Sidak post hoc test. Left: n = 40 (db/+), 88 (db/db) mitochondria (3 mice for each genotype). Right: n = 7 (db/+), 5 (db/db) mSCs (3 mice for each genotype). All mice were 8 to 11 weeks old. (d) Left panel: Immunohistochemistry for phospho–c-JUN and DAPI nuclei staining on mouse sciatic nerve cryosections. Mice were treated with vehicle (db/+, db/db) or with TRO19622 (db/db + TRO 30, 3 mg/kg) for 30 days. Arrows indicate infected mSC nuclei. Scale bar: 50 μm. Same magnification for all pictures. Right panel: Quantification of nuclear phospho–c-JUN represented as fold over db/+ mice. Noninfected neighbour cells were used as internal controls. Mice were treated with vehicle (db/+, db/db, 30 days) or with TRO19622 for 15 days (db/db + TRO 15) or 30 days (db/db + TRO 30). Error bars indicate SEM. Statistical tests are one-way ANOVA test. n = 28 (db/+), 17 (db/db), 17 (db/db + TRO 15), 19 (db/db + TRO 30) cells (3 mice of each condition). All mice were 8 to 11 weeks old. (e) Representative transmission electron micrograph images of sciatic nerve cross sections of db/+ and db/db mice. Scale bar: 5 μm. (f) g ratio (axon diameter/fiber diameter) was measured on electron micrograph from db/+ or db/db mice treated with vehicle (db/+ Veh, db/db Veh) or TRO16922 for 30 days (db/+ TRO, db/db TRO) (3 mg/kg). A minimum of 189 fibers was measured per animal. Statistical test is one-way ANOVA followed by a Dunnett’s multiple comparison post-hoc test. n= 3 mice for each condition. (g) Measure of sciatic nerve NCV of db/+ and db/db mice before and after treatment with vehicle (db/+ Veh, db/db Veh) or TRO 19622 for 30 days (db/+ TRO, db/db TRO) (3 mg/kg). Measure of grip strength (h) and rotarod latency (i) of db/+ and db/db mice at one week (Week 1) and four weeks (Week 4) of treatment with vehicle (db/+ Veh, db/db Veh) or TRO 19622 (db/+ TRO, db/db TRO) (3 mg/kg) and 8 weeks after stopping the 4-weeks treatment (Weeks 4+8). Data are expressed as the mean ± SEM. n = 12 mice for each group. Statistical test is one-way ANOVA followed by a Dunnett’s multiple comparison post-hoc test. * p < 0.05, ** p < 0.01, or *** p < 0.001.

Similar articles

Cited by

References

    1. Nave K.-A. Myelination and Support of Axonal Integrity by Glia. Nature. 2010;468:244–252. doi: 10.1038/nature09614. - DOI - PubMed
    1. Sherman D.L., Brophy P.J. Mechanisms of Axon Ensheathment and Myelin Growth. Nat. Rev. Neurosci. 2005;6:683–690. doi: 10.1038/nrn1743. - DOI - PubMed
    1. Tricaud N., Park H.T. Wallerian Demyelination: Chronicle of a Cellular Cataclysm. Cell. Mol. Life Sci. 2017;74:4049–4057. doi: 10.1007/s00018-017-2565-2. - DOI - PMC - PubMed
    1. Park H.T., Kim J.K., Tricaud N. The Conceptual Introduction of the “Demyelinating Schwann Cell” in Peripheral Demyelinating Neuropathies. Glia. 2019;67:571–581. doi: 10.1002/glia.23509. - DOI - PubMed
    1. Jessen K.R., Mirsky R. The Repair Schwann Cell and Its Function in Regenerating Nerves. J. Physiol. 2016;594:3521–3531. doi: 10.1113/JP270874. - DOI - PMC - PubMed