. 2022 Jun 12;14(12):2895.
doi: 10.3390/cancers14122895.

A Platform of Patient-Derived Microtumors Identifies Individual Treatment Responses and Therapeutic Vulnerabilities in Ovarian Cancer

Affiliations

A Platform of Patient-Derived Microtumors Identifies Individual Treatment Responses and Therapeutic Vulnerabilities in Ovarian Cancer

Nicole Anderle et al. Cancers (Basel). .

Abstract

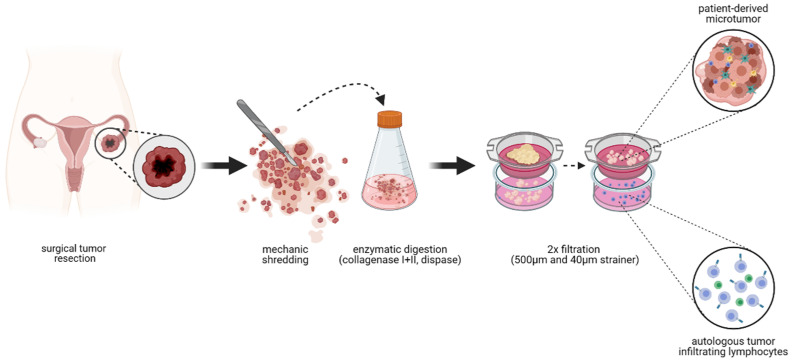
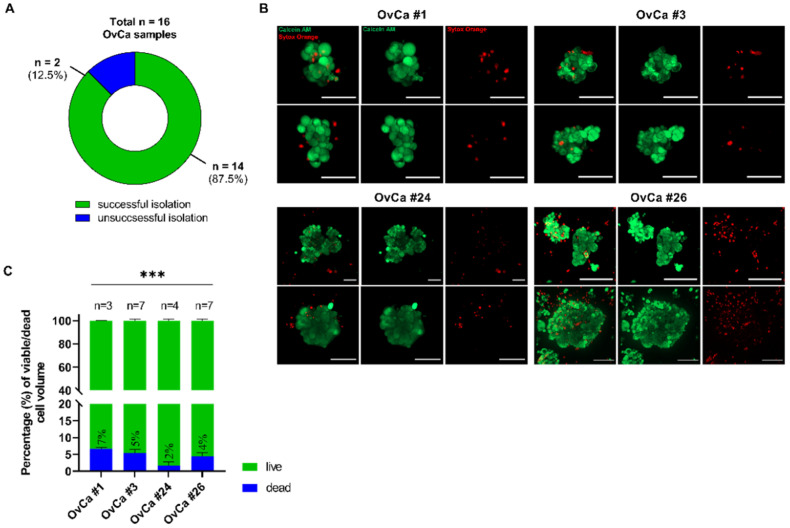
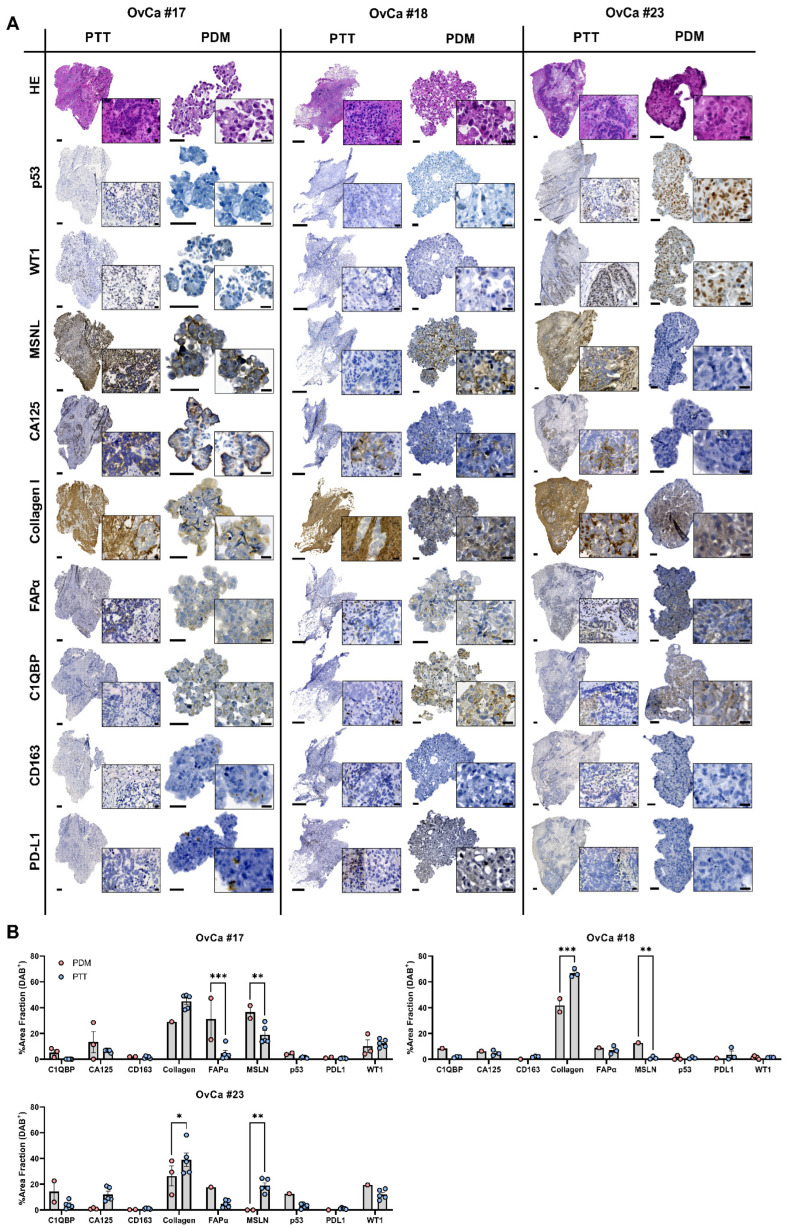
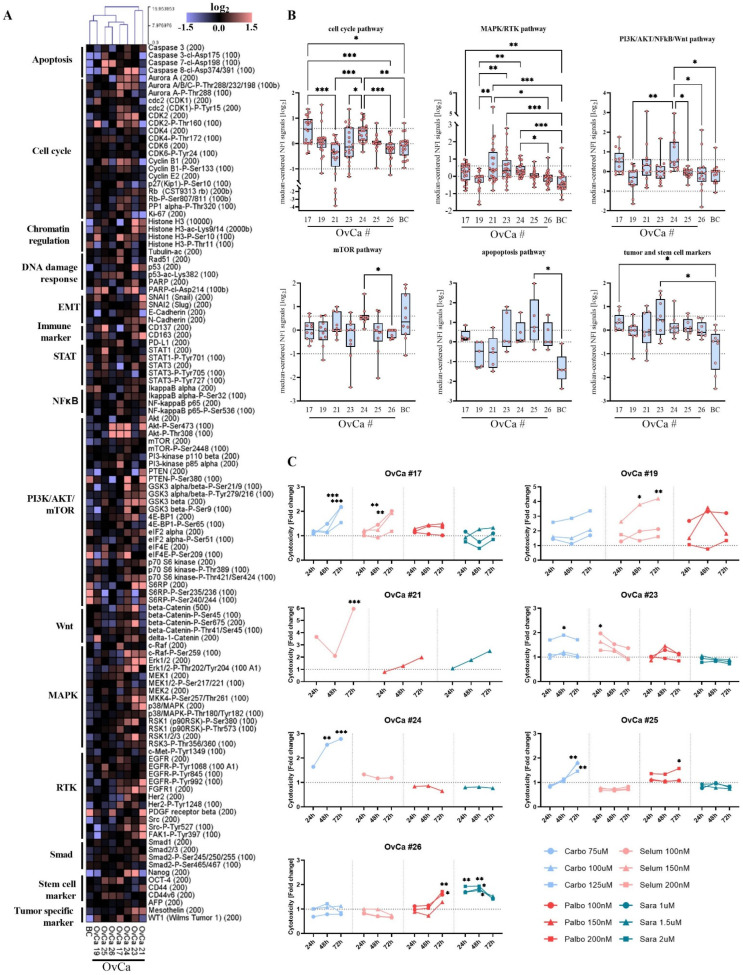
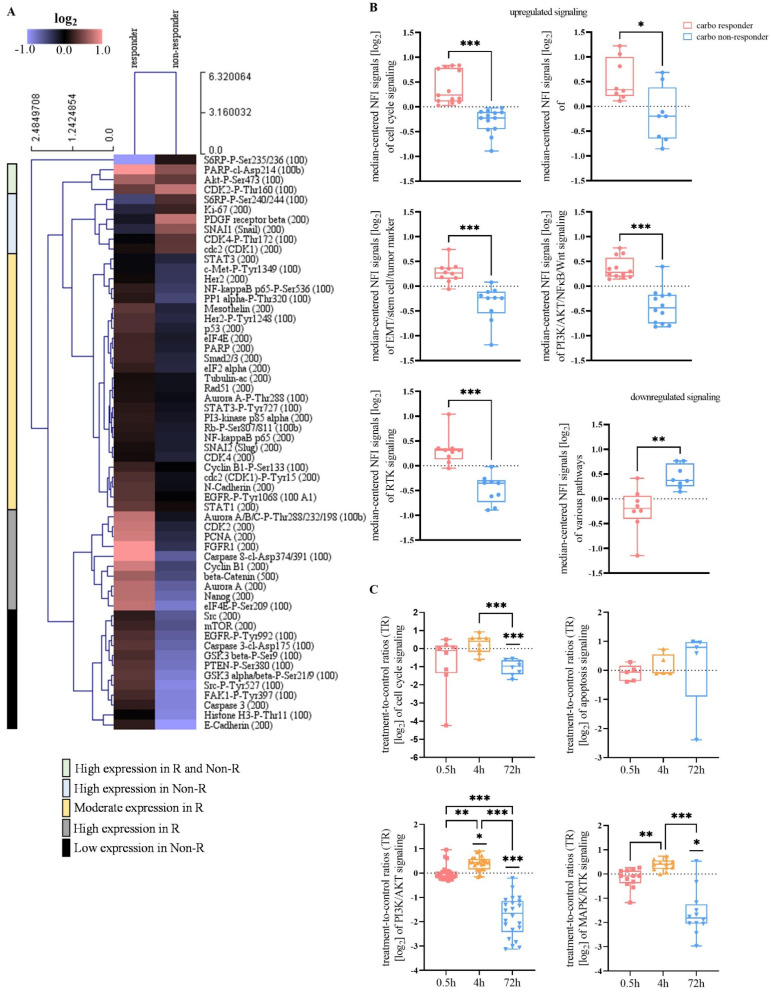
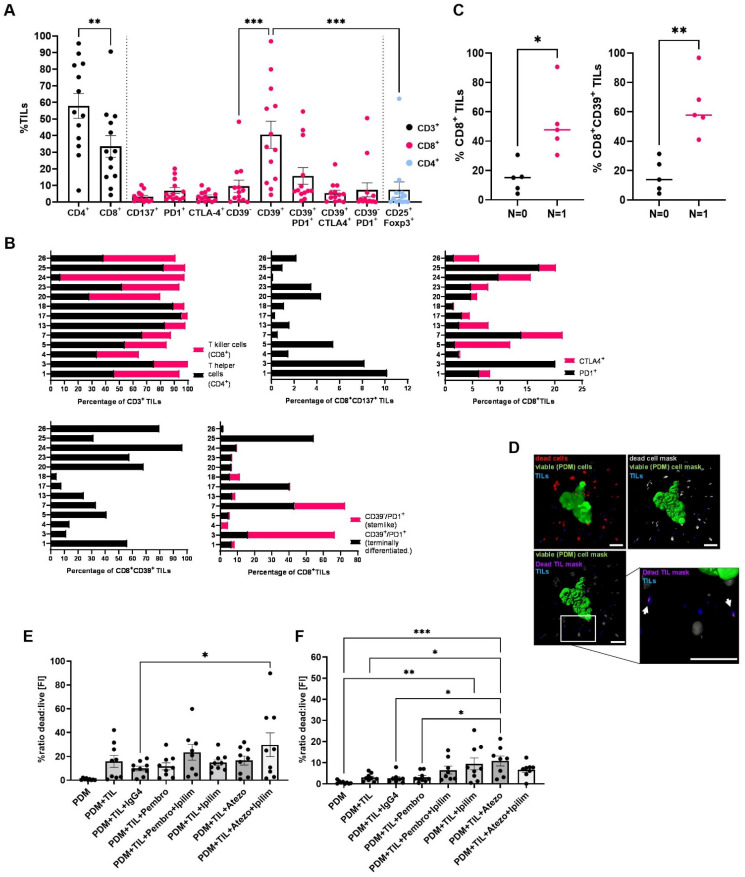
In light of the frequent development of therapeutic resistance in cancer treatment, there is a strong need for personalized model systems representing patient tumor heterogeneity, while enabling parallel drug testing and identification of appropriate treatment responses in individual patients. Using ovarian cancer as a prime example of a heterogeneous tumor disease, we developed a 3D preclinical tumor model comprised of patient-derived microtumors (PDM) and autologous tumor-infiltrating lymphocytes (TILs) to identify individual treatment vulnerabilities and validate chemo-, immuno- and targeted therapy efficacies. Enzymatic digestion of primary ovarian cancer tissue and cultivation in defined serum-free media allowed rapid and efficient recovery of PDM, while preserving histopathological features of corresponding patient tumor tissue. Reverse-phase protein array (RPPA)-analyses of >110 total and phospho-proteins enabled the identification of patient-specific sensitivities to standard, platinum-based therapy and thereby the prediction of potential treatment-responders. Co-cultures of PDM and autologous TILs for individual efficacy testing of immune checkpoint inhibitor treatment demonstrated patient-specific enhancement of cytotoxic TIL activity by this therapeutic approach. Combining protein pathway analysis and drug efficacy testing of PDM enables drug mode-of-action analyses and therapeutic sensitivity prediction within a clinically relevant time frame after surgery. Follow-up studies in larger cohorts are currently under way to further evaluate the applicability of this platform to support clinical decision making.

Keywords: RPPA protein profiling; anti-cancer drug sensitivity; cancer immunotherapy; ovarian cancer; patient-derived tumor model.


Conflict of interest statement

AH received consulting and speaking fees from GSK, AstraZeneca and Clovis. N.A., A.K., B.G., A.-L.K., A.S., S.Y.B., M.P., K.S.-L. and C.S. declare no competing interest.

Figures

Scheme 1
Scheme 1
PDM and TIL isolation from OvCa tumor samples within 3 h after receipt of the tumor sample. Tumor tissue derived from surgical tumor resection is kept in culture media for transportation. Immediately after receipt of the sample, the tissue is mechanically disrupted into smaller pieces and enzymatically digested for 2 h. Afterwards, the digested tissue gets filtered twice using cell strainers. Within the first filtrate, tumor-infiltrating lymphocytes are obtained and are ready for culturing or cryopreservation. From the residue of the second strainer, PDMs are gained and are ready for culturing or cryopreservation. (Created with Biorender.com).
Figure 1
Figure 1
Patient-derived 3D microtumors (PDM) derived from primary OvCa tumor specimen show high viability. (A) Efficiency of isolating OvCa PDM from a total of n = 16 fresh primary OvCa tumor tissues samples. PDM were successfully isolated from n = 14 specimen with a success rate of 87.5%. (B) Viability of OvCa PDM models. Exemplary 2D images from 3D projections of n = 4 OvCa PDM models confirm high viability according to Calcein-AM (viable cells) and SYTOX™ Orange (dead cells) staining. (C) Percentage of viable and dead cells in OvCa PDM. Viability was assessed by an image-based analysis (see SI Methods) in n = 4 OvCa PDM models shown in (B). Data are shown as mean values with SEM from at least n = 3 PDM of each model. *** p < 0.001, multiple paired t-test with Holm-Šídák’s post hoc test. Scale bar 50 µm.
Figure 2
Figure 2
OvCa PDM show histopathological features comparable to corresponding primary tumor tissue. (A) Hematoxylin and Eosin (H&E) as well as immunohistochemical DAB staining of OvCa PDM (FPPE, 3 µm) and corresponding primary tumor tissue (PTT) (Cryosections, 4–6 µm) sections. H&E stainings revealed features of malignant cells (including giant cells with more than one nucleolus, hyperchromatic cells with dark nuclei and high nuclei:cytoplasma ratio) confirming the cancerous origin. Expression of OvCa histotype specific markers (p53, WT1), tumor markers (CA125, MSLN), tumor-associated macrophages (CD163), immune/tumor marker (PD-L1), cancer-associated fibroblasts (FAPα) and extracellular matrix components (Hyaloronan C1QBP, Collagen I) is shown. Scale bars indicate 500 µm for PTT; 50 µm for PDM; 20 µm for magnifications (PTT and PDM). (B) Quantification of IHC stainings for indicated markers within OvCa #17, #18 and #23 PDM and corresponding PTT sections. Shown is the %Area Fraction of positive DAB-stain. For PTT, a minimum of 3 representative regions of interest from tumor areas were used for quantification. * p < 0.1, ** p < 0.01, *** p < 0.001, Two-way ANOVA analysis with Šídák’s multiple comparisons test (α = 0.05). FAPα, cancer-associated fibroblast protein alpha; C1QBP, hyaluronan binding protein; WT1, wilms tumor 1; MSNL, mesothelin.
Figure 3
Figure 3
RPPA protein profiling of OvCa PDM identifies significant differences in active protein signaling pathways as molecular basis for OvCa PDM drug treatment responses. (A) Protein heat map covering 116 analytes analyzed in OvCa PDM (n = 7) and BC PDM (n = 1) generated from sample sizes of n = 100–150 PDM. Protein abundances for each analyte are displayed as median-centered, log2-transformed NFI signals. Samples were subjected to hierarchical clustering using Euclidean distance (complete linkage). (B) Activation state of different pathways in the different OvCa PDM models. Proteins related to an “active” pathway were selected for each of the plotted pathways (see Table S4). Protein signals are shown as median-centered, log2 transformed NFI signals. Dotted lines indicate log2 values of +0.6 (fold change of +1.5) and −1 log2 (fold change of −0.5). Data are shown as box and whiskers plots with minimum and maximum range. * p < 0.05, ** p < 0.01, *** p < 0.001, Kruskal–Wallis test with Dunn’s post hoc test. (C) Cytotoxicity measurement of OvCa PDM treated with standard platinum-based chemotherapy (carbo 75–125 µM) and/or targeted therapy (selum 100–200 nM, palbo 100–200 nM, sara 1–2 µM). Four replicates per treatment with n = 15 PDM per well were performed and measured after 24 h, 48 h and 72 h. Signals were measured as RFU (Relative Fluorescent Unit), background corrected and normalized to vehicle control (DMSO). In case of palbociclib to H2O control. Data are shown as mean values. Statistical significances compared to vehicle control or H2O are shown. * p < 0.05, ** p < 0.01, *** p < 0.001, Two-way ANOVA with Dunnett’s multiple comparison test. Carbo: carboplatin; Selum: selumetinib; Palbo: palbociclib; Sara: saracatenib.
Figure 4
Figure 4
Carboplatin drug response in OvCa PDM correlates with the activity of diverse signaling pathways. (A) Heat map of protein abundances (calculated from median-centered NFI values) averaged over carboplatin-responder (R) and non-responder (Non-R) OvCa PDM. Carboplatin responders and non-responders were grouped according to significant treatment effects from functional compound testing (Figure 3C). Only proteins with >20% increased or decreased abundance between responder and non-responder group were selected. Data was HCL clustered with Euclidean distance (average linkage). (B) Signaling pathway activation in carboplatin-responder vs. non-responder OvCa PDM. Proteins were sorted according to their pathway affiliation and according to upregulation or downregulation within responder group. * p < 0.05, ** p < 0.01, *** p < 0.001, Mann–Whitney-U-test. (C) Proteomic on- and off-target pathway effects in carboplatin-treated (75 µM) OvCa #24 PDM analyzed by RPPA. Treated PDM were analyzed from an immediate (0.5 h), an early (4 h) and a late (72 h) treatment time. For each time point, protein values are displayed as log2-transformed treatment-to-control signal ratios (TR) calculated from NFI signals of treated PDM and corresponding vehicle control (DMSO). Only proteins with >50% differential protein abundance compared to vehicle control were selected. Straight lines above plots indicate statistical significances compared to vehicle control. * p < 0.05, ** p < 0.01, *** p < 0.001, One-way ANOVA using nonparametric Kruskal–Wallis with Dunn’s ad hoc test.
Figure 5
Figure 5
CPI treatment in OvCa PDM-TIL co-cultures increased functional TIL killing capacity. Autologous TIL populations were isolated and expanded from OvCa tissue specimen. (A) Percentages of different TIL populations within CD3-, CD8- and CD4-positive T cells of different models were quantified by multicolor flow cytometry. Data are shown as means ± SEM of at least n = 10 OvCa samples. * p < 0.05, ** p < 0.01, *** p < 0.001, ANOVA with Holm-Šídák’s post hoc test. (B) Phenotypes of extracted TIL populations shown separately for each OvCa model. (C) Percentages of CD8+ and CD8+CD39+ TILs in OvCa patients with lymph node spread (n = 1) and without lymph node spread (n = 0). All points with median are shown. * p < 0.05, ** p < 0.01, Mann–Whitney-U-test. (D) PDM killing effects were measured in an image-based assay format as ratio of fluorescent intensities (FI) of dead cells vs. viable PDM cells. Per treatment n = 3 PDM in three replicates were analyzed. Masks for viable PDM (Calcein-AM staining), dead cells (SYTOX™ Orange dead cell staining) and TILs (CellTracker™ Deep Red staining) were applied using Imaris 8.0 software. Scale bars indicate 50 µm. FI from TILs were subtracted from the total dead FI. (E,F) Killing effects of autologous TILs on corresponding PDM in co-cultures treated with immune checkpoint inhibitors (CPI). TILs of OvCa #24 (E) and #26 (F) were co-cultured with n = 15 PDM using an E:T ratio of 4:1. * p < 0.05, ** p < 0.01, *** p < 0.001, ANOVA with Holm-Šídák’s post hoc test. Pembro: pembrolizumab 60 µg/mL; Ipilim: ipilimumab 50 µg/mL; Atezo: atezolizumab 50 µg/mL.

Similar articles

Cited by

References

    1. Bray F., Ferlay J., Soerjomataram I., Siegel R.L., Torre L.A., Jemal A. Global cancer statistics 2018: Globocan estimates of incidence and mortality worldwide for 36 cancers in 185 countries. CA Cancer J. Clin. 2018;68:394–424. doi: 10.3322/caac.21492. - DOI - PubMed
    1. Izar B., Tirosh I., Stover E.H., Wakiro I., Cuoco M.S., Alter I., Rodman C., Leeson R., Su M.J., Shah P., et al. A single-cell landscape of high-grade serous ovarian cancer. Nat. Med. 2020;26:1271–1279. doi: 10.1038/s41591-020-0926-0. - DOI - PMC - PubMed
    1. The Cancer Genome Atlas Research Network Integrated genomic analyses of ovarian carcinoma. Nature. 2011;474:609–615. doi: 10.1038/nature10166. - DOI - PMC - PubMed
    1. Zhang H., Liu T., Zhang Z., Payne S.H., Zhang B., McDermott J.E., Zhou J.-Y., Petyuk V.A., Chen L., Ray D., et al. Integrated proteogenomic characterization of human high-grade serous ovarian cancer. Cell. 2016;166:755–765. doi: 10.1016/j.cell.2016.05.069. - DOI - PMC - PubMed
    1. Verduin M., Hoeben A., De Ruysscher D., Vooijs M. Patient-derived cancer organoids as predictors of treatment response. Front. Oncol. 2021;11:641980. doi: 10.3389/fonc.2021.641980. - DOI - PMC - PubMed

LinkOut - more resources