. 2022 Jun 16;14(12):2981.
doi: 10.3390/cancers14122981.

Oncogenic Signalling of PEAK2 Pseudokinase in Colon Cancer

Affiliations

Oncogenic Signalling of PEAK2 Pseudokinase in Colon Cancer

Céline Lecointre et al. Cancers (Basel). .

Abstract

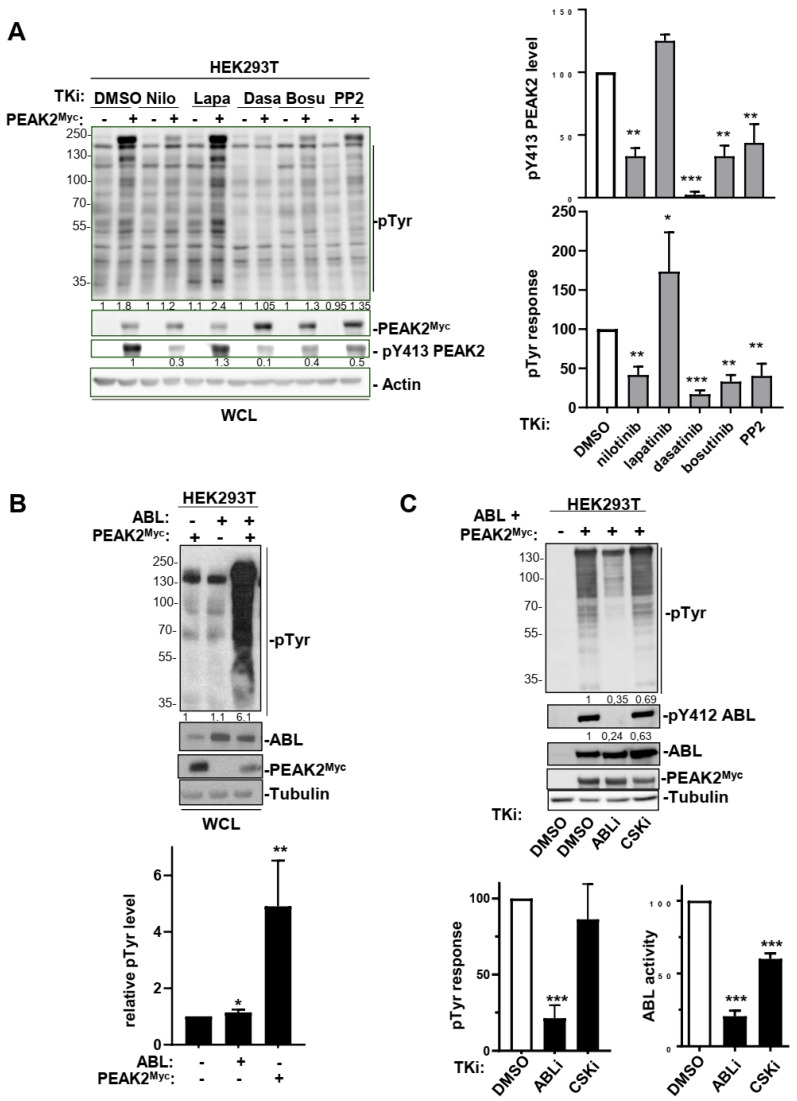
The PEAK family pseudokinases are essential components of tyrosine kinase (TK) pathways that regulate cell growth and adhesion; however, their role in human cancer remains unclear. Here, we report an oncogenic activity of the pseudokinase PEAK2 in colorectal cancer (CRC). Notably, high PRAG1 expression, which encodes PEAK2, was associated with a bad prognosis in CRC patients. Functionally, PEAK2 depletion reduced CRC cell growth and invasion in vitro, while its overexpression increased these transforming effects. PEAK2 depletion also reduced CRC development in nude mice. Mechanistically, PEAK2 expression induced cellular protein tyrosine phosphorylation, despite its catalytic inactivity. Phosphoproteomic analysis identified regulators of cell adhesion and F-actin dynamics as PEAK2 targets. Additionally, PEAK2 was identified as a novel ABL TK activator. In line with this, PEAK2 expression localized at focal adhesions of CRC cells and induced ABL-dependent formation of actin-rich plasma membrane protrusions filopodia that function to drive cell invasion. Interestingly, all these PEAK2 transforming activities were regulated by its main phosphorylation site, Tyr413, which implicates the SRC oncogene. Thus, our results uncover a protumoural function of PEAK2 in CRC and suggest that its deregulation affects adhesive properties of CRC cells to enable cancer progression.

Keywords: actin cytoskeleton; cell migration; cell signalling; colorectal cancer; oncogene; phosphoproteomic; pseudokinase.


Conflict of interest statement

The authors declare no conflict of interest.

Figures

Figure 1
Figure 1
PEAK2 expression and tyrosine phosphorylation in CRC. (A,B): PEAK2 protein levels and Y413 phosphorylation in established CRC cell lines (A) and patient-derived CRC lines (B). Left panel: Western blotting showing the levels of PEAK2, pY413 PEAK2, SRC, and pY418 SRC from indicated CRC cell lines and CRC patient-derived lines. Right: correlation between the mean (n = 3) of relative pY413 PEAK2 level (fold control) and relative SKF activity (pY418 SRC level, fold control) from indicated CRC or CTC cells. (C) Patients with CRC showing high PRAG1 expression have shorter free recurrence survival (FRS). Kaplan–Meier analysis using data from 205 patients with stage III CRC subdivided according to the tumour PRAG1 expression level (high/low) (p-value: 0.0450).
Figure 2
Figure 2
PEAK2 regulates CRC cell morphology and invasion. PEAK2 depletion by shRNA inhibits CRC cell growth and invasion. (A) Cellular protein tyrosine phosphorylation and PEAK2 level in CRC cells transduced with indicated shRNA (left: a representative example, right: quantification). (B) Morphology of CRC cells transduced with indicated shRNA (left: a representative example, right: quantification of the % of elongated cells). (C) Invasion of CRC cells transduced with indicated shRNA in Boyden chambers coated with matrigel (left: presentative image, right: quantification of number of invaded cells). Mean ± SEM; n = 3; * p < 0.05; ** p < 0.01; *** p < 0.001 (Student’s t-test).
Figure 3
Figure 3
PEAK2 depletion reduces CRC cell growth and tumour development. (A) Anchorage-independent growth in soft agar of CRC cells expressing shRNA control (shCtrl) or shRNA PEAK2 (shPEAK2) (left: representative example; right: quantification of colonies obtained in soft-agar. (B,C) Tumour development in nude mice subcutaneously inoculated with indicated CRC cells that were transduced with shRNA control (shCtrl) or shRNA PEAK2 (shPEAK2). Is shown a representative example of tumours obtained in nude mice, the time-course of tumour development (volume) and the tumour mass; mean ± SEM from 13 (B) and 17 (C) mice per condition (* p < 0.05; ** p < 0.01; *** p < 0.001) (Student’s t-test).
Figure 4
Figure 4
PEAK2 expression promotes CRC cell growth, adhesion and invasion. (A) PEAK2 expression increases growth of HCT116 CRC cells. Is shown the cellular protein tyrosine phosphorylation, PEAK2 protein levels and anchorage independent growth of HCT116 cells transduced with indicated PEAK2 constructs. The quantification of protein tyrosine phosphorylation and colonies formation in soft agar (% control) is shown from 3 independent experiments. (B) SRC expression promotes PEAK2 oncogenic function in SW620 CRC cells. Protein tyrosine phosphorylation, PEAK2 protein level and phosphorylation on Y413 and colonies formation in soft-agar of SW620 cells that were coinfected with SRC, PEAK2Myc or control viruses (mock, PMX) as shown. The relative quantification of pY413 PEAK2 levels and colonies formation is shown from 3 independent experiments. (C) Adhesion on fibronectin and invasion in matrigel of indicated SW620 cells. Is shown the mean ± SEM; n = 3–4 * p < 0.05; ** p < 0.01; *** p < 0.001 (Student’s t-test).
Figure 5
Figure 5
Phosphoproteomic analyses identified ABL as a novel PEAK2 target. (A) Workflow of the phosphoproteomic analysis of PEAK2 signalling in HEK293T cells. (B) Heatmap of phosphotyrosine peptides that show a log2 fold change (FC) ≥ 1.5 upon PEAK2Myc expression in 2 out 3 biological independent experiments. Missing values are shown in black. (C) PEAK2 induces ABL tyrosine phosphorylation and activation. (D) ABL induces PEAK2 phosphorylation on Y413. The levels of PEAK2Myc, ABL, pY413 PEAK2, and pY412 ABL in HEK293T cells transfected with indicated reagents are shown. Right panels represent the relative quantification of indicated signals (mean ± SEM; n = 3–4; * p < 0.05; Student’s t-test).
Figure 6
Figure 6
An interplay between ABL and PEAK2 activity. (A) Protein tyrosine phosphorylation induced by PEAK2 expression is diminished upon ABL pharmacological inhibition. Is shown the level of protein tyrosine phosphorylation of HEK293T cells transfected with PEAK2Myc and treated for 2 h with indicated TK inhibitors (0.1% DMO; nilotinib, dasatinib and bosutinib: 100 nM; PP2 and lapatinib: 5 μM). The levels of PEAK2Myc, pY413 PEAK2 and protein tyrosine phosphorylation (pTyr). Right panels represent the relative quantification of indicated signals (mean ± SEM; n = 3; * p < 0.05; ** p < 0.01; *** p < 0.001 Student’s t-test). (B) ABL activity potentiates PEAK2Myc-induced protein tyrosine phosphorylation in HEK293T cells. (C) CSK does not play a major role in this activation process. Transfected cells were treated for 3 h with indicated TK inhibitors (ABLi nilotinib: 100 nM; CSKi: 100 nM). Bottom panels represent the relative quantification of indicated signals (mean ± SEM; n = 3; * p < 0.05; ** p < 0.01; *** p < 0.001 Student’s t-test).
Figure 7
Figure 7
PEAK2 induces ABL-dependent folipodia in CRC cells. (A) PEAK2 colocalizes with F-actin structures at focal adhesion of CRC cells. Immunostaining of PEAK2 and F-actin in SW480 cells expressing indicated PEAK2Myc constructs that were seeded on fibronectin. (B,C) PEAK2 induces ABL-dependent filopodia. A representative example (B) and quantification (C) of filopodia in HCT116 transfected with indicated PEAK2Myc constructs and treated with DMSO (0.1%) or ABLi (100 nM nilotinib) as indicated for 2 h before cell fixation; mean ± SEM; n = 3; ** p < 0.01; *** p < 0.001 Student’s t-test).

References

    1. Brenner H., Kloor M., Pox C.P. Colorectal Cancer. Lancet. 2014;383:1490–1502. doi: 10.1016/S0140-6736(13)61649-9. - DOI - PubMed
    1. Sveen A., Kopetz S., Lothe R.A. Biomarker-Guided Therapy for Colorectal Cancer: Strength in Complexity. Nat. Rev. Clin. Oncol. 2020;17:11–32. doi: 10.1038/s41571-019-0241-1. - DOI - PMC - PubMed
    1. Guinney J., Dienstmann R., Wang X., de Reyniès A., Schlicker A., Soneson C., Marisa L., Roepman P., Nyamundanda G., Angelino P., et al. The Consensus Molecular Subtypes of Colorectal Cancer. Nat. Med. 2015;21:1350–1356. doi: 10.1038/nm.3967. - DOI - PMC - PubMed
    1. Dienstmann R., Vermeulen L., Guinney J., Kopetz S., Tejpar S., Tabernero J. Consensus Molecular Subtypes and the Evolution of Precision Medicine in Colorectal Cancer. Nat. Rev. Cancer. 2017;17:79–92. doi: 10.1038/nrc.2016.126. - DOI - PubMed
    1. Yaeger R., Chatila W.K., Lipsyc M.D., Hechtman J.F., Cercek A., Sanchez-Vega F., Jayakumaran G., Middha S., Zehir A., Donoghue M.T.A., et al. Clinical Sequencing Defines the Genomic Landscape of Metastatic Colorectal Cancer. Cancer Cell. 2018;33:125–136.e3. doi: 10.1016/j.ccell.2017.12.004. - DOI - PMC - PubMed