. 2022 Jun 3;12(6):782.
doi: 10.3390/biom12060782.

Filterability of Erythrocytes in Patients with COVID-19

Affiliations

Filterability of Erythrocytes in Patients with COVID-19

Dmitry S Prudinnik et al. Biomolecules. .

Abstract

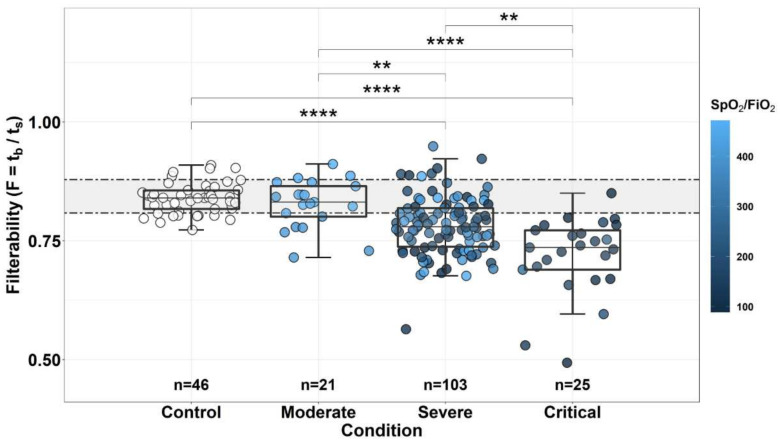
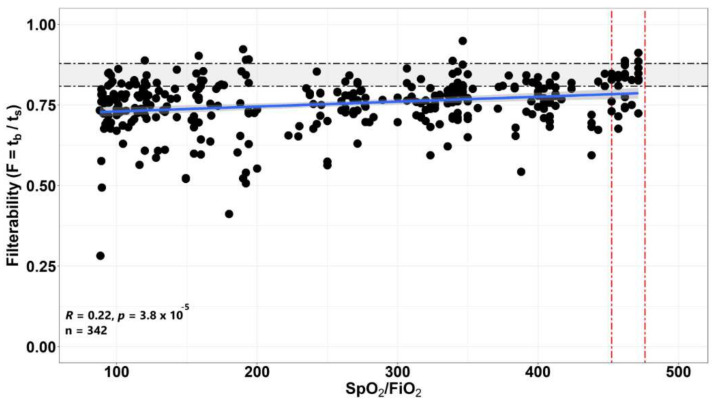
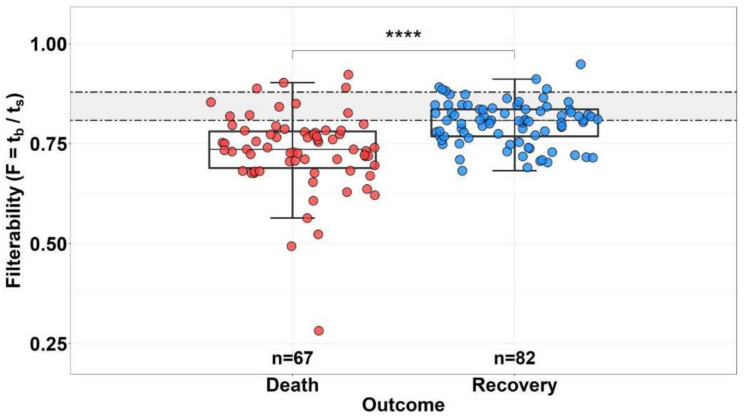
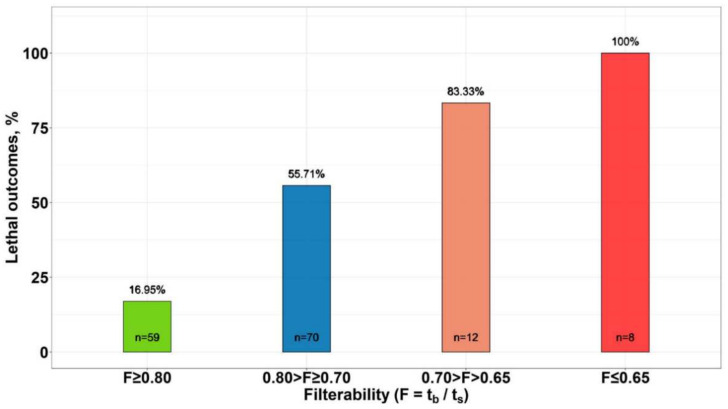
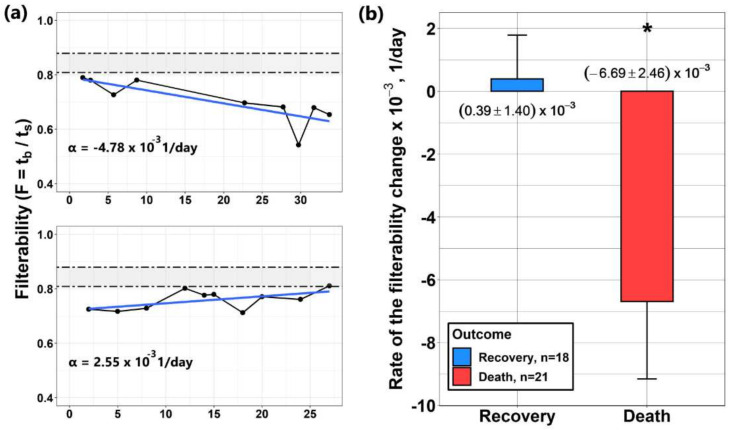
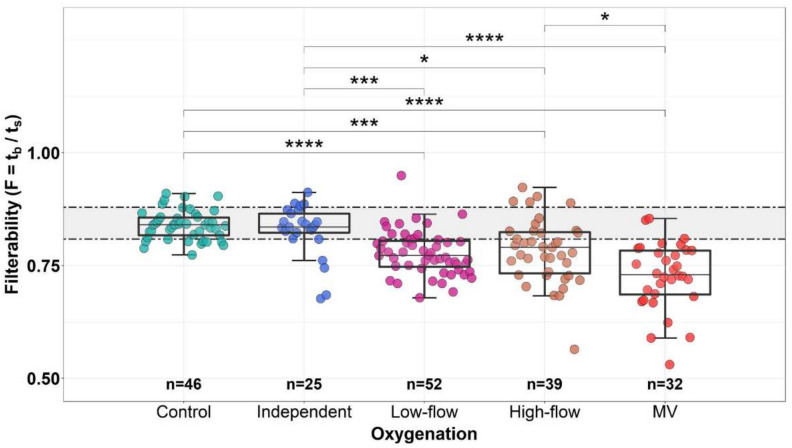
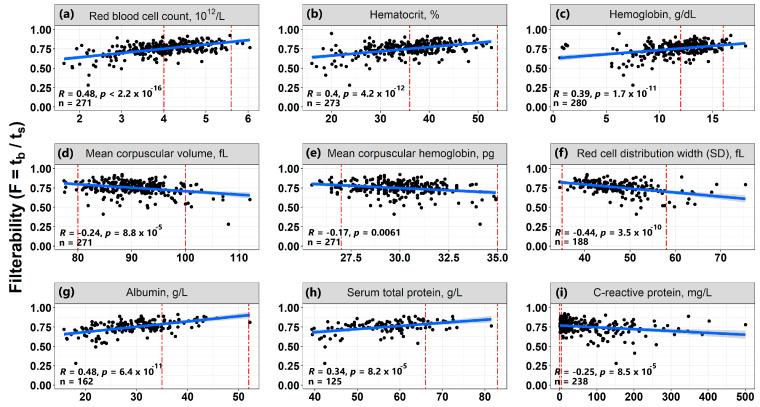
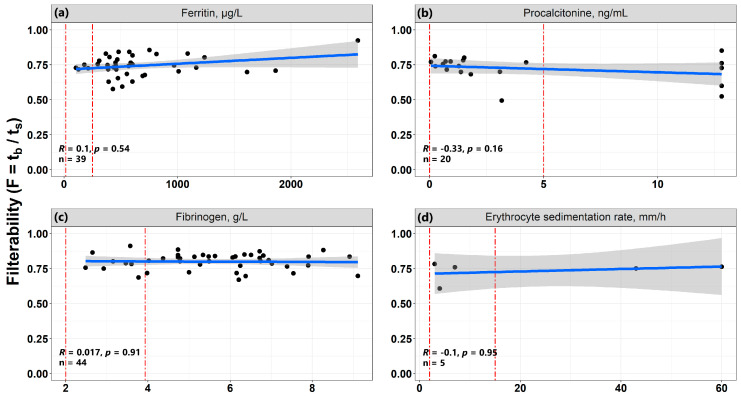
For the first time, the influence of COVID-19 on blood microrheology was studied. For this, the method of filtering erythrocytes through filters with pores of 3.5 μm was used. Filterability was shown to significantly decrease with the increasing severity of the patient's condition, as well as with a decrease in the ratio of hemoglobin oxygen saturation to the oxygen fraction in the inhaled air (SpO2/FiO2). The filterability of ≤ 0.65, or its fast decrease during treatment, were indicators of a poor prognosis. Filterability increased significantly with an increase in erythrocyte count, hematocrit and blood concentrations of hemoglobin, albumin, and total protein. The effect of these parameters on the erythrocyte filterability is directly opposite to their effect on blood macrorheology, where they all increase blood viscosity, worsening the erythrocyte deformability. The erythrocyte filterability decreased with increasing oxygen supply rate, especially in patients on mechanical ventilation, apparently not due to the oxygen supplied, but to the deterioration of the patients' condition. Filterability significantly correlates with the C-reactive protein, which indicates that inflammation affects the blood microrheology in the capillaries. Thus, the filterability of erythrocytes is a good tool for studying the severity of the patient's condition and his prognosis in COVID-19.

Keywords: COVID-19; SpO2/FiO2 ratio; additional oxygenation; dynamics of filterability alteration; erythrocyte; filterability; inflammation.


Conflict of interest statement

The authors declare no conflict of interest.

Figures

Figure 1
Figure 1
Dependence of erythrocyte filterability on the severity of the patient’s condition. Control—control group, Moderate—a condition of moderate severity, Severe—a serious condition, Critical—a condition of extreme severity. In addition, each represented point is automatically colored according to the SpO2/FiO2 ratio for given measurement (see the color scale to the right of the figure). The significance of the differences between the groups was calculated using the Kruskal–Wallis H-test and post-hoc Dunn’s test with Bonferroni correction. Horizontal dotted lines show the boundaries of normal filterability values. The box sizes correspond to the range comprising from 25 to 75 percentiles of all measured values. Medians are indicated by horizontal lines, and the length of the whiskers corresponds to the 1.5 interquartile range. The p values for the significance of the differences are shown in the figure: ** p < 0.01 and **** p < 0.0001.
Figure 2
Figure 2
Correlation of RBC filterability in patients with COVID-19 with the value of the SpO2/FiO2 ratio, where SpO2 in each case is directly measured by a pulse oximeter, and FiO2 for each point corresponds to the proportion of oxygen in the inhaled mixture (for atmospheric air FiO2 = 0.21, the proportion of oxygen in the inhaled air at different oxygen flow rates was calculated by the standard method [27]). The gray area represents the confidence interval. Horizontal dotted lines show the boundaries of normal filterability values.
Figure 3
Figure 3
Distribution of RBC filterability in the group of deceased (n = 67) and survivor (n = 82) patients with COVID-19. Horizontal dotted lines indicate the boundaries of normal filterability values. **** The difference between the groups is significant (p < 0.0001).
Figure 4
Figure 4
The percentage of deaths in groups of patients with different filterability of erythrocytes (F). The filterability levels in the groups were equal to: F ≥ 0.80; 0.80 > F ≥ 0.70; 0.70 > F > 0.65 and F ≤ 0.65. The figure shows the number of patients and the percentage of mortality in each group. Existence of a statistically significant relationship between filterability groups and mortality was proved by Fisher’s exact test with Monte Carlo simulation (p = 0.0004998).
Figure 5
Figure 5
Dynamics of changes in the filterability (F) of erythrocytes in COVID-19 patients. (a) Typical examples of the dynamics of changes in the filterability of erythrocytes in two patients, showing that during treatment F can both increase and decrease. Dotted lines indicate the boundaries of normal filterability values. The rates of changes in filterability (α) for each of the patients are given. (b) Averaged rates of change in filterability in groups of surviving and deceased patients. The average values and standard errors of the mean (SEM) are presented. * The difference between the groups is significant (ANOVA, p < 0.05).
Figure 6
Figure 6
Dependence of the filterability of erythrocytes on the rate and mechanism of oxygen supply. Control (a control group of healthy donors) and Independent (patients without additional oxygen, who breathe with atmospheric air on their own)—oxygen fraction is 21%; Low-flow (patients on low-flow oxygenation)—the fraction of oxygen in the inhaled air is 24–35%; High-flow (patients on high-flow oxygenation)—the fraction of oxygen in the inhaled air is 40–100%; MV (patients on invasive mechanical ventilation)—the fraction of oxygen in the inhaled air can be 25–100%. The significance of differences between groups was calculated by the Kruskal–Wallis H-test and post-hoc Dunn’s test with Bonferroni correction. Horizontal dotted lines show the boundaries of normal filterability values. The box sizes correspond to the range comprising from 25 to 75 percentiles of all measured values, and the length of the whiskers corresponds to the 1.5 interquartile range. The p values of the significance of the differences between the groups are shown in the figure: * p < 0.05; *** p < 0.001 and **** p < 0.0001.
Figure 7
Figure 7
Correlations of some laboratory parameters with filterability (F) of RBCs from patients with COVID-19. Correlations F with the following parameters are presented: (a) Red blood cells count; (b) Hematocrit; (c) Hemoglobin; (d) Mean corpuscular volume; (e) Mean corpuscular hemoglobin; (f) RBCs distribution width by volume (as SD of average value); (g) Albumin; (h) Serum total protein; and (i) C-reactive protein. For all correlations, a linear approximation was used, which was characterized by the Spearman correlation coefficient (R). Gray ranges are confidence intervals of approximation line. The vertical red lines show the normal range for each of the parameters.
Figure 8
Figure 8
Correlations of RBC filterability in patients with COVID-19 with some markers of inflammation: (a) Ferritin (n = 39); (b) Procalcitonin (n = 20); (c) Fibrinogen (n = 44); and (d) Erythrocyte sedimentation rate (n = 5). The gray areas are the confidence intervals of the approximating straight line. The vertical red lines show the normal range for each of the parameters.

Similar articles

Cited by

References

    1. COVID-19 Coronavirus Pandemic. Worldometer. [(accessed on 22 April 2022)]. Available online: https://www.worldometers.info/coronavirus/?utm_campaign=homeAdvegas1?%20.
    1. Carsana L., Sonzogni A., Nasr A., Rossi R.S., Pellegrinelli A., Zerbi P., Rech R., Colombo R., Antinori S., Corbellino M., et al. Pulmonary post-mortem findings in a series of COVID-19 cases from northern Italy: A two-centre descriptive study. Lancet Infect. Dis. 2020;20:1135–1140. doi: 10.1016/S1473-3099(20)30434-5. - DOI - PMC - PubMed
    1. Dhont S., Derom E., Van Braeckel E., Depuydt P., Lambrecht B.N. The pathophysiology of ‘happy’ hypoxemia in COVID-19. Respir. Res. 2020;21:198. doi: 10.1186/s12931-020-01462-5. - DOI - PMC - PubMed
    1. Della Rocca D.G., Magnocavallo M., Lavalle C., Romero J., Forleo G.B., Tarantino N., Chimenti C., Alviz I., Gamero M.T., Mario J., et al. Evidence of systemic endothelial injury and microthrombosis in hospitalized COVID-19 patients at different stages of the disease. J. Thromb. Thrombolysis. 2021;51:571–576. doi: 10.1007/s11239-020-02330-1. - DOI - PMC - PubMed
    1. Ackermann M., Verleden S.E., Kuehnel M., Haverich A., Welte T., Laenger F., Vanstapel A., Werlein C., Stark H., Tzankov A., et al. Pulmonary vascular endothelialitis, thrombosis, and angiogenesis in Covid-19. N. Engl. J. Med. 2020;383:120–128. doi: 10.1056/NEJMoa2015432. - DOI - PMC - PubMed

Publication types