. 2022 Jun 8;12(6):804.
doi: 10.3390/biom12060804.

TRPV6 Regulation by Cis-22a and Cholesterol

Affiliations

TRPV6 Regulation by Cis-22a and Cholesterol

Christina Humer et al. Biomolecules. .

Abstract

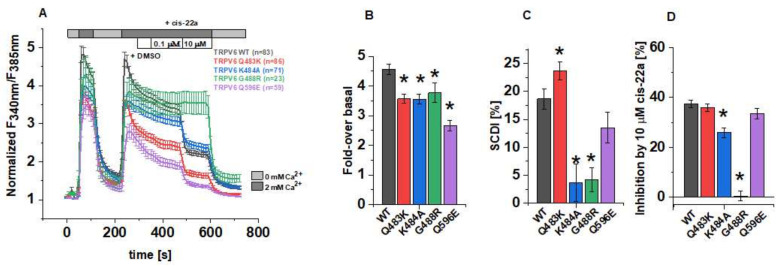
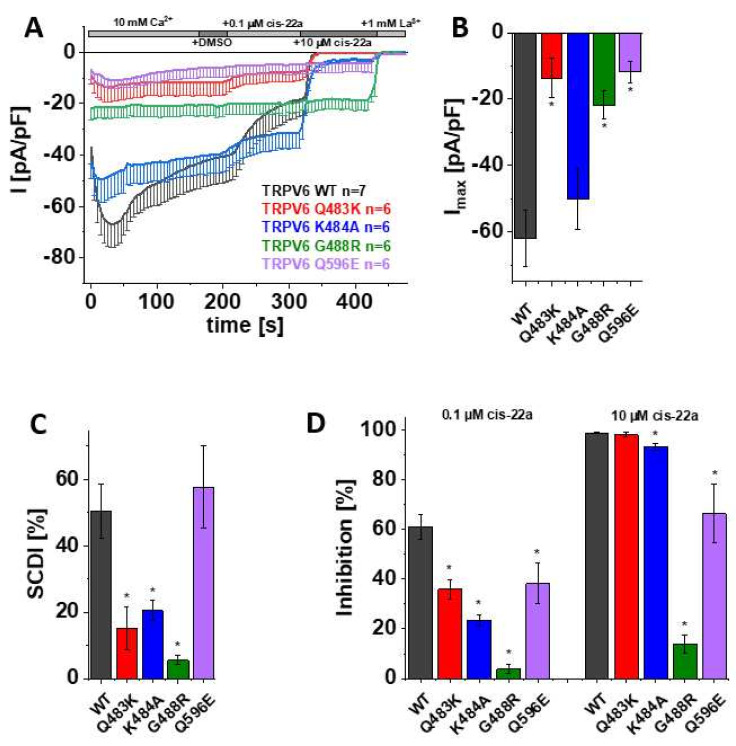
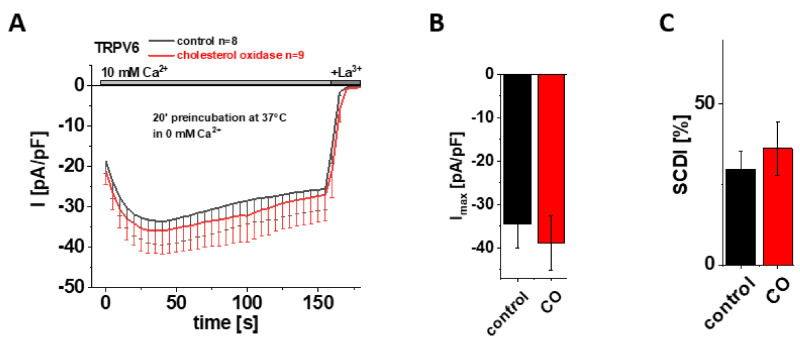
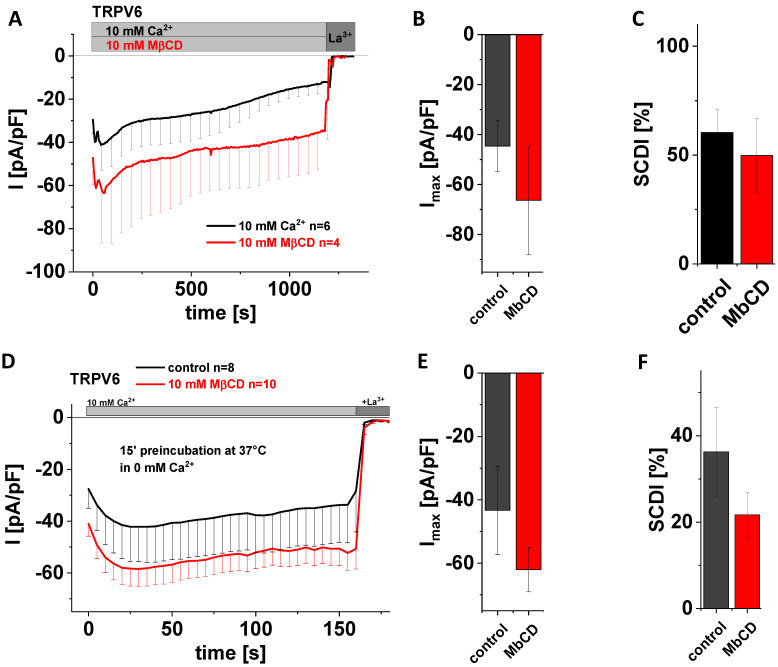
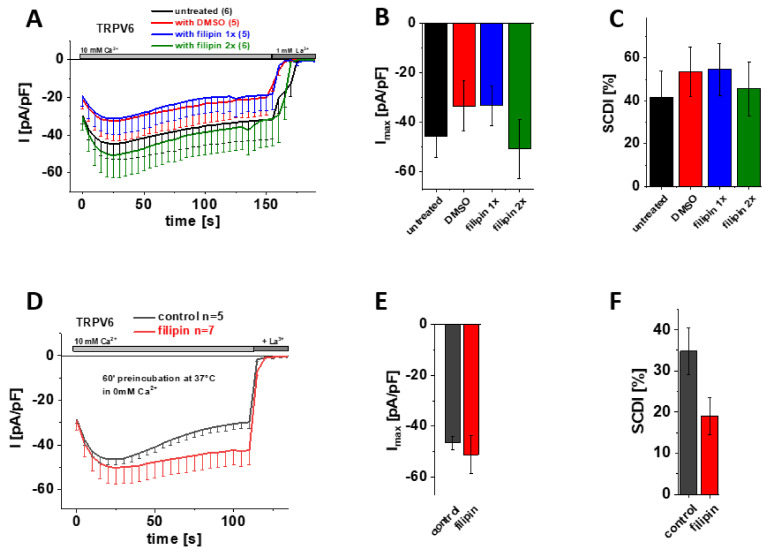
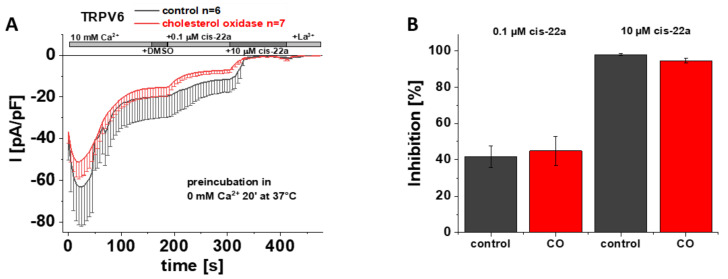
The highly calcium-selective transient receptor potential vanilloid-type channel TRPV6 is important for epithelial Ca2+ transport. Proper regulation of the inherently constitutively active TRPV6 channels is intricate in preserving Ca2+ homeostasis, whereby structural and functional data suggest that lipids hold an essential role. Altered expression levels or specific TRPV6 mutations may lead to diseases, hence, TRPV6 represents an interesting target for pharmacological modulation. Recent cryo-EM data identified that the specific TRPV6 blocker cis-22a binds, apart from the pore, to a site within the tetrameric channel that largely matches a lipid binding pocket, LBS-2. Therein, cis-22a may replace a lipid such as cholesterol that is bound in the open state. Based on site-directed mutagenesis and functional recordings, we identified and characterized a series of residues within LBS-2 that are essential for TRPV6 inhibition by cis-22a. Additionally, we investigated the modulatory potential of diverse cholesterol depletion efforts on TRPV6 activity. While LBS-2 mutants exhibited altered maximum currents, slow Ca2+-dependent inactivation (SCDI) as well as less inhibition by cis-22a, TRPV6 activity was resistant to cholesterol depletion. Hence, lipids other than cholesterol may predominate TRPV6 regulation when the channel is expressed in HEK293 cells.

Keywords: LBS-2; PIP2; TRPV6; cholesterol; lipid; maximum current; slow calcium dependent inactivation (SCDI).


Conflict of interest statement

The authors declare no conflict of interest.

Figures

Figure 1
Figure 1
Functional characterization of TRPV6 mutants in Fura-2 experiments. (A) Changes in the intracellular Ca2+ level of HEK293 cells overexpressing human TRPV6 WT or the respective mutant upon perfusion with Ca2+-free extracellular solution (ECS), 2 mM Ca2+-containing ECS, 0.1 vol% DMSO, 0.1 µM and 10 µM cis-22a in 2 mM Ca2+-containing ECS, as indicated by the bars. Fura-2 emission was monitored in intervals of 10 s upon alternating excitation at 340 nm and 385 nm. After background subtraction, the ratio of the respective emission intensities was determined (F340nm/F385nm) and normalized to the minimum F340nm/F385nm for each cell. Shown are averaged time courses (mean ± SEM) of 23–86 cells, measured on 2-4 days. (B) Block diagram summarizing fold-changes in the intracellular Ca2+ levels at the time point t=250 s according to measurements in (A). (C) Block diagram of the decrease in intracellular Ca2+ from t = 250 s to t = 350 s of the measurements in (A), serving as indicator for the slow Ca2+-dependent inactivation. (D) Block diagram of the inhibition by 10 µM cis-22a in % according to measurements in (A). The asterisk (*) indicates the statistical significance (p < 0.05) in comparison to TRPV6 WT.
Figure 2
Figure 2
Mutations in LBS-2 lead to reduced maximum currents, SCDI and inhibition by cis-22a. (A) Averaged time course of whole-cell currents (mean ± SEM) recorded from HEK 293 cells expressing TRPV6 WT (black), TRPV6 Q483K (red), TRPV6 K484A (blue), TRPV6 G488R (green) and TRPV6 Q596E (purple). Throughout the experiment, application of 10 mM Ca2+ was followed by consecutive addition of DMSO, 0.1 µM cis-22a, 10 µM cis-22a, and 1 mM La3+, as indicated by the grey bars. (B) Block diagram of maximum currents according to measurements in (A). (C) Block diagram of the extent of SCDI in % according to measurements in (A). (D) Block diagram of the extent of inhibition in % by 0.1 µM (left) and 10 µM (right) cis-22a according to measurements in (A). The asterisk (*) indicates the statistical significance (p < 0.05) in comparison to TRPV6 WT.
Figure 3
Figure 3
Preincubation with cholesterol oxidase (CO) has no effect on maximum currents and SCDI of TRPV6 WT. (A) Averaged time course of whole-cell currents (mean ± SEM) recorded from HEK 293 cells expressing TRPV6 WT. Cells were preincubated in 0 mM Ca2+ extracellular solution with (red) and without (control, black) 2 U/mL CO at 37 °C for 20 min. Measurements were carried out in 10 mM Ca2+ extracellular solution and currents were blocked by 1 mM La3+ at the end of the experiments, as indicated by the grey bars. (B) Block diagram of maximum currents according to measurements in (A). (C) Block diagram of the extent of SCDI in % according to measurements in (A). There is no statistical significance (p < 0.05) in comparison to TRPV6 WT.
Figure 4
Figure 4
Application of MβCD has no effect on maximum currents and SCDI of TRPV6 WT. (A) Averaged time course of whole-cell currents (mean ± SEM) recorded from HEK293 cells expressing TRPV6 WT. Measurements were carried out in 10 mM Ca2+ extracellular solution with (red) or without (control, black) 10 mM MβCD and currents were blocked by 1 mM La3+ at the end of the experiments, as indicated by the grey bars. (B) Block diagram of maximum currents according to measurements in (A). (C) Block diagram of the extent of SCDI in % according to measurements in (A). (D) Averaged time course of whole-cell currents (mean ± SEM) recorded from HEK293 cells expressing TRPV6 WT. Cells were preincubated in 0 mM Ca2+ extracellular solution with (red) and without (control, black) 10 mM MβCD at 37 °C for 15 minutes. Measurements were carried out in 10 mM Ca2+ extracellular solution and currents were blocked by 1 mM La3+ at the end of the experiments, as indicated by the grey bars. (E) Block diagram of maximum currents according to measurements in (D). (F) Block diagram of the extent of SCDI in % according to measurements in (D). There is no statistical significance (p < 0.05) in comparison to TRPV6 WT.
Figure 5
Figure 5
Treatment with filipin has no effect on maximum currents and SCDI of TRPV6 WT currents. (A) Averaged time course of whole-cell currents (mean ± SEM) recorded from HEK293 cells expressing TRPV6 WT. Cells were treated with DMSO (control, red), with 1 µg/µL filipin upon transfection (blue, filipin 1x) or with 1 µg/µL filipin upon transfection and media exchange (green, filipin 2x). Untreated cells (black) were taken as an additional control. Measurements were carried out in 10 mM Ca2+ extracellular solution and currents were blocked by 1 mM La3+ at the end of the experiments, as indicated by the grey bars. (B) Block diagram of maximum currents according to measurements in (A). (C) Block diagram of the extent of SCDI in % according to measurements in (A). (D) Averaged time course of whole-cell currents (mean ± SEM) recorded from HEK293 cells expressing TRPV6 WT. Cells were preincubated in 0 mM Ca2+ extracellular solution with (red) and without (control, black) 1 µg/µL filipin at 37 °C for 60 minutes. Measurements were carried out in 10 mM Ca2+ extracellular solution and currents were blocked by 1 mM La3+ at the end of the experiments, as indicated by the grey bars. (E) Block diagram of maximum currents according to measurements in (D). (F) Block diagram of the extent of SCDI in % according to measurements in (D).
Figure 6
Figure 6
Preincubation with cholesterol oxidase has no effect on TRPV6 WT inhibition by cis-22a. (A) Averaged time course of whole-cell currents (mean ± SEM) recorded from HEK293 cells expressing TRPV6 WT. Cells were preincubated in 0 mM Ca2+ extracellular solution with (red) and without (control, black) 2 U/mL CO at 37 °C for 20 minutes. Throughout the experiment, application of 10 mM Ca2+ was followed by consecutive addition of DMSO, 0.1 µM cis-22a, 10 µM cis-22a and 1 mM La3+, as indicated by the grey bars. (B) Block diagram of the extent of inhibition in % by 0.1 µM (left) and 10 µM (right) cis-22a according to the measurements in (A). There is no statistical significance (p < 0.05) in comparison with TRPV6 WT.

Similar articles

Cited by

References

    1. Bootman M.D. Calcium signaling. Cold Spring Harb. Perspect. Biol. 2012;4:a011171. doi: 10.1101/cshperspect.a011171. - DOI - PMC - PubMed
    1. Bootman M.D., Bultynck G. Fundamentals of Cellular Calcium Signaling: A Primer. Cold Spring Harb. Perspect. Biol. 2020;12:a038802. doi: 10.1101/cshperspect.a038802. - DOI - PMC - PubMed
    1. Berridge M.J., Lipp P., Bootman M.D. The versatility and universality of calcium signalling. Nat. Rev. Mol. Cell Biol. 2000;1:11–21. doi: 10.1038/35036035. - DOI - PubMed
    1. Nilius B., Vennekens R., Prenen J., Hoenderop J.G.J., Droogmans G., Bindels R.J.M. The Single Pore Residue Asp542 Determines Ca2+ Permeation and Mg2+ Block of the Epithelial Ca2+ Channel*. J. Biol. Chem. 2001;276:1020–1025. doi: 10.1074/jbc.M006184200. - DOI - PubMed
    1. Vennekens R., Hoenderop J.G.J., Prenen J., Stuiver M., Willems P.H.G.M., Droogmans G., Nilius B., Bindels R.J.M. Permeation and Gating Properties of the Novel Epithelial Ca2+ Channel*. J. Biol. Chem. 2000;275:3963–3969. doi: 10.1074/jbc.275.6.3963. - DOI - PubMed

Publication types