. 2022 Jun 20;12(6):856.
doi: 10.3390/biom12060856.

Phosphatidylinositol Monophosphates Regulate the Membrane Localization of HSPA1A, a Stress-Inducible 70-kDa Heat Shock Protein

Affiliations

Phosphatidylinositol Monophosphates Regulate the Membrane Localization of HSPA1A, a Stress-Inducible 70-kDa Heat Shock Protein

Larissa Smulders et al. Biomolecules. .

Abstract

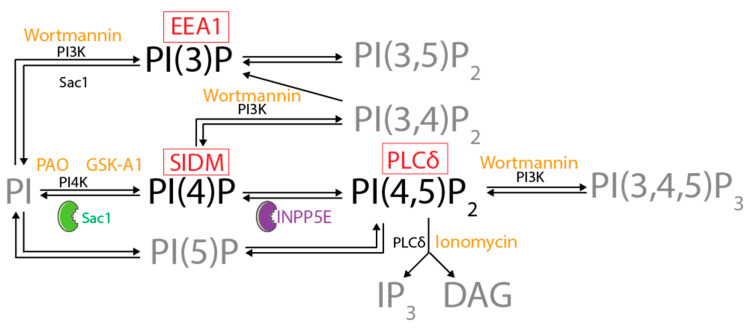
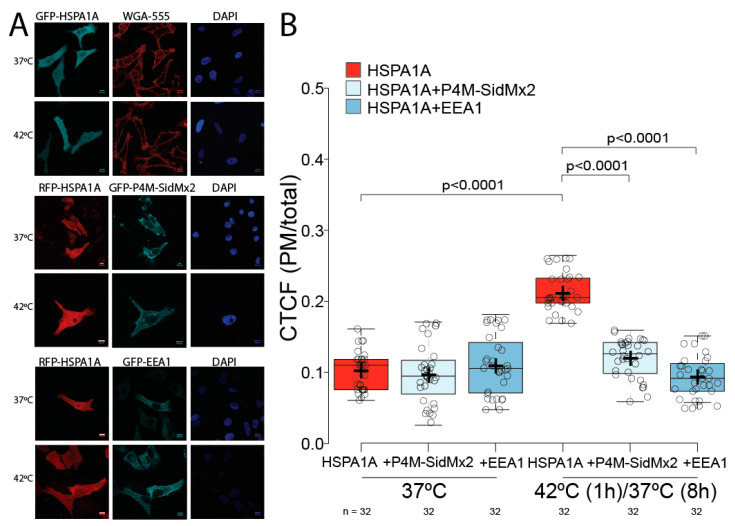
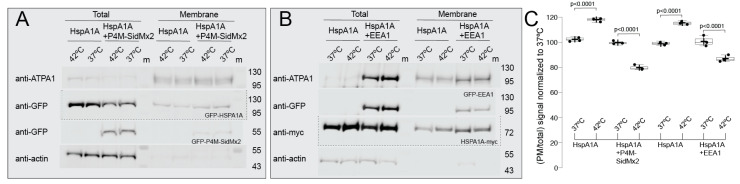
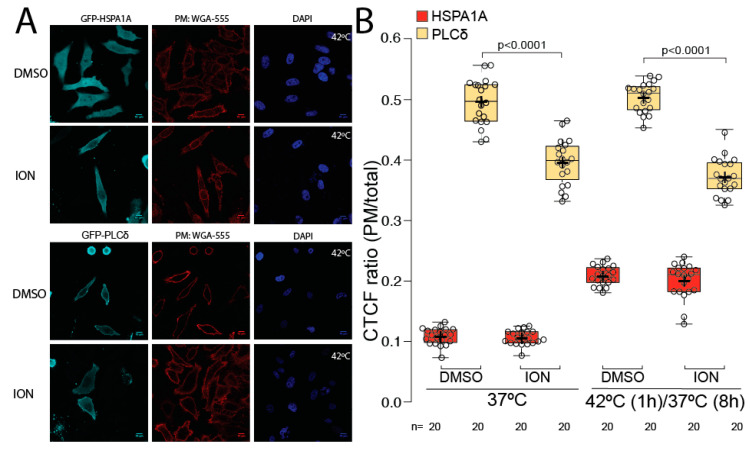
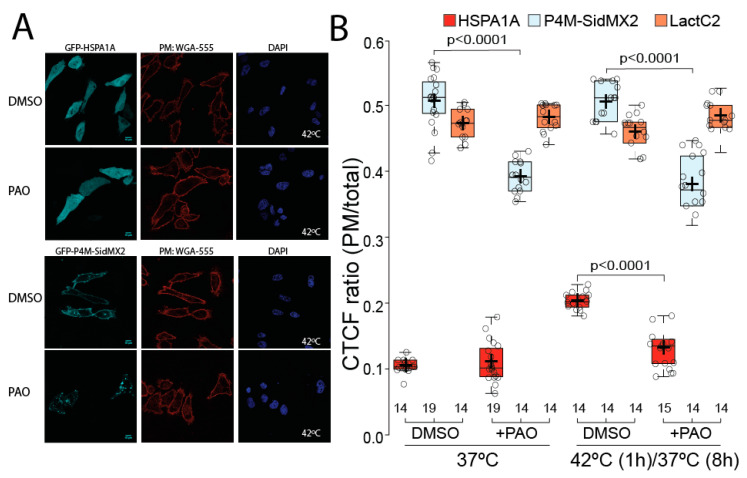
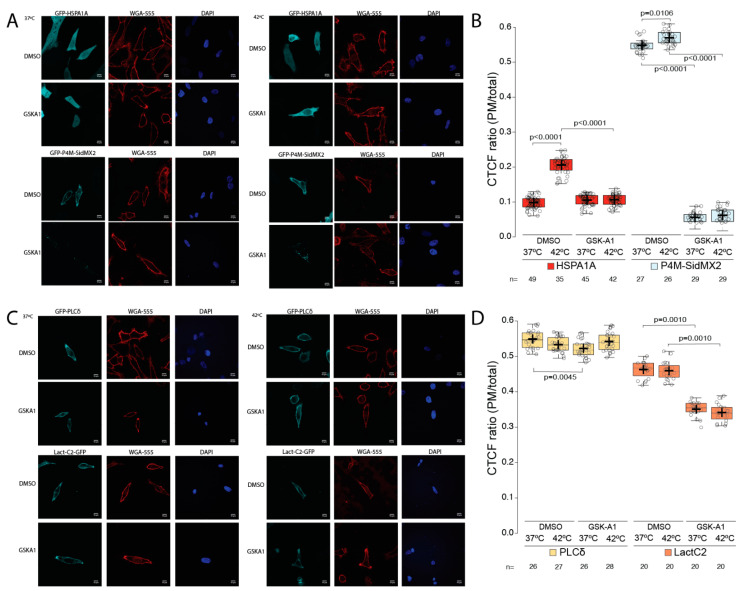
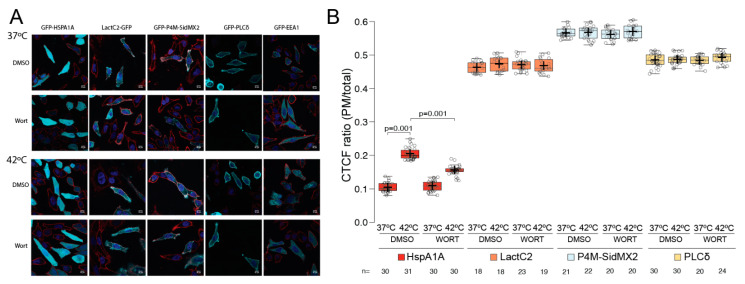
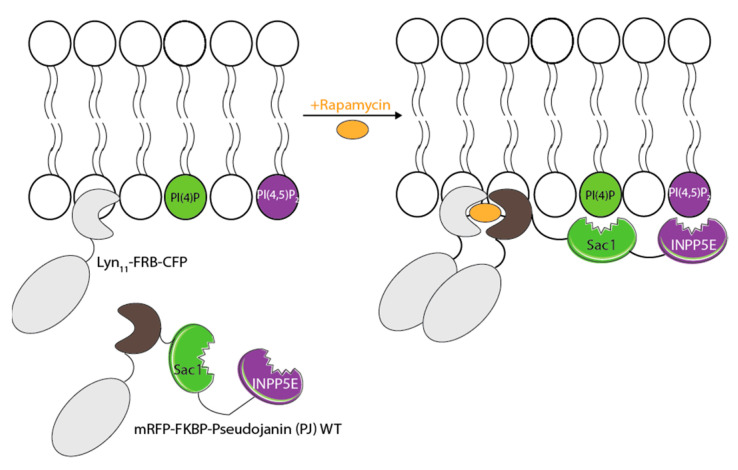
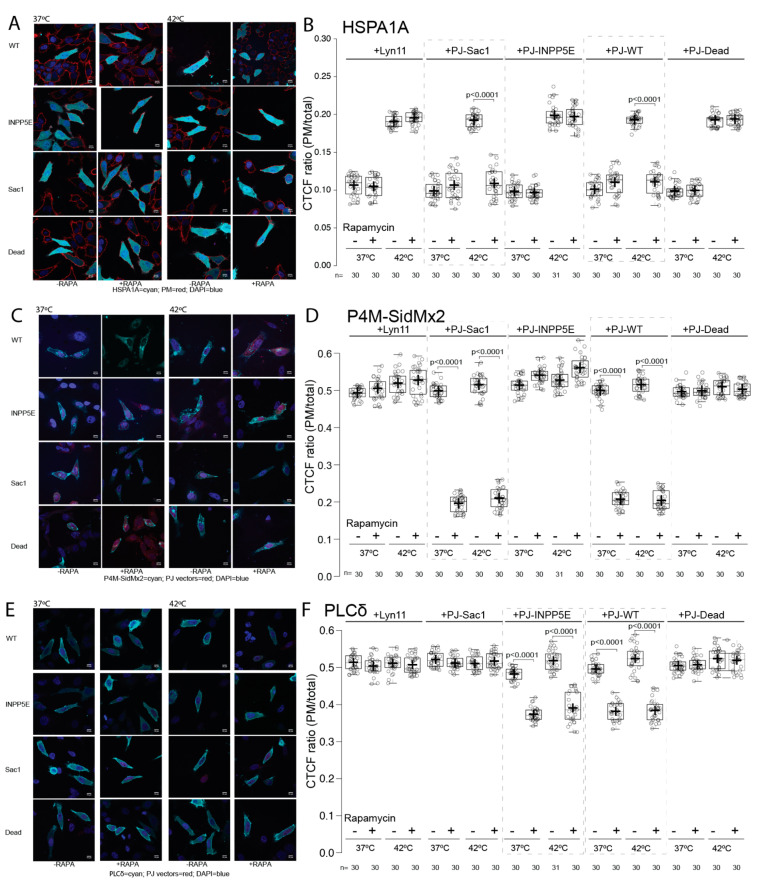
HSPA1A is a molecular chaperone that regulates the survival of stressed and cancer cells. In addition to its cytosolic pro-survival functions, HSPA1A also localizes and embeds in the plasma membrane (PM) of stressed and tumor cells. Membrane-associated HSPA1A exerts immunomodulatory functions and renders tumors resistant to standard therapies. Therefore, understanding and manipulating HSPA1A's surface presentation is a promising therapeutic. However, HSPA1A's pathway to the cell surface remains enigmatic because this protein lacks known membrane localization signals. Considering that HSPA1A binds to lipids, like phosphatidylserine (PS) and monophosphorylated phosphoinositides (PIPs), we hypothesized that this interaction regulates HSPA1A's PM localization and anchorage. To test this hypothesis, we subjected human cell lines to heat shock, depleted specific lipid targets, and quantified HSPA1A's PM localization using confocal microscopy and cell surface biotinylation. These experiments revealed that co-transfection of HSPA1A with lipid-biosensors masking PI(4)P and PI(3)P significantly reduced HSPA1A's heat-induced surface presentation. Next, we manipulated the cellular lipid content using ionomycin, phenyl arsine oxide (PAO), GSK-A1, and wortmannin. These experiments revealed that HSPA1A's PM localization was unaffected by ionomycin but was significantly reduced by PAO, GSK-A1, and wortmannin, corroborating the findings obtained by the co-transfection experiments. We verified these results by selectively depleting PI(4)P and PI(4,5)P2 using a rapamycin-induced phosphatase system. Our findings strongly support the notion that HSPA1A's surface presentation is a multifaceted lipid-driven phenomenon controlled by the binding of the chaperone to specific endosomal and PM lipids.

Keywords: cell surface; heat-shock proteins; lipids; pharmacology; phosphoinositide; plasma membrane.


Conflict of interest statement

The authors declare no conflict of interest.

Figures

Figure 1
Figure 1
Diagram representing the pathway by which the different phosphorylated forms of phosphatidylinositol are interconverted. The kinase and phosphatase reactions are indicated with black arrows. The two enzymes (Sac1 and INPP5E) used in this study are shown in green and purple. Sac1 dephosphorylates PI(4)P into PI, and inositol polyphosphate 5-phosphatase E (INPP5E) converts PI(4,5)P2 to PI(4)P. The inhibitors and drugs used to manipulate specific reactions are indicated in orange on top of the affected enzyme. These included ionomycin that depletes PI(4,5)P2, phenyl arsine oxide and GSK-A1 that deplete PI(4)P, and wortmannin that depletes PI(3)P [32,33,34]. The biosensors used to mask specific lipids are shown in red boxes on top of the lipid they each bind. These included the PI(4)P binding protein P4M-SidMx2 (SIDM), the PI(3)P-biosensor EEA1 (EEA1), and the PI(4,5)P2-biosensor PLCδ-PH (PLCδ). For convenience, only reactions and lipid species manipulated in this study are shown in black. The information presented stems from [35,36].
Figure 2
Figure 2
HSPA1A’s PM localization significantly decreases when PI(4)P and PI(3)P are masked by the biosensors P4M-SidMx2 and EEA1. (A) Representative images of HeLa cells expressing GFP-HSPA1A stained with WGA-FA555 PM stain and DAPI nucleus stain (top panels). Representative images of the co-expression of RFP-HSPA1A with GFP-P4M-SidMx2 (middle panels) and RFP-HSPA1A with GFP-EEA1 (bottom panels). The localization of HSPA1A was documented for all transfections at either control conditions (37 °C; top row of each panel) or heat-shocked conditions (1 h at 42 °C followed by 8 h at 37 °C; bottom row of each panel). Scale bar = 10 μm. (B) Quantification of the corrected total cell fluorescence (CTCF) as a ratio between the total HSPA1A fluorescence of the PM and the rest of the cell at control conditions and after heat shock in the presence or absence of lipid biosensors. The experiment was repeated three times, and the total number of cells (shown as open circles) per condition are shown at the bottom of the graph. The center lines show the medians; box limits indicate the 25th and 75th percentiles as determined by R software; whiskers extend 1.5 times the interquartile range from the 25th and 75th percentiles; crosses represent sample means.
Figure 3
Figure 3
Cell surface biotinylation reveals that HSPA1A’s PM embedding significantly decreases in the presence of biosensors masking PI(4)P and PI(3)P. Representative cropped Western blots showing the total and biotinylated fractions of HEK293 cell lysates transfected with (A) GFP-HSPA1A and eGFP (see Supplemental Figure S1 for complete blots), and GFP-HSPA1A and GFP-P4M-SidMx2, (B) HSPA1A-myc and eGFP (see Supplemental Figure S1 for complete blots), and HSPA1A-myc and GFP-EEA1. HSPA1A is shown in (A) at the anti-GFP panel and in (B) at the anti-myc panel. Native actin and ATP1A1 were used a cytosolic and membrane controls, respectively. P4M-SidMx2 is visible in (A) at the bottom anti-GFP panel and EEA1 at the anti-GFP panel of (B). M: molecular size marker (Fisher BioReagents™ EZ-Run™ Prestained Rec Protein Ladder; approximate sizes shown on the left side of the blots). (C) Quantification of the antibody detected signals of the HSPA1A (GFP or myc tagged) in the absence (graph columns one-two and five-six) or presence (graph columns three-four and seven-eight) of P4M-SidMx2 or EEA1 presented as a ratio between the biotinylated (PM) fraction and the total cell lysate. Densitometry values are averages of three independent experiments (n = 3). These values were normalized to controls (control set to 100%), and the standard deviation was scaled accordingly. Center lines show the medians; whiskers extend 1.5 times the interquartile range from the 25th and 75th percentiles; crosses represent sample means.
Figure 4
Figure 4
Plasma membrane localization of HSPA1A is not affected by ionomycin. (A) Representative images of HeLa cells expressing GFP-HSPA1A (two top panels) and GFP-PLCδ (two bottom panel). Cells were either incubated with DMSO (untreated controls; first row of each panel) or treated with 10 µM ionomycin for 2 min (second row of each panel). Only heat-shocked cells are shown. The PM of all cells was stained with WGA-FA555 and the nucleus with DAPI (second and third picture of each panel, respectively). Scale bar = 10 μM. (B) Quantification of the corrected total cell fluorescence (CTCF) as a ratio between the total fluorescence at the PM and the rest of the cell at control conditions and after heat shock in the presence or absence of ionomycin. The experiment was repeated three times, and the total number of cells (shown as open circles) per condition are shown at the bottom of the graph. The center lines show the medians; box limits indicate the 25th and 75th percentiles as determined by R software; whiskers extend 1.5 times the interquartile range from the 25th and 75th percentiles; crosses represent sample means.
Figure 5
Figure 5
Phenyl arsine oxide (PAO) treatment significantly decreases HSPA1A’s PM localization after heat shock. (A) Representative images of HeLa cells expressing GFP-HSPA1A (top panel) and GFP-P4M-SidMx2 (second panel). Cells were either left untreated (DMSO; first row of each panel) or treated with 10nM PAO for 30 min (bottom row of each panel). Only heat-shocked cells are shown. For all cells, the PM was stained with WGA-FA555 and the nucleus with DAPI (second and third picture from the left of each panel). Scale bar = 10 μM. (B) Quantification of the corrected total cell fluorescence (CTCF) as a ratio between the total fluorescence at the PM and the rest of the cell at control conditions and after heat shock in the presence or absence of PAO. The experiment was repeated three times, and the total number of cells (shown as open circles) per condition are shown at the bottom of the graph; box limits indicate the 25th and 75th percentiles as determined by R software; whiskers extend 1.5 times the interquartile range from the 25th and 75th percentiles; crosses represent sample means.
Figure 6
Figure 6
HSPA1A localization at the plasma membrane is significantly reduced by treatment with GSK-A1. Representative images of HeLa cells expressing (A) GFP-HSPA1A (top two rows), GFP-P4M-SidMx2 (bottom two rows), (C) GFP-PLCδ-PH (top two rows) and Lact-C2-GFP (bottom two rows). In all cases, the PM was stained with WGA-FA555 and the nucleus with DAPI. The PM localization of the proteins was documented at either control conditions (37 °C; left three columns) or heat-shocked conditions (1 h at 42 °C/8 h at 37 °C; right three columns). Negative control cells were treated with DMSO. Scale bar = 10 μM. (B,D) Quantification of the corrected total cell fluorescence (CTCF) as a ratio between the total GFP fluorescence of HSPA1A, P4M-SidMx2, PLCδ-PH, or Lact-C2 at the PM and the rest of the cell at control conditions and after heat shock in the presence of either DMSO (untreated) or GSK-A1. The experiment was repeated three times, and the total number of cells (shown as open circles) per condition are shown at the bottom of the graph. The center lines show the medians; box limits indicate the 25th and 75th percentiles as determined by R software; whiskers extend 1.5 times the interquartile range from the 25th and 75th percentiles; crosses represent sample means.
Figure 7
Figure 7
HSPA1A localization at the plasma membrane is significantly reduced by treatment with wortmannin. (A) Representative images of HeLa cells expressing GFP-HSPA1A (first column from the left), Lact-C2-GFP (second column), GFP-P4M-SidMx2 (third column), GFP-PLCδ-PH (fourth column), and GFP-EEA1 (fifth column). In all cases, the PM was stained with WGA-FA555 and the nucleus with DAPI. The PM localization of the proteins was documented at either control conditions (37 °C; top panels) or heat-shocked conditions (1 h at 42 °C/8 h at 37 °C; bottom panels). Negative control cells were treated with DMSO. Scale bar = 10 μM. (B) Quantification of the corrected total cell fluorescence (CTCF) as a ratio between the total GFP fluorescence of HSPA1A, Lact-C2, P4M-SidMx2, or PLCδ-PH at the PM and the rest of the cell at control conditions and after heat shock in the presence of either DMSO (untreated) or wortmannin. Please note that the EEA1 cells were not quantified because they do not localize at the PM. The experiment was repeated three times, and the total number of cells (shown as open circles) per condition are shown at the bottom of the graph. The center lines show the medians; box limits indicate the 25th and 75th percentiles as determined by R software; whiskers extend 1.5 times the interquartile range from the 25th and 75th percentiles; crosses represent sample means.
Figure 8
Figure 8
Schematic depicting the principle of the lipid depletion assay using phosphatases. The Pseudojanin (PJ) construct generates a fusion of Sac1 and INPP5E phosphatase domains with FKBP (mRFP-FKBP-PJ-WT). After rapamycin treatment, the mRFP-FKBP-Pseudojanin (PJ) WT construct is recruited to the plasma membrane (PM) due to the dimerization of its FKBP domain to a PM targeted FRB domain (Lyn11-FRB-CFP). The information presented stems from [32].
Figure 9
Figure 9
HSPA1A localization at the PM is decreased by the expression of Sac1 and WT enzymes. Representative images of HeLa cells expressing (A) GFP-HSPA1A, (C) GFP-P4M-SidMx2, and (E) GFP-PLCδ-PH with RFP-tagged PJ vectors and DAPI nucleus stain. The PM localization of HSPA1A was documented for all transfections at either control conditions (37 °C; left columns) or heat-shocked conditions (1 h at 42 °C/8 h at 37 °C; right columns). Negative control cells contain either the vehicle alone (Lyn11) or the inactive vector (Dead). Scale bar = 10 μM. (B,D,F) Quantification of the corrected total cell fluorescence (CTCF) as a ratio between the total GFP fluorescence of the protein of interest at the PM and the rest of the cell at control conditions and after heat shock with or without rapamycin treatment. The experiment was repeated three times, and the total number of cells (shown as open circles) per condition are shown at the bottom of the graph. The center lines show the medians; box limits indicate the 25th and 75th percentiles as determined by R software; whiskers extend 1.5 times the interquartile range from the 25th and 75th percentiles; crosses represent sample means.

Similar articles

Cited by

References

    1. Lindquist S., Craig E.A. The heat-shock proteins. Annu. Rev. Genet. 1988;22:631–677. doi: 10.1146/annurev.ge.22.120188.003215. - DOI - PubMed
    1. Kultz D. Molecular and evolutionary basis of the cellular stress response. Annu. Rev. Physiol. 2005;67:225–257. doi: 10.1146/annurev.physiol.67.040403.103635. - DOI - PubMed
    1. Albakova Z., Armeev G.A., Kanevskiy L.M., Kovalenko E.I., Sapozhnikov A.M. HSP70 Multi-Functionality in Cancer. Cells. 2020;9:587. doi: 10.3390/cells9030587. - DOI - PMC - PubMed
    1. Elmallah M.I.Y., Cordonnier M., Vautrot V., Chanteloup G., Garrido C., Gobbo J. Membrane-anchored heat-shock protein 70 (Hsp70) in cancer. Cancer Lett. 2020;469:134–141. doi: 10.1016/j.canlet.2019.10.037. - DOI - PubMed
    1. Vostakolaei M.A., Abdolalizadeh J., Hejazi M.S., Kordi S., Molavi O. Hsp70 in Cancer: Partner or Traitor to Immune System. Iran J. Allergy Asthma Immunol. 2019;18:589–604. doi: 10.18502/ijaai.v18i6.2172. - DOI - PubMed

Publication types

MeSH terms