. 2022 Jun 20;12(6):859.
doi: 10.3390/biom12060859.

Comparative Study of Transcriptome in the Hearts Isolated from Mice, Rats, and Humans

Affiliations

Comparative Study of Transcriptome in the Hearts Isolated from Mice, Rats, and Humans

Daigo Okada et al. Biomolecules. .

Abstract

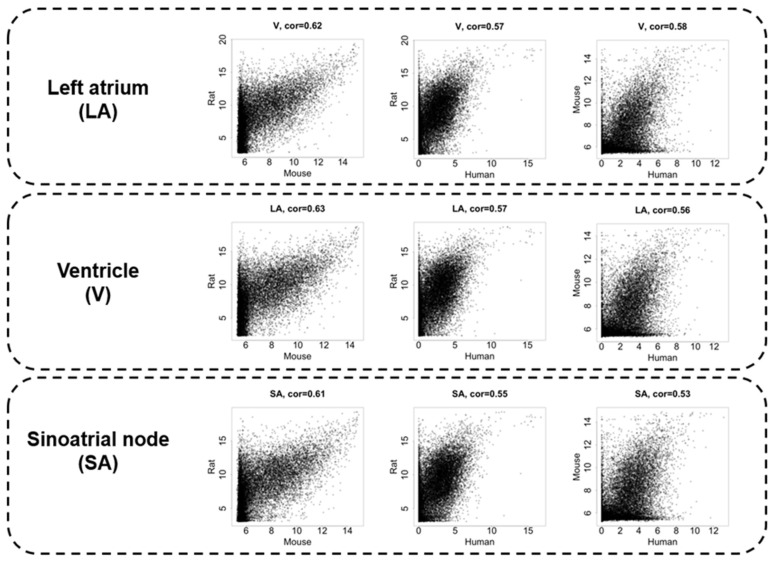
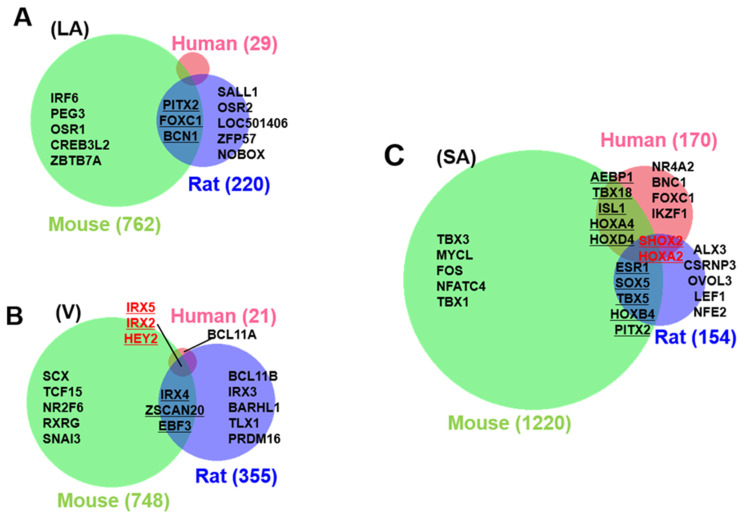
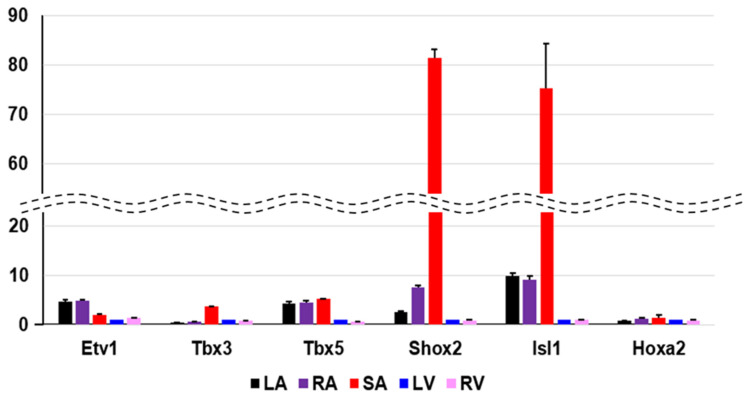
The heart is a significant organ in mammalian life, and the heartbeat mechanism has been an essential focus of science. However, few studies have focused on species differences. Accordingly, challenges remain in studying genes that have universal functions across species and genes that determine species differences. Here, we analyzed transcriptome data in mouse, rat, and human atria, ventricles, and sinoatrial nodes (SA) obtained from different platforms and compared them by calculating specificity measure (SPM) values in consideration of species differences. Among the three heart regions, the species differences in SA were the greatest, and we searched for genes that determined the essential characteristics of SA, which was SHOX2 in our criteria. The SPM value of SHOX2 was prominently high across species. Similarly, by calculating SPM values, we identified 3 atrial-specific, 11 ventricular-specific, and 17 SA-specific markers. Ontology analysis identified 70 cardiac region- and species-specific ontologies. These results suggest that reanalyzing existing data by calculating SPM values may identify novel tissue-specific genes and species-dependent gene expression. This study identified the importance of SHOX2 as an SA-specific transcription factor, a novel cardiac regional marker, and species-dependent ontologies.

Keywords: SHOX2; heart; transcriptome.


Conflict of interest statement

The authors declare no conflict of interest.

Figures

Figure 1
Figure 1
The clustering for the transcriptome samples and the distributions of expression intensity of gene expression intensities for mouse (A) and rat (B) array data (Illumina bead chip or SurePrint GE microarray) and (C) human RNA-seq data. (D) Interspecies comparisons of transcriptome data were performed using human gene ortholog relationships. For each gene, differences in expression levels between sites were tested by analysis of variance (ANOVA), and p values were calculated. For each gene, the site-specificity of the three sites was calculated as the specificity measure (SPM) value. Most of the analysis was performed on a single platform by SPM values. The results of hierarchical clustering of SPM values for site-specificity. Human genes with orthologs in mice and rats were targeted. The analysis was limited to the left atrium (LA), ventricles (V) (right ventricle (RV), and left ventricle (LV) data were combined), and sinoatrial nodes (SA), which are cardiac regions that are common in the transcriptome data. LAA; left atrial appendage, RA; right atrium, PA; pulmonary artery, PV; pulmonary vein. Each cardiopulmonary region is color-coded, with a corresponding panel in (A).
Figure 2
Figure 2
The expression intensity correlations between species are compared in the left atrium (LA), ventricle (V), and sinus node (SA), in order from top to bottom. The leftmost panels show the correlation between mice and rats, the middle panels show the correlation between rats and humans, and the rightmost panels show the correlation between humans and mice. Spearman’s correlation coefficient is displayed at the top of each graph.
Figure 3
Figure 3
Cardiac region-specific genes. The number of left atrial (LA, (A)), ventricular (V, (B)), and sinoatrial node (SA, (C)) specific genes selected based on SPM values are indicated by numbers in parentheses beside the area-proportional Venn diagram. Animal species are color-coded as human (pink), mouse (green), and rat (blue). Transcription factors are shown as representatives of specific genes, with a maximum of five top-ranked transcription factors in each space. The rank is determined by the magnitude of the SPM value. Specific transcription factors that are conserved across more than two species are underlined; specific transcription factors that are conserved among the three species are shown in red.
Figure 4
Figure 4
Specificity of six selected transcription factors with respect to sinoatrial nodes across three animal species. (A) Plot of z-score normalized specificity measure (SPM) values for three animal species: human on the x-axis, rat on the y-axis, and mouse on the z-axis. Scatter plots showing the relationship between (B) mouse–rat, (C) human–mouse, and (D) human–rat raw SPM values. The dotted lines indicate the threshold SPM values for specificity in this study. SHOX2, HOXA2, and ISL1 exceed the threshold values in all species. SHOX2, HOXA2, and ISL1 exceed the threshold values in all species.
Figure 5
Figure 5
Quantitative PCR validation of selected transcripts. The PCR result measures the expression of the ventricle with arbitrary unit 1, and shows how many times more than the expression of the ventricle. In our transcriptome analysis, Etv1 is atrium-specific, Tbx3, Shox2 and Isl1 are SA-specific genes in mice. With respect to Hoxa2, our specificity measure (SPM) criteria could not be confirmed. Each heart region is color-coded at the bottom. LA; left atrium, RA; right atrium, SA; sinoatrial node, LV; left ventricle, RV; right ventricle.
Figure 6
Figure 6
(A) is a heat map of z-score normalized SPM values in left atrial (LA)-specific genes that are common across species. Similarly, (B,C) show ventricle-specific gene groups and sinoatrial node (SA)-specific gene groups, respectively.
Figure 7
Figure 7
(A), A heat map of the human-selective LA-specific genes with the representative enriched gene ontology. Similarly, (B,C) show representative rat ventricle-specific ontologies and mouse SA-specific ontologies, respectively.

Similar articles

Cited by

References

    1. Huxley A.F., Niedergerke R. Structural changes in muscle during contraction: Interference microscopy of living muscle fibres. Nature. 1954;173:971–973. doi: 10.1038/173971a0. - DOI - PubMed
    1. Huxley H., Hanson J. Changes in the Cross-Striations of Muscle during Contraction and Stretch and their Structural Interpretation. AAPG Mem. 2011;42:61–102. doi: 10.1038/173973a0. - DOI - PubMed
    1. Ebashi S., Endo M., Ohtsuki I. Control of muscle contraction. Q. Rev. Biophys. 1969;2:351–384. doi: 10.1017/S0033583500001190. - DOI - PubMed
    1. Noda M., Shimizu S., Tanabe T., Takai T., Kayano T., Ikeda T., Takahashi H., Nakayama H., Kanaoka Y., Minamino N., et al. Primary structure of Electrophorus electricus sodium channel deduced from cDNA sequence. Nature. 1984;312:121–127. doi: 10.1038/312121a0. - DOI - PubMed
    1. Tanabe T., Takeshima H., Hikami A., Flockerzi V., Takahashi H., Kangawa K., Kojima M., Matsuo H., Hirose T., Numa S. Primary structure of the receptor for calcium channel blockers from skeletal muscle. Jpn. J. Pharmacol. 1988;46:33. doi: 10.1016/S0021-5198(19)56950-5. - DOI - PubMed

Publication types