. 2022 Jun 9;11(12):1881.
doi: 10.3390/cells11121881.

Immunogenicity of Novel AAV Capsids for Retinal Gene Therapy

Affiliations

Immunogenicity of Novel AAV Capsids for Retinal Gene Therapy

Miranda Gehrke et al. Cells. .

Abstract

Objectives: AAV vectors are widely used in gene therapy, but the prevalence of neutralizing antibodies raised against AAV serotypes in the course of a natural infection, as well as innate and adaptive immune responses induced upon vector administration, is still considered an important limitation. In ocular gene therapy, vectors applied subretinally bear the risk of retinal detachment or vascular leakage. Therefore, new AAV vectors that are suitable for intravitreal administration for photoreceptor transduction were developed.

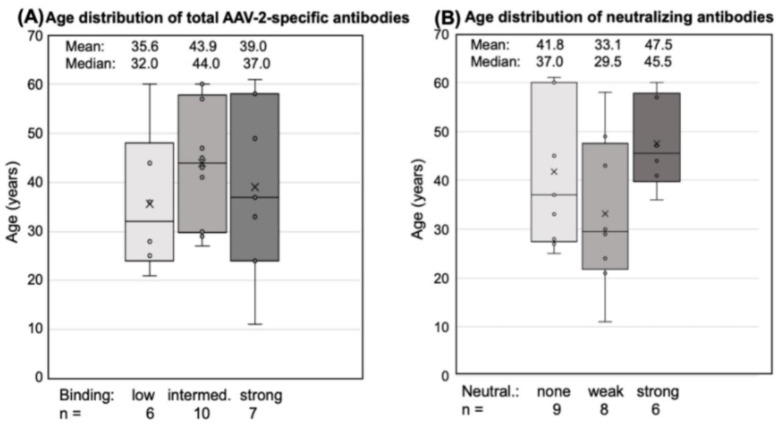
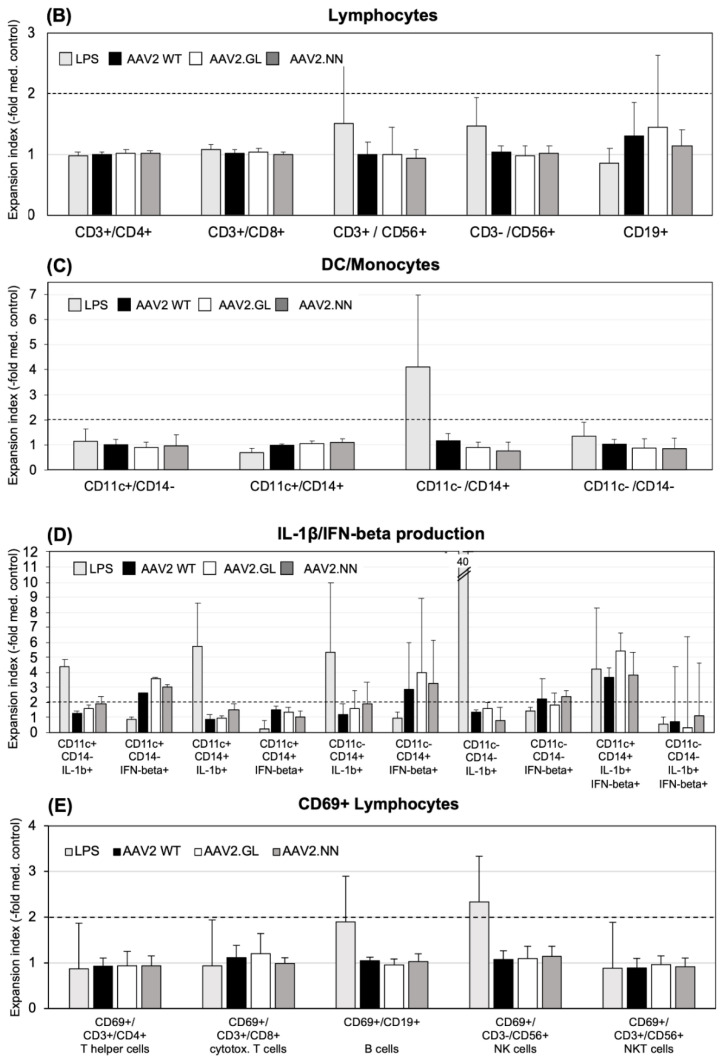
Methods: Here, we compared human immune responses from donors with suspected previous AAV2 infections to the new vectors AAV2.GL and AAV2.NN-two capsid peptide display variants with an enhanced tropism for photoreceptors-with the parental serotype AAV2 (AAV2 WT). We investigated total and neutralizing antibodies, adaptive and innate cellular immunogenicity determined by immunofluorescence staining and flow cytometry, and cytokine secretion analyzed with multiplex beads.

Results: While we did not observe obvious differences in overall antibody binding, variants-particularly AAV2.GL-were less sensitive to neutralizing antibodies than the AAV2 WT. The novel variants did not differ from AAV2 WT in cellular immune responses and cytokine production in vitro.

Conclusion: Due to their enhanced retinal tropism, which allows for dose reduction, the new vector variants are likely to be less immunogenic for gene therapy than the parental AAV2 vector.

Keywords: adaptive immunity; antibodies; cellular immunity; chemokines; cytokines; immunofluorescence; innate immunity; monocyte-derived DC; neutralization.


Conflict of interest statement

H.B. and S.M. are named inventors on the related patent application WO/2019/076856 covering the novel AAV capsids. S.M. is the co-founder of the gene therapy company ViGeneron GmbH, which owns the rights on the patent application WO/2019/076856. All other authors declare no conflict of interest.

Figures

Figure 1
Figure 1
Human antibody responses to AAV2 WT, AAV2.GL, and AAV2.NN capsids. (A) Total Ig antibody responses (IgM, IgG, IgA) to the AAV capsids calculated from the ODs of all samples at a serum dilution of 1:400. n = 23. (B) Neutralizing antibodies shown as the reciprocal of the serum/plasma dilution at 50% inhibition of HeLa cell transduction (* p < 0.01). The small circles show the individual data points, the central line shows the median, the x represents the mean, and the whiskers above and below display the minimum and maximum within 1.5 interquartile range (IQR) of the lower and upper quartile. n = 23. (C) Representative histograms of the FACS analysis of AAV-transduced HeLa cells without serum (negative control, no neutralization, upper panel) and with serum U103 diluted 1:200 (strong neutralization, middle panel) and 1:2000 (reduced neutralization, lower panel). The left lines in each histogram show the gate of the non-transduced, eGFP-negative cells (percentage of cells in the upper left corner), and the right lines show the gate of the GFP-positive, vector-transduced cells (percentage of eGFP+ cells shown in the upper right). (D) Comparison of total and neutralizing antibodies for each donor. Upper panel: neutralizing antibodies, lower panel: total antibodies, shown as mean OD 450 of triplicates at sample dilutions of 1:200. Black stars mark samples with decreased neutralization of engineered capsids; double arrows high neutralizers and the respective total anti-capsid antibodies. n = 23 samples. The data shown are representative of repeated experiments. Statistics were performed using the Friedman test and Dunn´s Multiple Comparison test, and significance was defined as a p value of <0.05 (* p < 0.01).
Figure 2
Figure 2
Age distribution of antibody responders. Total antibodies and neutralizing antibodies are shown for each donor. The small circles represent the individual data points, the central line shows the median, the x represents the mean, and the whiskers above and below display the minimum and maximum within 1.5 interquartile range (IQR) of the lower and upper quartile. (A) Total AAV2-specific antibodies: “low” binding was defined as mean OD 450 < 0.1 at 1:400 dilution, “intermediate” binding as a mean 0.1 < OD 450 < 0.24, and “high” binding as >0.24. (B) Neutralizing antibodies: “weak” neutralization needed 1:50 to <1:300 dilution at 50% neutralization, “strong neutralization” was defined as a serum dilution >1:300. Statistics were performed using the Friedman test and Dunn´s Multiple Comparison test; significant differences were not observed.
Figure 3
Figure 3
Expansion of cell populations after in vitro stimulation with AAV vectors. (A) Cells were gated for FACScan analysis according to FSC (forward scatter) and SSC (side scatter) in the “innate cells” population including monocytes/macrophages, DCs and granulocytes, and “lymphocytes”, including B, T, and NK/NKT cells (see the Materials and Methods section for more details). (B) CD3+ T cells (CD4+ Th, CD8+ cytotoxic T and CD56+ NK-T cells, CD3-CD56+ NK cells, and CD19+ T cells were analyzed from the lymphocyte gate. (C) CD11c+/CD14- DCs, CD11c+/CD14+ monocyte-derived DCs, and CD11c-/CD14+ monocytes were analyzed from the “innate cells” gate. (D) Surface staining for DCs and monocytes was combined with cytoplasmic staining for IL-1β and IFN-beta, respectively. The y-axis is cut at an expansion index of 12, as well as the expansion index of 40 from the LPS-simulated cells, and the CD11c-/CD14-/IL1β+ population is indicated in the respective column. (E) CD69-expressing lymphocyte subpopulations. The shown data are the means ± SD of the “expansion index” calculated as fold of the population size calculated from the population in the medium control. The results are shown as the mean expansion index of all tested donors (n = 6) after 24 h of in vitro stimulation, which was determined as the optimal time point from different stimulation experiments. The dashed lines mark twofold expansion of cell populations. Statistics were performed using the Friedman test and Dunn´s Multiple Comparison test; no significant differences were observed.
Figure 3
Figure 3
Expansion of cell populations after in vitro stimulation with AAV vectors. (A) Cells were gated for FACScan analysis according to FSC (forward scatter) and SSC (side scatter) in the “innate cells” population including monocytes/macrophages, DCs and granulocytes, and “lymphocytes”, including B, T, and NK/NKT cells (see the Materials and Methods section for more details). (B) CD3+ T cells (CD4+ Th, CD8+ cytotoxic T and CD56+ NK-T cells, CD3-CD56+ NK cells, and CD19+ T cells were analyzed from the lymphocyte gate. (C) CD11c+/CD14- DCs, CD11c+/CD14+ monocyte-derived DCs, and CD11c-/CD14+ monocytes were analyzed from the “innate cells” gate. (D) Surface staining for DCs and monocytes was combined with cytoplasmic staining for IL-1β and IFN-beta, respectively. The y-axis is cut at an expansion index of 12, as well as the expansion index of 40 from the LPS-simulated cells, and the CD11c-/CD14-/IL1β+ population is indicated in the respective column. (E) CD69-expressing lymphocyte subpopulations. The shown data are the means ± SD of the “expansion index” calculated as fold of the population size calculated from the population in the medium control. The results are shown as the mean expansion index of all tested donors (n = 6) after 24 h of in vitro stimulation, which was determined as the optimal time point from different stimulation experiments. The dashed lines mark twofold expansion of cell populations. Statistics were performed using the Friedman test and Dunn´s Multiple Comparison test; no significant differences were observed.
Figure 4
Figure 4
Cytokine secretion after in vitro stimulation with AAV vectors. (A) Innate cytokines/chemokines secreted by PBMCs stimulated in vitro. Pooled supernatants from three daily collections of stimulated PBMCs (n = 5; H1, H2, H5, H6, H7) were tested. Data are shown as mean “secretion indices” ± SD calculated as fold stimulation in cultures with TT, PPD, or AAV2 capsids as indicated and calculated from the secretion in cultures with medium only. The solid line marks the secretion index of 2. Note the different scales of the y-axis; transitions are marked by the dashed lines. (B) Same as (A), but with higher magnification of the y-axis to show the high variation in the cytokine responses among the different donors. No significant differences were observed between the AAV capsids. Statistics were performed using the Friedman test and Dunn´s Multiple Comparison test; no significant differences were observed.
Figure 5
Figure 5
Modeling of the capsid epitopes of AAV2 WT and the variants AAV2.GL and AAV2.NN. Epitopes of known neutralizing monoclonal antibodies or serum (human and rabbit) of AAV2 are highlighted in different colors on the modeled structure of AAV2 WT (A,B) and the engineered capsids AAV2.GL (C) and AAV2-NN (D). Residues known to participate in the binding of the monoclonal antibodies A20 [28,29] and C37-B [28,30] are highlighted in green and cyan, respectively. Residues highlighted in magenta represent known epitopes for human and rabbit neutralizing antibodies [31,32,35]. Peptide insertions in AAV2.GL and AAV2.NN are highlighted in black. As is evident from the respective models, some of the epitopes are covered and occluded by the peptide insertions in AAV2.GL and AAV2.NN. Models were generated using the RoseTTAfold deep learning algorithm [36] available at https://robetta.bakerlab.org/ (accessed on 7 December 2021). The generated 3D models were visualized using the UCSF Chimera software (https://www.cgl.ucsf.edu/chimera/ (accessed on 7 December 2021).

References

    1. Wang D., Tai P.W.L., Gao G. Adeno-associated virus vector as a platform for gene therapy delivery. Nat. Rev. Drug Discov. 2019;18:358–378. doi: 10.1038/s41573-019-0012-9. - DOI - PMC - PubMed
    1. Keeler A.M., Flotte T.R. Recombinant Adeno-Associated Virus Gene Therapy in Light of Luxturna (and Zolgensma and Glybera): Where Are We, and How Did We Get Here? Annu. Rev. Virol. 2019;6:601–621. doi: 10.1146/annurev-virology-092818-015530. - DOI - PMC - PubMed
    1. Kuzmin D.A., Shutova M.V., Johnston N.R., Smith O.P., Fedorin V.V., Kukushkin Y.S., van der Loo J.C.M., Johnstone E.C. The clinical landscape for AAV gene therapies. Nat. Rev. Drug Discov. 2021;20:173–174. doi: 10.1038/d41573-021-00017-7. - DOI - PubMed
    1. Srivastava A. In vivo tissue-tropism of adeno-associated viral vectors. Curr. Opin. Virol. 2016;21:75–80. doi: 10.1016/j.coviro.2016.08.003. - DOI - PMC - PubMed
    1. Grimm D., Büning H. Small but Increasingly Mighty: Latest Advances in AAV Vector Research, Design, and Evolution. Hum. Gene Ther. 2017;28:1075–1086. doi: 10.1089/hum.2017.172. - DOI - PubMed