. 2022 Jun 10;11(12):1892.
doi: 10.3390/cells11121892.

Aquaporin-6 May Increase the Resistance to Oxidative Stress of Malignant Pleural Mesothelioma Cells

Affiliations

Aquaporin-6 May Increase the Resistance to Oxidative Stress of Malignant Pleural Mesothelioma Cells

Giorgia Pellavio et al. Cells. .

Abstract

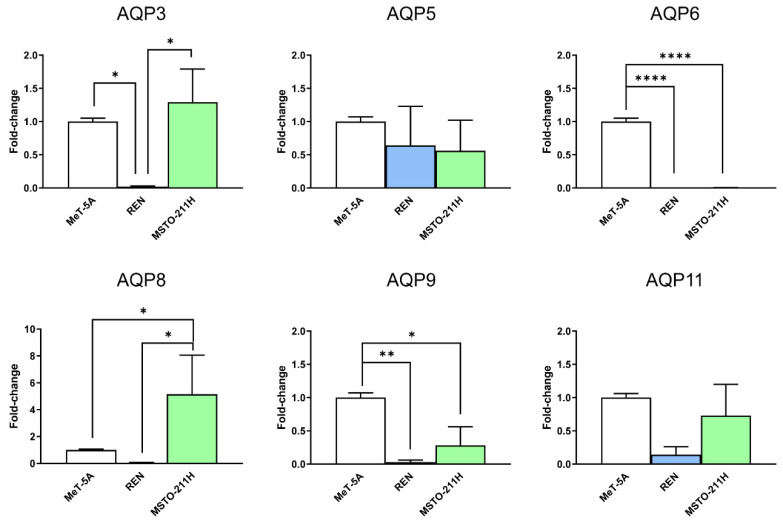
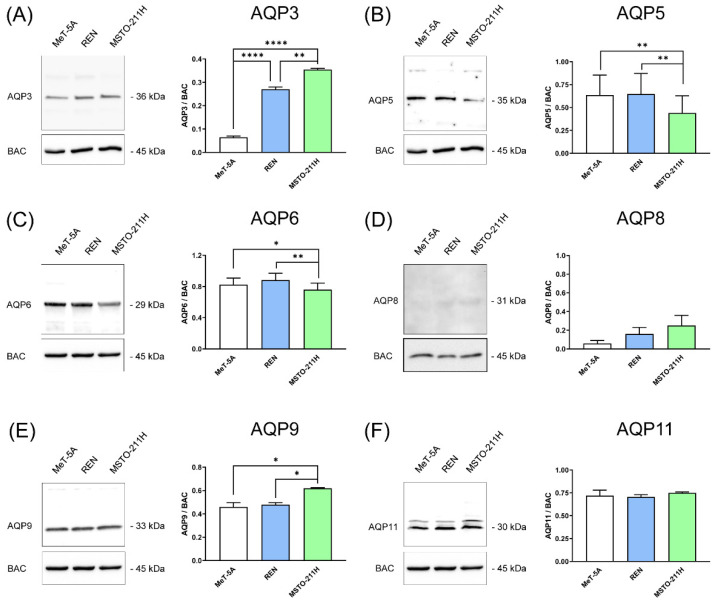
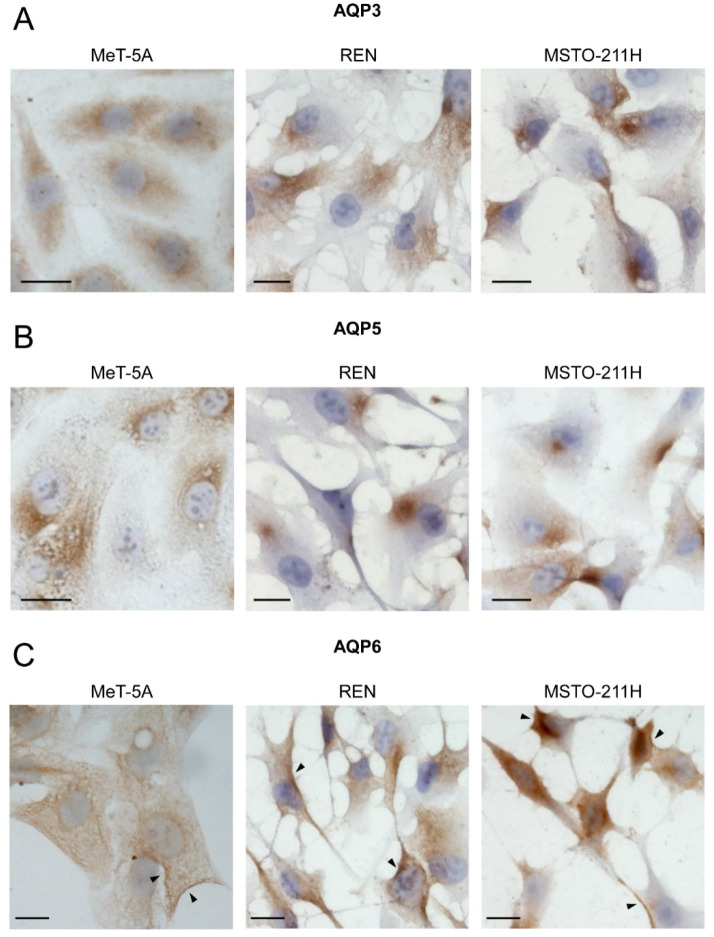
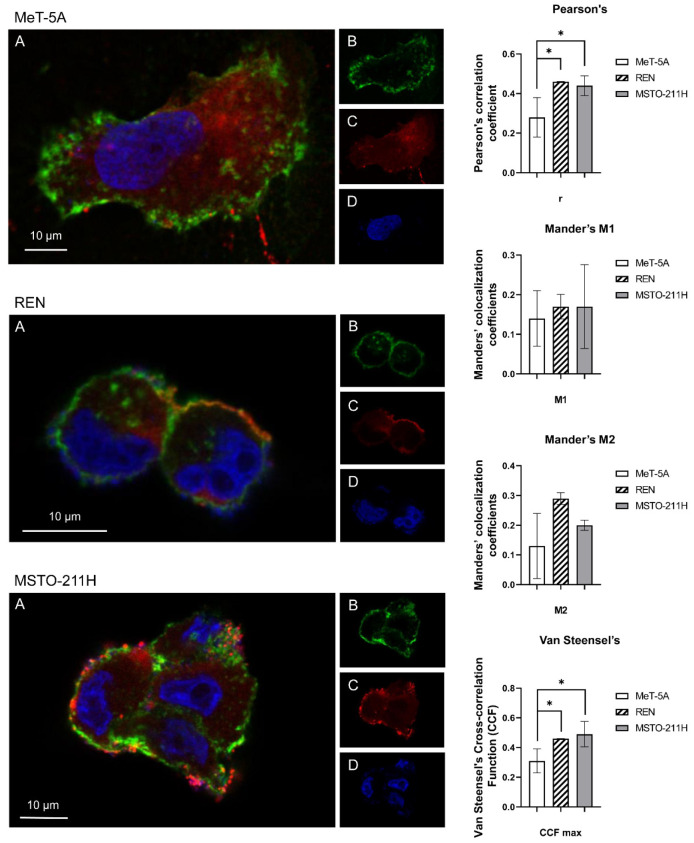
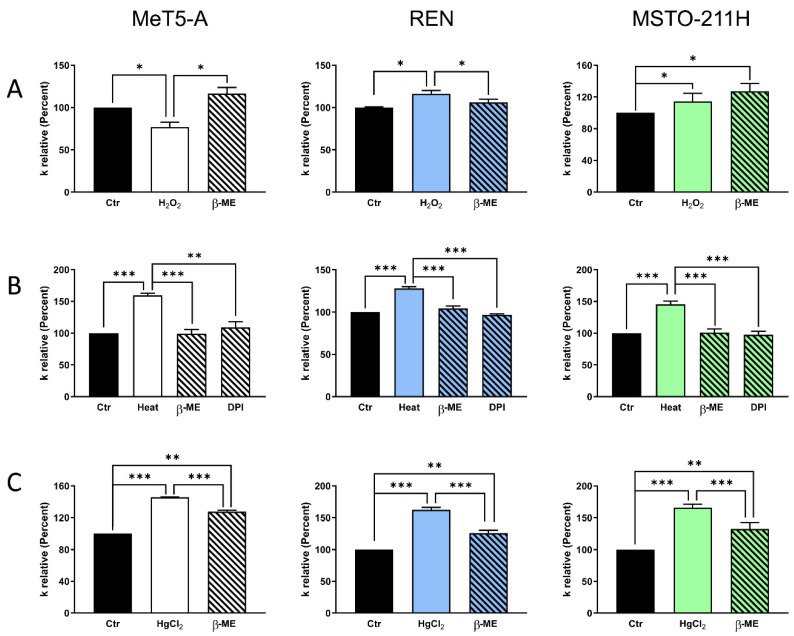
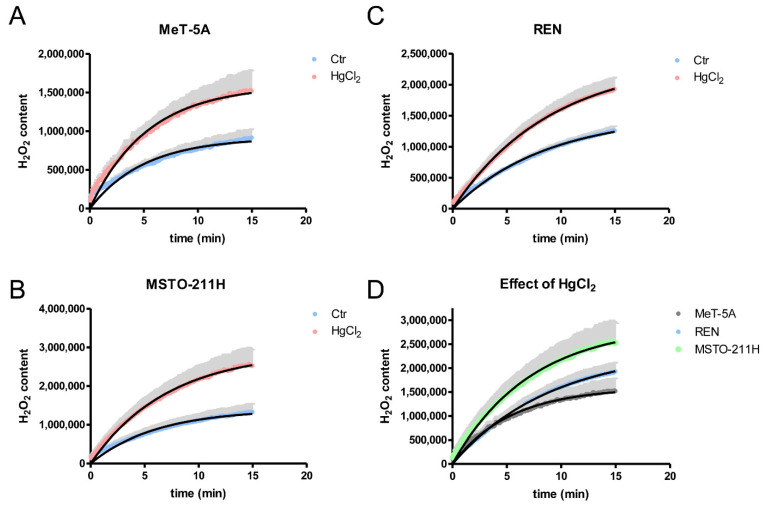
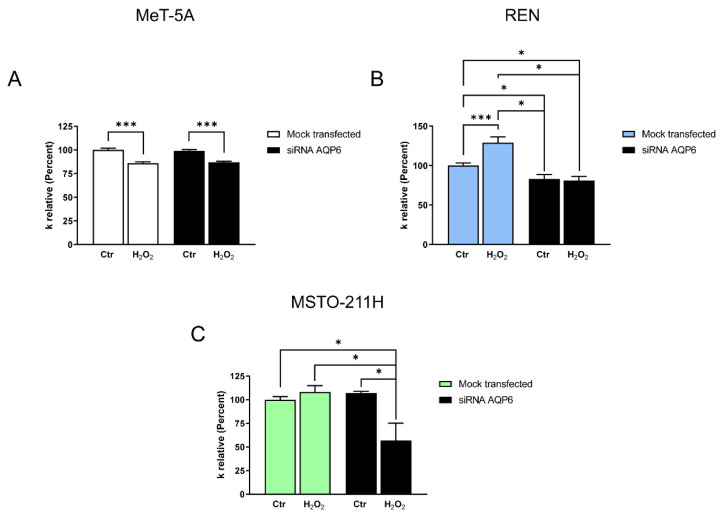
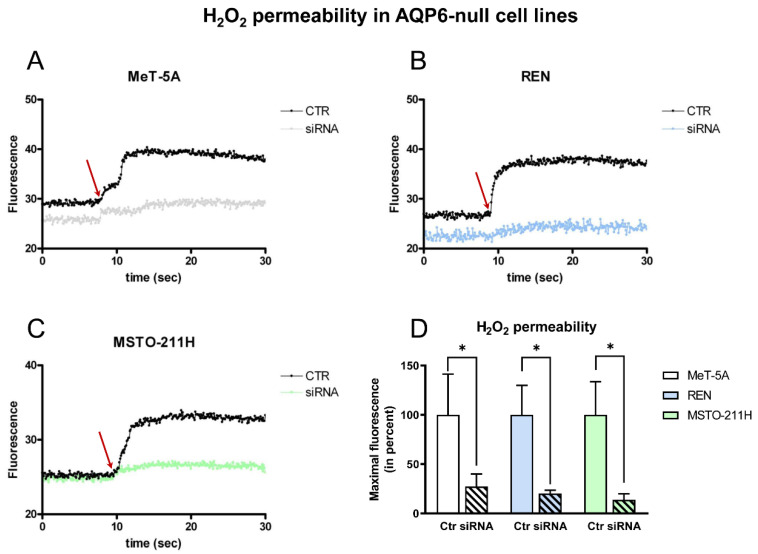
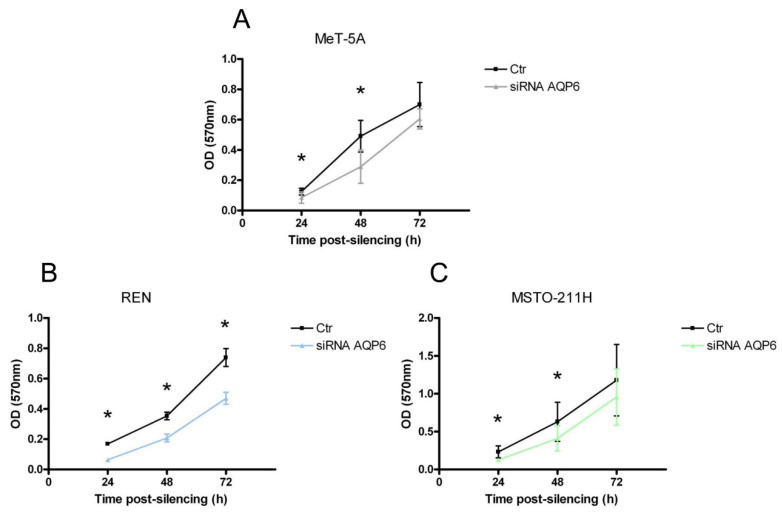
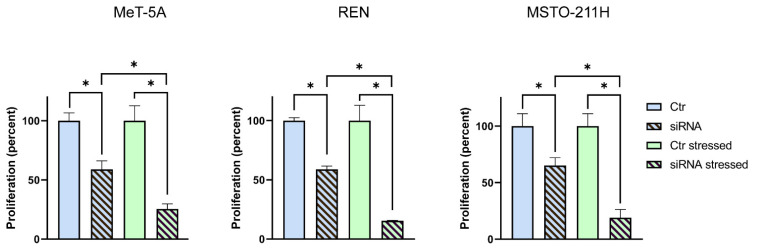
Malignant pleural mesothelioma (MPM) is an aggressive cancer of the pleural surface and is associated with previous asbestos exposure. The chemotherapy drug is one of the main treatments, but the median survival ranges from 8 to 14 months from diagnosis. The redox homeostasis of tumor cells should be carefully considered since elevated levels of ROS favor cancer cell progression (proliferation and migration), while a further elevation leads to ferroptosis. This study aims to analyze the functioning/role of aquaporins (AQPs) as a hydrogen peroxide (H2O2) channel in epithelial and biphasic MPM cell lines, as well as their possible involvement in chemotherapy drug resistance. Results show that AQP-3, -5, -6, -9, and -11 were expressed at mRNA and protein levels. AQP-6 was localized in the plasma membrane and intracellular structures. Compared to normal mesothelial cells, the water permeability of mesothelioma cells is not reduced by exogenous oxidative stress, but it is considerably increased by heat stress, making these cells resistant to ferroptosis. Functional experiments performed in mesothelioma cells silenced for aquaporin-6 revealed that it is responsible, at least in part, for the increase in H2O2 efflux caused by heat stress. Moreover, mesothelioma cells knocked down for AQP-6 showed a reduced proliferation compared to mock cells. Current findings suggest the major role of AQP-6 in providing mesothelioma cells with the ability to resist oxidative stress that underlies their resistance to chemotherapy drugs.

Keywords: Hyper7 probe; biphasic; epithelioid; gene silencing; hydrogen peroxide; peroxiporins; tumor proliferation.


Conflict of interest statement

The authors declare no conflict of interest.

Figures

Figure 1
Figure 1
qRT-PCR reaction analysis of AQP3, AQP5, AQP6, AQP8, AQP9, and AQP11 expression in mesothelial (MeT-5A, in white), epithelioid, and biphasic MPM cell lines (REN and MSTO-211H, in blue and green, respectively). Bars represent the mean ± SEM of fold change values (n = 4). *, p < 0.05; **, p < 0.01; ****, p < 0.0001 (ANOVA followed by Newman–Keuls’s Q test).
Figure 2
Figure 2
Immunoblotting and densitometric analysis of AQP3 (A), AQP5 (B), AQP6 (C), AQP8 (D), AQP9 (E), and AQP11 (F) in mesothelial (MeT-5A, in white), epithelioid, and biphasic MPM cell lines (REN and MSTO-211H, in blue and green, respectively). (Left panels) Representative blots of three different experiments are shown. Lanes were loaded with 30 μg of proteins, probed with affinity-purified antibodies, and processed as described in Materials and Methods. The same blots were stripped and re-probed with anti-β-actin (BAC) antibody, as housekeeping. Major bands of the expected molecular weights are shown. (Right panels) Densitometry of AQP protein levels in the three cell lines. Each bar represents the mean ± SEM of the normalized values of AQP protein expression. *, p < 0.05; **, p < 0.01; ****, p < 0.0001. (ANOVA followed by Newman–Keuls’s Q test).
Figure 3
Figure 3
Immunocytochemical localization of AQP3 (A), AQP5 (B), and AQP6 (C) proteins in MeT-5A, REN, and MSTO-211H cell lines. AQP3 and AQP5 staining appeared to be confined mainly to intracellular structures. AQP6 staining in MeT-5A is mainly intracellular and has a low expression in the plasma membrane. REN and MSTO-211H cell lines showed strong labelling in discrete areas of the plasma membrane, in addition to the intracellular expression. Arrowheads indicate the localization in plasma membranes. Scale bar: 20 μm.
Figure 4
Figure 4
Representative images of confocal laser scanning microscopy and 3D colocalization analysis of AQP6 (A–D) with concanavalin A (ConA) in MeT-5A, REN, and MSTO-211H cell lines. Green labeling indicates the presence of ConA (B), red labeling indicates the expression of AQP6 (C), while DAPI (blue, D) indicates counterstained nuclei. Yellow labelling shows the colocalization signal of AQP with ConA (A). Scale bar: 10 μm (right panel). Statistical analysis of Pearson’s correlation coefficient r, Manders’ colocalization coefficient (M1 and M2), and Van Steensel’s maxima cross-correlation function (CCF) were obtained from 4 different double immunofluorescence experiments with anti-AQP6 antibody and anti-AQP6 antibodies. Coefficients were determined by 3D analysis of at least 20 cells for each cell line (8–15 z-stack for image) using the JACoP plugin of Fiji. The columns represent the mean ± SD of the coefficient values; *, p < 0.05 (ANOVA, followed by Newman–Keuls’s Q test).
Figure 5
Figure 5
Effect of oxidative stress (A,B) and mercury (C) on the water permeability of mesothelial cells (MeT-5A), epithelioid (REN), and biphasic (MSTO-211H) MPM cells. (A) Cells were exposed to 150 mOsm osmotic gradients in three different conditions: untreated cells (Ctr), cells treated with H2O2 (H2O2), and cells treated with β-mercaptoethanol after H2O2 treatment (β-ME). (B) Cells were exposed to 150 mOsm osmotic gradients in four different conditions: untreated cells (Ctr), heat-stressed cells (Heat), cells treated with β-mercaptoethanol after heat stress (β-ME), and cells treated with diphenyleneiodonium chloride (DPI) before heat stress (DPI). (C) Cells were exposed to 150 mOsm osmotic gradients in three different conditions: untreated cells (Ctr), cells treated with mercury chloride (HgCl2), and cells treated with β-mercaptoethanol after HgCl2 treatment (β-ME). *, p < 0.05; **, p < 0.01; ***, p < 0.001. Bars represent the osmotic water permeability of MeT-5A cells expressed as a percent of k relative. Values are means ±SEM of 4–15 single shots for each of 4 different experiments (ANOVA, followed by Newman–Keuls’s Q test).
Figure 6
Figure 6
Effect of mercury chloride (HgCl2) treatment on the hydrogen peroxide permeability of mesothelial (MeT-5A; A), epithelioid (REN; B), and biphasic (MSTO-211H; C) MPM cell lines. (D) shows the compared effect of HgCl2 on hydrogen peroxide permeability in three cell lines. Hydrogen peroxide permeability was measured by loading the cells with CM-H2DCFDA reagent as described in Materials and Methods. Curves represent the time course of H2O2 transport, expressed as H2O2 content. Values are mean ± SEM (in gray) of three-time courses for each of four different experiments. Ctr, controls (A–C) p < 0.0001 (Student’s t-test). (D) Ymax values obtained by one-phase exponential association were (Mean ± SEM): Met-5A, 1.59 × 10⁶ ± 2.3 × 10⁴; REN, 2.39 × 10⁶ ± 4.2 × 10⁴; MSTO-211H, 2.90 × 10⁶ ± 6.4 × 10⁴. The values were statistically different with MSTO-211H > REN > Met-5A (p < 0.05; ANOVA, followed by Newman–Keuls’s Q test).
Figure 7
Figure 7
Effect of oxidative stress on water permeability of MeT-5A (A), REN (B), and MSTO-211H (C) cell lines after AQP6 gene silencing. Mock-transfected (scrambled, mock-transfected) and silenced cells (siRNA AQP6) were exposed to 150 mOsm osmotic gradients in two different conditions: untreated cells (Ctr) and cells treated with H2O2 (H2O2). *, p < 0.05; ***, p < 0.001. Bars represent the osmotic water permeability of cells expressed as a percent of k relative. Values are means ± SEM of 4–15 single shots for each of 4 different experiments (ANOVA, followed by Newman–Keuls’s Q test).
Figure 8
Figure 8
Effect of aquaporin-6 (AQP6) silencing on the H2O2 permeability MeT-5A (A), REN (B), and MSTO-211H (C) cell lines. (AC) HeLa cells were silenced with AQP6 siRNA and then transiently transfected with HyPer7 sensor, as described in Materials and Methods. Control (scrambled; CTR) and silenced cells (siRNA) were exposed to 50 μM H2O2 gradient (final concentration). Curves show the time course of H2O2 transported into the cells after H2O2 injection (red arrow). (D) Bars represent the H2O2 permeability of cells expressed as a percent of maximal fluorescence. Values are means ± SEM of cells for each of 3 different experiments in triplicates. *, p = 0.0414, p = 0.0260, p = 0.0275 versus Ctr, for Met-5A, REN, and MSTO-211H, respectively (Brown–Forsythe and Welch ANOVA tests).
Figure 9
Figure 9
Effect of aquaporin-6 (AQP6) silencing on the cell proliferation of MeT-5A (A), REN (B), and MSTO-211H (C) cultured cells. Cell growth was evaluated by measuring the OD at 570 nm at 24, 48, and 72 h after cell silencing compared with scrambled silenced control cells. The initial cell number was about 25,000 cells/well. AQP6-null cells (siRNA AQP6) showed a significantly decreased proliferation compared with controls after 24 and 48 h from silencing in Met-5A and MSTO-211H cells and after 24, 48, and 72 h from silencing in REN cells. Values (OD at 570 nm normalized to the cell number) are mean ± SEM of cells for each of 4 different experiments. *, p < 0.05 (Student’s t-test).
Figure 10
Figure 10
Effect of oxidative stress on cell proliferation of MeT-5A, REN, and MSTO-211H cells silenced for aquaporin-6 (siRNA) and mock-transfected (Ctr). Cell growth was evaluated by measuring the OD at 570 nm at 48 h after cell silencing compared with mock-transfected control cells. Oxidative stress was produced in siRNA and mock-transfected cells, as indicated in Materials and Methods. Values (expressed as the percent of proliferation) are means ± SEM of cells for each of 4 different experiments. *, p < 0.05 (ANOVA, followed by Newman–Keuls’s Q test).

Similar articles

Cited by

References

    1. PDQ Cancer Information Summaries Malignant Mesothelioma Treatment (Adult) (PDQ®)–Health Professional Version. PDQ Adult Treatment Editorial Board. In: PDQ Cancer Information Summaries [Internet]. Bethesda (MD): National Cancer Institute (US); 2002–2022. Bookshelf ID: NBK65983. [(accessed on 28 April 2022)]; Available online: https://www.cancer.gov/types/mesothelioma/hp/mesothelioma-treatment-pdq.
    1. Scherpereel A., Wallyn F., Albelda S.M., Munck C. Novel therapies for malignant pleural mesothelioma. Lancet Oncol. 2018;19:e161–e172. doi: 10.1016/S1470-2045(18)30100-1. - DOI - PubMed
    1. Tomasson K., Gudmundsson G., Briem H., Rafnsson V. Malignant mesothelioma incidence by nation-wide cancer registry: A population-based study. J. Occup. Med. Toxicol. 2016;11:37. doi: 10.1186/s12995-016-0127-4. - DOI - PMC - PubMed
    1. Mikulski S.M., Costanzi J.J., Vogelzang N.J., McCachren S., Taub R.N., Chun H., Mittelman A., Panella T., Puccio C., Fine R., et al. Phase II trial of a single weekly intravenous dose of ranpirnase in patients with unresectable malignant mesothelioma. J. Clin. Oncol. 2002;20:274–281. doi: 10.1200/JCO.2002.20.1.274. - DOI - PubMed
    1. Ishibashi K., Kondo S., Hara S., Morishita Y. The evolutionary aspects of aquaporin family. Am. J. Physiol. Regul. Integr. Comp. Physiol. 2011;300:R566–R576. doi: 10.1152/ajpregu.90464.2008. - DOI - PubMed

Publication types