. 2022 Jun 11;11(12):1894.
doi: 10.3390/cells11121894.

RIP3 Translocation into Mitochondria Promotes Mitofilin Degradation to Increase Inflammation and Kidney Injury after Renal Ischemia-Reperfusion

Affiliations

RIP3 Translocation into Mitochondria Promotes Mitofilin Degradation to Increase Inflammation and Kidney Injury after Renal Ischemia-Reperfusion

Yansheng Feng et al. Cells. .

Abstract

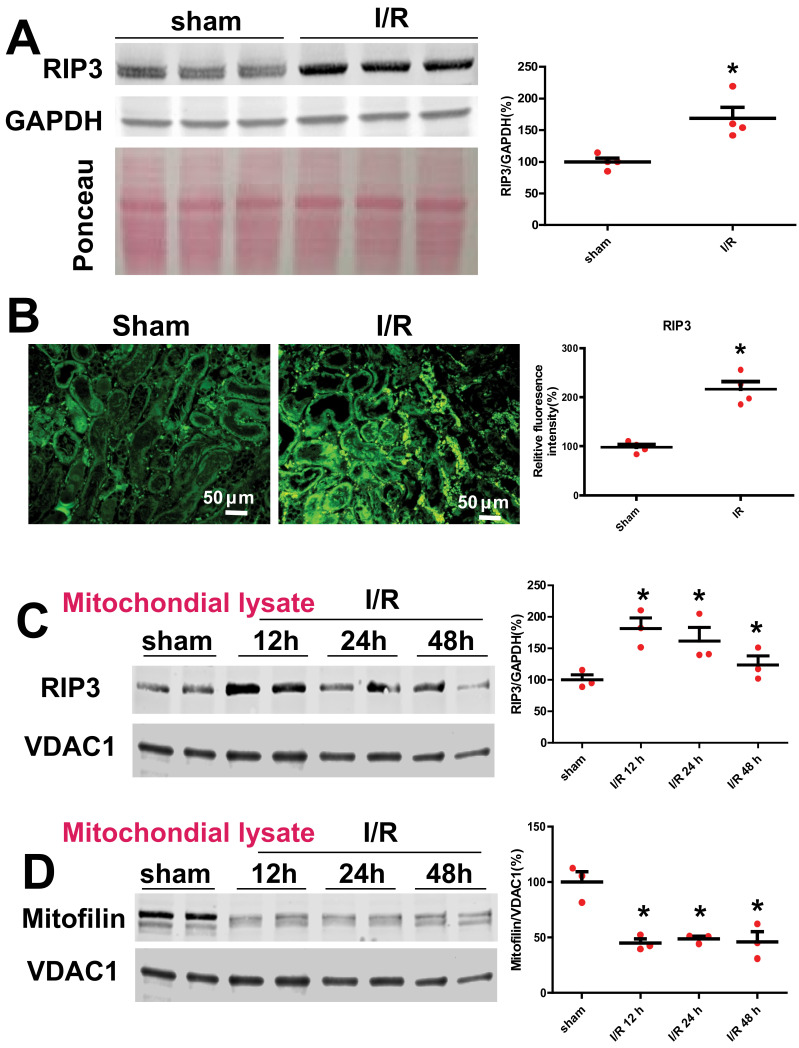
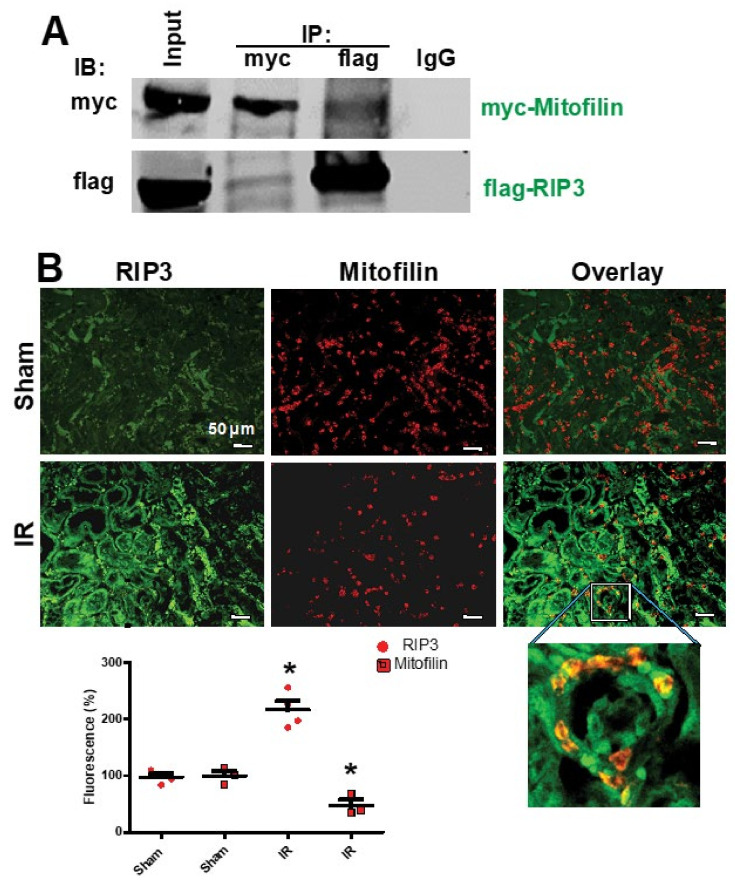
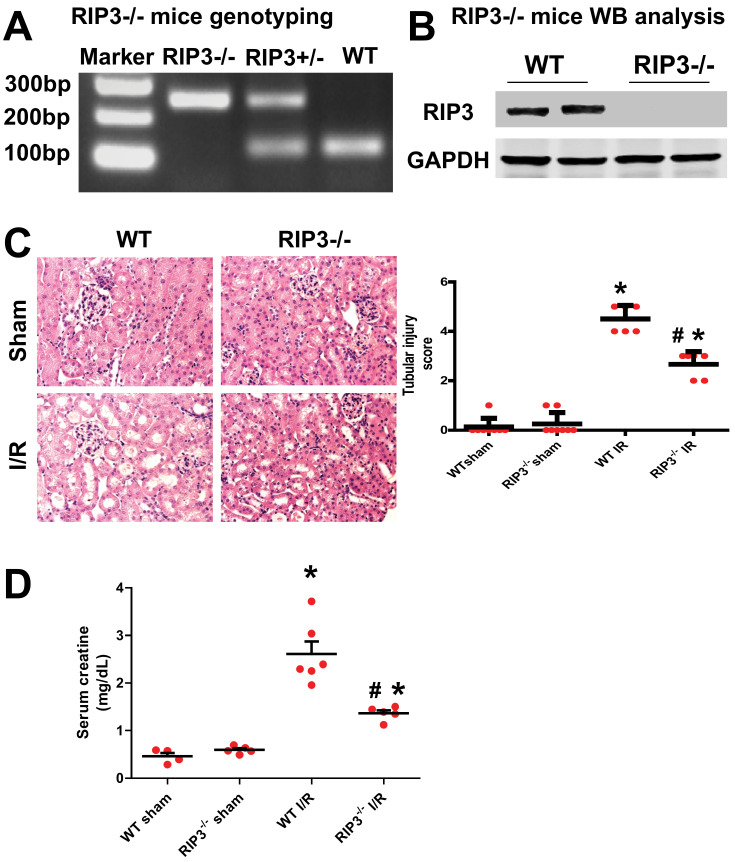
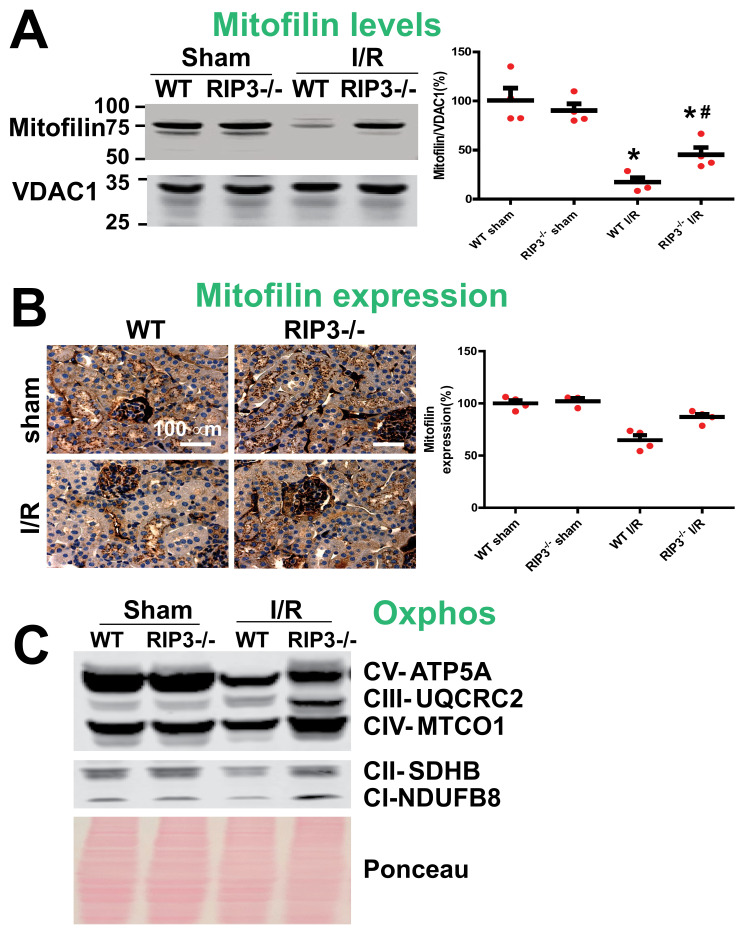
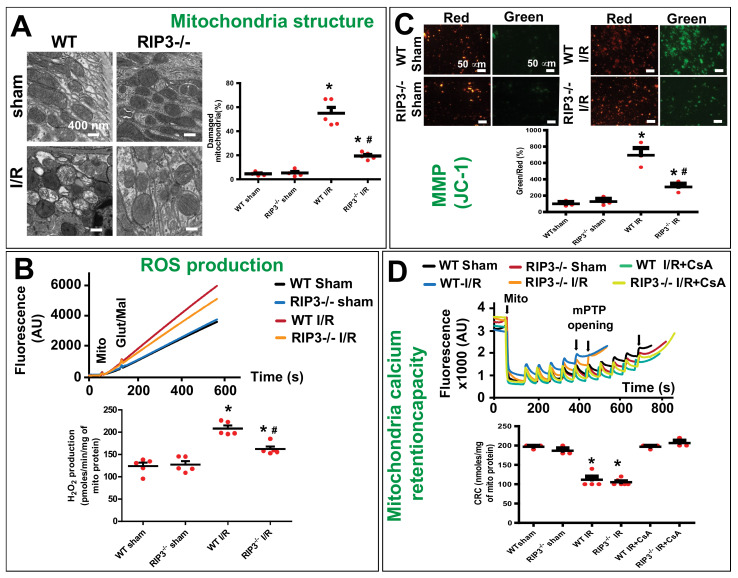
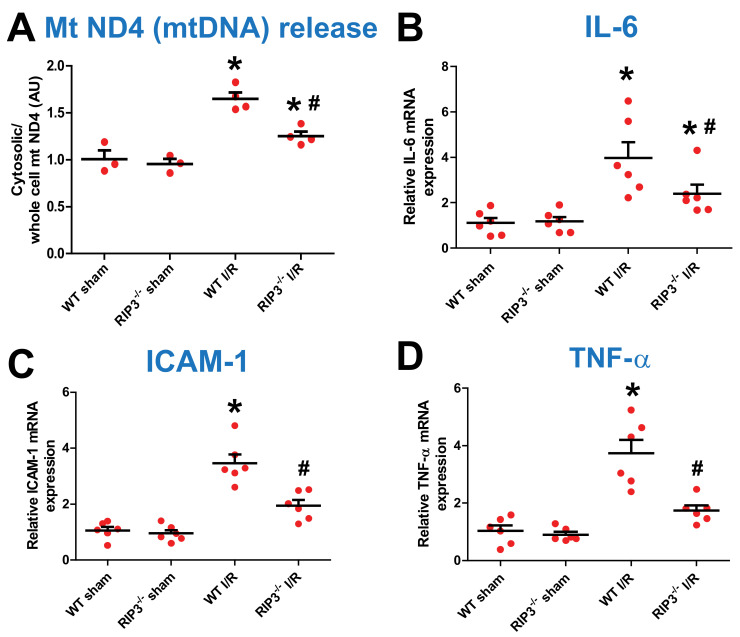
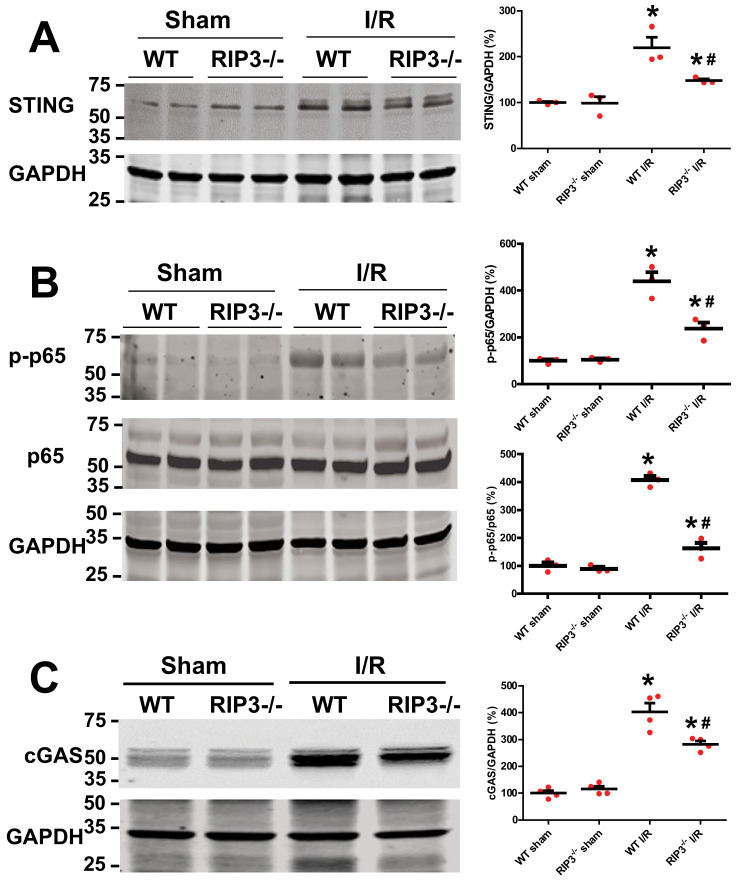
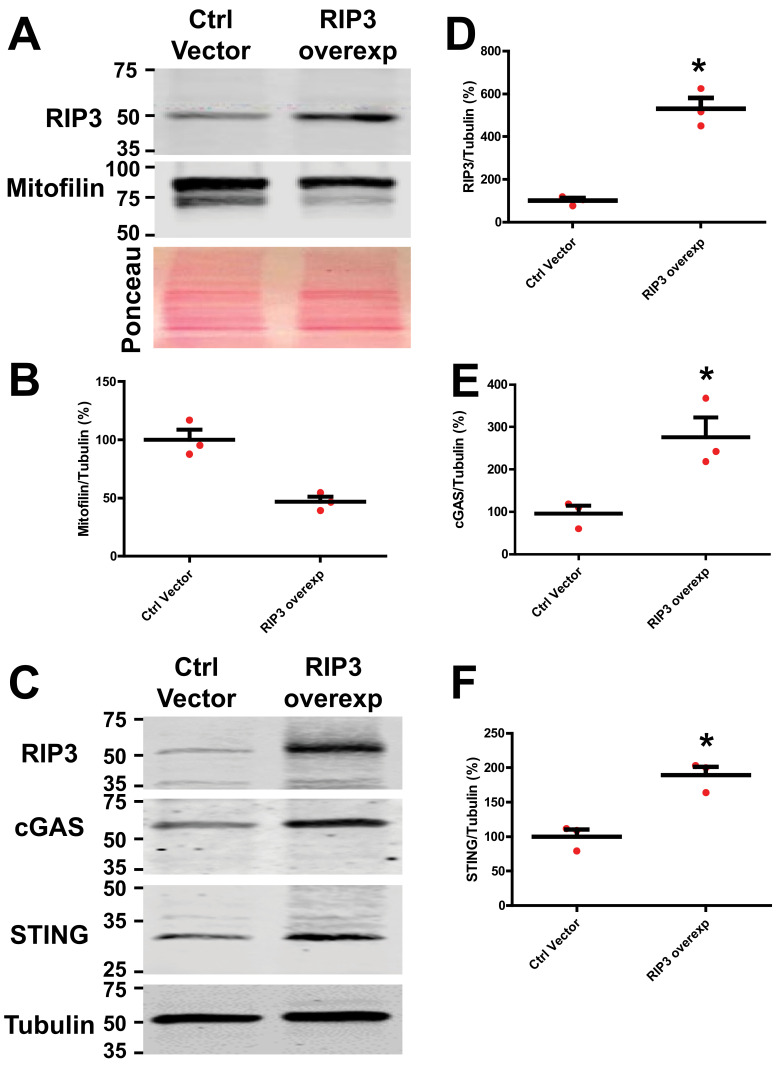
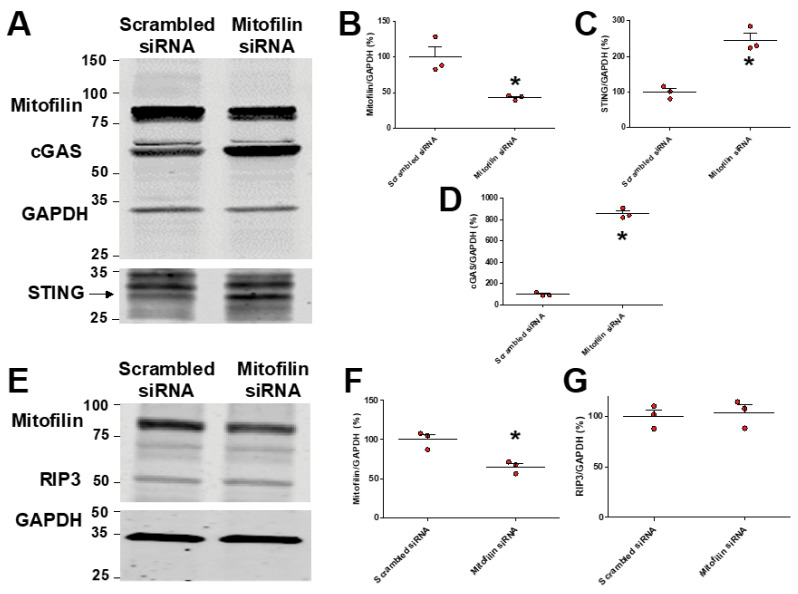
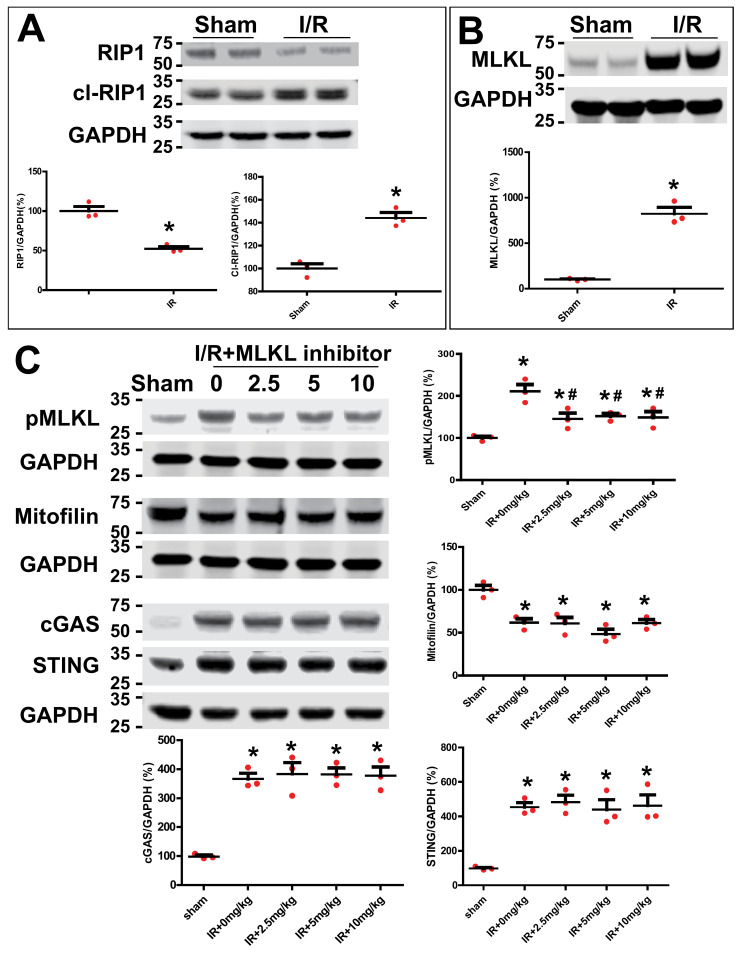
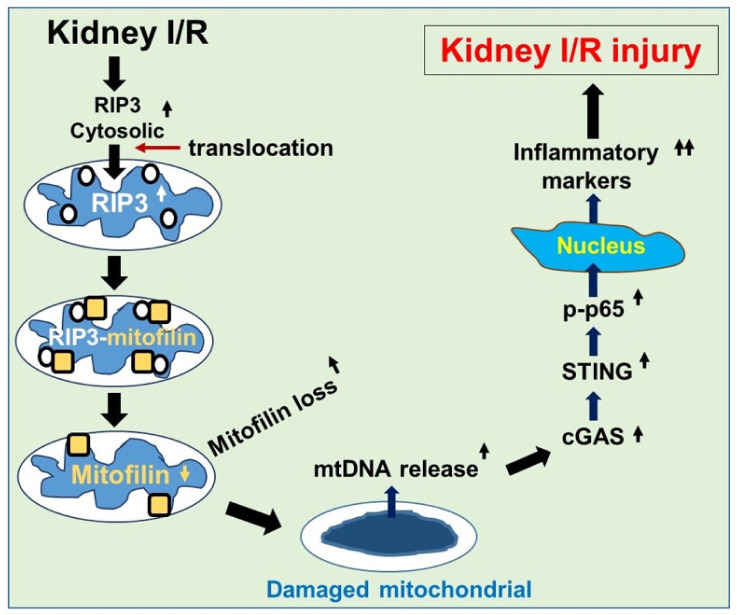
The receptor-interacting protein kinase 3 (RIP3) has been reported to regulate programmed necrosis-necroptosis forms of cell death with important functions in inflammation. We investigated whether RIP3 translocates into mitochondria in response to renal ischemia-reperfusion (I/R) to interact with inner mitochondrial protein (Mitofilin) and promote mtDNA release into the cytosol. We found that release of mtDNA activates the cGAS-STING pathway, leading to increased nuclear transcription of pro-inflammatory markers that exacerbate renal I/R injury. Monolateral C57/6N and RIP3-/- mice kidneys were subjected to 60 min of ischemia followed by either 12, 24, or 48 h of reperfusion. In WT mice, we found that renal I/R injury increased RIP3 levels, as well as its translocation into mitochondria. We observed that RIP3 interacts with Mitofilin, likely promoting its degradation, resulting in increased mitochondria damage and mtDNA release, activation of the cGAS-STING-p65 pathway, and increased transcription of pro-inflammatory markers. All of these effects observed in WT mice were decreased in RIP3-/- mice. In HK-2, RIP3 overexpression or Mitofilin knockdown increased cell death by activating the cGAS-STING-p65 pathway. Together, this study point to an important role of the RIP3-Mitofilin axis in the initiation and development of renal I/R injury.

Keywords: acute kidney injury (AKI); cGAS–STING–p65 pathway; inflammation; inner mitochondrial membrane protein (immt; mitochondrial dysfunction; mitochondrial structural integrity and function; mitofilin); mtDNA release; receptor-interacting protein kinase 3 (RIP3).


Conflict of interest statement

The authors declare no conflict of interest.

Figures

Figure 1
Figure 1
Renal I/R increases RIP3 expression and reduces Mitofilin levels. (A) Immunoblot and graph showing increases in RIP3 levels after 60 min of mono-lateral kidney ischemia followed by 12 h of reperfusion compared to sham animals (non-ischemic). Values are expressed as means ± SEM; * p < 0.05 versus sham group (n = 4/group). (B) Confocal images and graph showing increases in RIP3 levels in the kidney sections after 60 min ischemia followed by 12 min reperfusion compared to sham animals (non-ischemic). Values are expressed as means ± SEM; * p < 0.05 versus sham group (n = 4/group). (C) Immunoblot and graph showing increases in RIP3 levels in isolated mitochondria from kidney lysate in sham animals (non-ischemic) after 60 min of ischemia followed by several durations of reperfusion (12, 24, and 48 h) compared to sham animals (non-ischemic). This result indicates that RIP3 translocates in mitochondria after AKI. Values are expressed as means ± SEM; * p < 0.05 versus sham group (n = 4/group). (D) Immunoblot and graph showing reductions in Mitofilin levels in the isolated mitochondria from kidney lysate in sham animals (non-ischemic) and after 60 min of ischemia followed by several durations of reperfusion (12, 24, and 48 h) compared to sham animals (non-ischemic). Values are expressed as means ± SEM; * p < 0.05 versus sham group (n = 4/group).
Figure 2
Figure 2
Renal I/R stress increases RIP3 interaction with Mitofilin in mitochondria. (A) Immunoblots showing the link between RIP3 and Mitofilin in the inner mitochondrial membrane of HK-2 cells. Immunoprecipitation (IP) in whole-cell lysate fractions with myc-Mitofilin antibody immunoprecipitated flag-RIP3, which was revealed by Western blot analysis. Reverse Co-IP with flag-RIP3 confirmed the interaction between these two proteins, as myc-Mitofilin was detected in the immunoprecipitate; n = 3 independent experiments. (B) Confocal microscopy images of kidneys from sham animals and after AKI labeled with RIP3 (green) and Mitofilin (red) and the overlay of both proteins (yellow). The graph shows the increase in RIP3 and the reduction in Mitofilin levels after AKI compared with sham kidneys. These results indicate that the co-localization between Mitofilin and RIP3 is increased after AKI (60 min ischemia followed by 12 h reperfusion); * p < 0.05 versus sham group, respectively, n = 3 experiments.
Figure 3
Figure 3
RIP3−/− mice exhibit a decrease in kidney injury after renal I/R. (A) Genotype used to confirm the RIP3+/− and RIP3−/− mice versus the littermate WT mouse. Note that the RIP3+/− heterozygote mouse displayed both alleles (knockout and WT bands). (B) Immunoblot confirming the knockdown of RIP3 in RIP3−/− versus littermate WT mice. (C) Left: H&E staining images showing an increase in kidney injury in WT mice after renal I/R compared to the sham-operated animals. However, in RIP3−/− mice, the tubular injury was reduced when compared to littermate WT mice after renal I/R. Right: Graph showing an increase in kidney injury score in WT mice after renal I/R compared to the sham-operated animals. However, in RIP3−/− mice, the tubular injury was reduced when compared to littermate WT mice after renal I/R. Note that there was no difference in kidney injury between WT and RIP3−/− sham mice. In addition, the cell necrosis, loss of the brush border, cast formation, and tubular dilatation were defined as: 0, none; 1, ≤10%; 2, 11%–25%; 3, 26%–45%; 4, 46%–75%; 5, >76%. Values are expressed as means ± SEM; * p < 0.05 versus WT group; # p < 0.05 versus WT-I/R group, (n = 6/group). (D) Graph showing increases in the levels of serum creatine in WT mice after renal I/R compared to sham-operated animals. However, in RIP3−/− mice, the level of serum creatine was reduced when compared to littermate WT mice after renal I/R. Note that there was no difference in the levels of serum creatine between WT and RIP3−/− sham mice. Values are expressed as means ± SEM; * p < 0.05 versus WT-Sham group, respectively; # p < 0.05 versus WT-I/R group (n = 6/group).
Figure 4
Figure 4
Preservation of Mitofilin in RIP3−/− mice is associated with decreased mitochondrial damage and dysfunction after renal I/R. (A) Immunoblots showing dramatic reductions in Mitofilin levels after renal I/R compared to sham mitochondria in WT mice. However, in RIP3−/− mice, the levels of Mitofilin were higher when compared to littermate WT mice after renal I/R. Note that there was no difference in the levels of Mitofilin between WT and RIP3−/− sham mice. Values are expressed as means ± SEM; * p < 0.05 versus WT group; # p < 0.05 versus WT-I/R group (n = 4/group). (B) Images and graph of kidney tissues labeled with Mitofilin showing a dramatic reduction in Mitofilin signaling after renal I/R compared to sham mitochondria in WT mice. However, in RIP3−/− mice, the level of Mitofilin signaling was higher when compared to littermate WT mice after renal I/R. Note that there was no difference in the levels of Mitofilin signaling between WT and RIP3−/− sham mice. Values are expressed as means ± SEM; * p < 0.05 versus WT group; # p < 0.05 versus WT-I/R group (n = 4/group). (C) Immunoblots showing dramatic reductions in Oxphos (electron transport chain complex) levels after renal I/R compared to sham mitochondria in WT mice. Note the preservation of the levels of Oxphos complexes in RIP3−/− mitochondria compared to WT mitochondria after renal I/R.
Figure 5
Figure 5
RIP3 knockout protects against mitochondrial damage and dysfunction after renal I/R. (A) Electron microscopy images of mitochondria in kidney tissues showing a dramatic increase in cristae disruption after renal I/R compared to sham mitochondria in WT mice. However, in RIP3−/− mice, the level of cristae disruption was reduced when compared to littermate WT mice after renal I/R. Note that there was no difference in the levels of cristae disruption between WT and RIP3−/− sham mice. Bar graph showing percentage of damaged mitochondria in each group. Fragmented or disrupted cristae with empty spaces (in the matrix) were considered damaged mitochondria, while mitochondria with dense continuous cristae were considered as good or undamaged. A minimum of 100 mitochondria were counted in each group. Values are expressed as means ± SEM; * p <0.05 versus WT sham group, # p <0.05 versus WT-I/R group (n = 5/group). (B) Top: Recording of mitochondrial reactive oxygen species (ROS) production using Amplex red in the presence of horseradish peroxidase after stimulation of complex I with glutamate–malate. Bottom: Graph showing a dramatic increase in ROS production after renal I/R compared to sham group in WT mice mitochondria. However, in RIP3−/− mice, the ROS production was reduced when compared to littermate WT mice after renal I/R. Note that there was no difference in ROS production between WT and RIP3−/− sham mice. Values are expressed as means ± SEM; * p <0.05 versus WT sham group, # p <0.05 versus WT-I/R group (n = 4/group). (C) RIP3 knockout in mice protects the mitochondrial membrane potential as measured with the JC-1 dye stained in isolated mitochondria. Image (right) and graph (left) showing an increase in the green/red fluorescence intensity ratio (that indicate depolarization) in WT mitochondria after renal I/R compared to sham mitochondria. Note the reduction in the green/red fluorescence intensity ratio in RIP3−/− mice compared to WT mitochondria after renal I/R. Values are expressed as means ± SEM; * p <0.05 versus WT sham group, # p < 0.05 versus WT-I/R (n = 3/group). (D) RIP3 knockout in mice does not affect mitochondrial Ca2+ retention capacity (CRC) required to induce the mitochondrial permeability transition pore (mPTP) opening after renal I/R injury. Typical spectrofluorometric recordings of Ca2+ overload in mitochondria isolated from hearts after 60 min ischemia followed by 6 h reperfusion. Subsequently, 20 nmol-mg−1 of protein Ca2+ pulses was delivered until a spontaneous and massive release was observed, presumably to the opening of the mPTP (arrows). The graph shows no difference in mitochondrial CRC between WT and RIP3−/− mitochondria from the sham group after renal I/R and after renal I/R supplemented with cyclosporine A (mPTP opening inhibitor, 2 µM). Values are expressed as means ± SEM; * p < 0.05 versus WT sham group (n = 3/group).
Figure 6
Figure 6
RIP3−/− mice exhibit decreased mtDNA release and inflammation after renal I/R. (A) Graph showing an increase in mitochondrial DNA (mtDNA) release in the cytosol in WT mice after renal I/R compared with the sham-operated animals. However, in RIP3−/− mice, the release of mtDNA was reduced when compared to littermate WT mice after renal I/R. Note that there was no difference in mtDNA levels between WT and RIP3−/− sham mice. Values are expressed as means ± SEM; * p < 0.05 versus WT sham group, # p < 0.05 versus WT-I/R (n = 4/group). (BD) Graph showing increases in pro-inflammatory markers including IL-6, ICAM-1, and TNF-6 levels in the cytosol in WT mice after renal I/R compared with the sham-operated animals. However, in RIP3−/− mice, the release of these pro-inflammatory markers was reduced when compared to littermate WT mice after renal I/R. Note that there was no difference in pro-inflammatory markers between WT and RIP3−/− sham mice. Values are expressed as means ± SEM; * p < 0.05 versus WT sham group, # p < 0.05 versus WT-I/R (n = 6/group).
Figure 7
Figure 7
RIP3−/− mice exhibit decreased levels of cGAS, STING, and p-p65 after renal I/R. (A) Immunoblots and graph showing increases in STING levels after renal I/R compared to sham group in WT mice. However, in RIP3−/− mice, the levels of STING were reduced when compared to littermate WT mice after renal I/R. Note that there was no difference in the levels of STING between WT and RIP3−/− sham mice. Values are expressed as means ± SEM; * p < 0.05 versus WT sham group; # p < 0.05 versus WT-I/R (n = 3/group). (B) Immunoblots and graph showing an increase in p-p65 levels after renal I/R compared to sham in WT mice. However, in RIP3−/− mice, the levels of p-p65 were reduced when compared to littermate WT mice after renal I/R. Note that there was no difference in the levels of p-p65 between WT and RIP3−/− sham mice. Values are expressed as means ± SEM; * p < 0.05 versus WT sham group; # p < 0.05 versus WT-I/R (n = 4/group). (C) Immunoblots and graph showing increases in cGAS levels after renal I/R compared to sham in WT mice. However, in RIP3−/− mice, the levels of cGAS were reduced when compared to littermate WT mice after renal I/R. Note that there was no difference in the levels of cGAS between WT and RIP3−/− sham mice. Values are expressed as means ± SEM; * p < 0.05 versus WT sham group; # p < 0.05 versus WT-I/R (n = 4/group).
Figure 8
Figure 8
RIP3 overexpression in HK-2 cells increases the levels of cGAS and STING and reduces Mitofilin levels. (A) Immunoblots and graph (B) showing reductions in Mitofilin levels in HK-2 cells transfected with an RIP3-overexpressed plasmid compared to those transfected with pCMV6 control vector. (C) Immunoblots showing increases in the levels of cGAS and STING levels in HK-2 cells transfected with an RIP3-overexpressed plasmid compared to those transfected with pCMV6 control vector (DF). Graph showing increases in the levels of RIP 3 (D), cGAS (E), and STING (F) in HK-2 cells transfected with an RIP3-overexpressed plasmid compared to those transfected with pCMV6 control vector. Values are expressed as means ± SEM; * p < 0.05 versus control (Ctrl) vector group (n = 3/group).
Figure 9
Figure 9
Mitofilin knockdown in HK-2 cells increases the levels of cGAS and STING, with no effect on RIP3 levels. (A) Immunoblots showing increases in the levels of cGAS and STING in HK-2 cells transfected with Mitofilin siRNA compared to those transfected with scrambled siRNA (n = 3 experiments). (BD) Graph showing increases in the levels of cGAS (D) and STING (C) and reductions in Mitofilin (B) levels in HK-2 cells transfected with Mitofilin siRNA compared to those transfected with scrambled siRNA. Values are expressed as means ± SEM; * p < 0.05 versus control (Ctrl) vector group (n = 3/group). (E) Immunoblots showing no difference in the levels of RIP3 in HK-2 cells transfected with Mitofilin siRNA compared to those transfected with scrambled siRNA (n = 3 experiments). (F,G) Graph showing reductions in Mitofilin (F) levels and no change in RIP3 levels (G) in HK-2 cells transfected with Mitofilin siRNA compared to those transfected with scrambled siRNA. Values are expressed as means ± SEM; * p < 0.05 versus control (Ctrl) vector group (n = 3/group).
Figure 10
Figure 10
Inhibition of MLKL does not affect cGAS–STING pathway in renal I/R injury. (A) Immunoblot and graph showing increases in the levels of cl-RIP1 and reductions in RIP1 levels after renal I/R injury compared to sham group. Values are expressed as means ± SEM; * p < 0.05 versus sham group (n = 3/group). (B) Immunoblot and graph showing dramatic increases in MLKL levels after renal I/R injury compared to sham group. Values are expressed as means ± SEM; * p < 0.05 versus sham group (n = 3/group). (C) Immunoblots showing no changes in cGAS, STING, and Mitofilin levels in kidneys treated with different doses (0, 2.5, 5, and 10 mg/kg) of MLKL inhibitor after renal I/R injury. Note that all doses of the MLKL inhibitor were able to significantly reduce the MLKL phosphorylation; * p < 0.05 versus sham group; # p < 0.05 versus I/R+0mg/kg group (n = 3/group).
Figure 11
Figure 11
Graphic abstract summarizing the proposed mechanism whereby increased RIP3 in response to renal I/R reduces Mitofilin levels to amplify inflammation and exacerbates kidney injury. An increase in cytosolic RIP3 levels in response to kidney I/R promotes the translocation of RIP3 into the mitochondria, where it interacts with and favors Mitofilin degradation, leading to increased mitochondrial structural damage and dysfunction. The following increase in ROS production in the mitochondria is proposed to enable mtDNA damage and release into the cytosol, where the mtDNA activates the cGAS–STING–p-p65 pathway, leading to increased nuclear transcription of pro-inflammatory markers that subsequently exacerbate renal I/R injury.

Similar articles

Cited by

References

    1. Moriwaki K., Chan F.K. RIP3: A molecular switch for necrosis and inflammation. Genes Dev. 2013;27:1640–1649. doi: 10.1101/gad.223321.113. - DOI - PMC - PubMed
    1. Yu P.W., Huang B.C., Shen M., Quast J., Chan E., Xu X., Nolan G.P., Payan D.G., Luo Y. Identification of RIP3, a RIP-like kinase that activates apoptosis and NFkappaB. Curr. Biol. 1999;9:539–542. doi: 10.1016/S0960-9822(99)80239-5. - DOI - PubMed
    1. Weber K., Roelandt R., Bruggeman I., Estornes Y., Vandenabeele P. Nuclear RIPK3 and MLKL contribute to cytosolic necrosome formation and necroptosis. Commun. Biol. 2018;1:6. doi: 10.1038/s42003-017-0007-1. - DOI - PMC - PubMed
    1. Seifert L., Miller G. Molecular Pathways: The Necrosome-A Target for Cancer Therapy. Clin. Cancer. Res. 2017;23:1132–1136. doi: 10.1158/1078-0432.CCR-16-0968. - DOI - PMC - PubMed
    1. Murphy J.M., Czabotar P.E., Hildebrand J.M., Lucet I.S., Zhang J.G., Alvarez-Diaz S., Lewis R., Lalaoui N., Metcalf D., Webb A.I., et al. The pseudokinase MLKL mediates necroptosis via a molecular switch mechanism. Immunity. 2013;39:443–453. doi: 10.1016/j.immuni.2013.06.018. - DOI - PubMed

Publication types

MeSH terms

Substances