. 2022 Jun 17;11(12):1955.
doi: 10.3390/cells11121955.

Generating iPSCs with a High-Efficient, Non-Invasive Method-An Improved Way to Cultivate Keratinocytes from Plucked Hair for Reprogramming

Affiliations

Generating iPSCs with a High-Efficient, Non-Invasive Method-An Improved Way to Cultivate Keratinocytes from Plucked Hair for Reprogramming

Lisa S Wüstner et al. Cells. .

Abstract

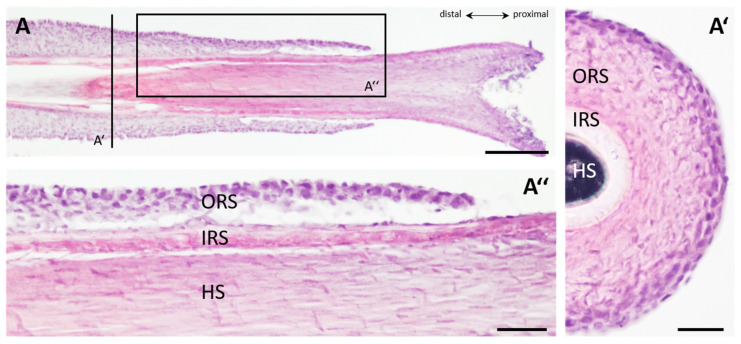
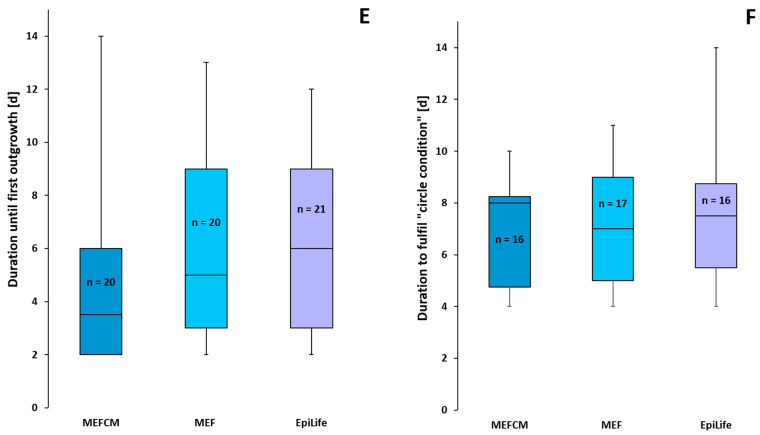
Various somatic cell types are suitable for induced pluripotency reprogramming, such as dermal fibroblasts, mesenchymal stem cells or hair keratinocytes. Harvesting primary epithelial keratinocytes from plucked human hair follicles (HFs) represents an easy and non-invasive alternative to a fibroblast culture from invasive skin biopsies. Nevertheless, to facilitate and simplify the process, which can be divided into three main steps (collecting, culturing and reprogramming), the whole procedure of generating hair keratinocytes has to be revised and upgraded continuously. In this study, we address advancements and approaches which improve the generation and handling of primary HF-derived keratinocytes tremendously, e.g., for iPSCs reprogramming. We not only evaluated different serum- and animal-origin-free media, but also supplements and coating solutions for an enhanced protocol. Here, we demonstrate the importance of speed and accuracy in the collecting step, as well as the choice of the right transportation medium. Our results lead to a more defined approach that further increases the reliability of downstream experiments and inter-laboratory reproducibility. These improvements will make it possible to obtain keratinocytes from plucked human hair for the generation of donor-specific iPSCs easier and more efficient than ever before, whilst preserving a non-invasive capability.

Keywords: hair follicle (HF); induced pluripotent stem cells (iPSCs); keratinocytes; plucked human hair.


Conflict of interest statement

The authors declare no conflict of interest.

Figures

Figure 1
Figure 1
Anatomical structure and influence of ambient air exposure to plucked human hair follicles. (A) H&E staining of a sectioned, plucked human hair follicle. Longitudinal section with higher magnification of the proximal suprabulbar portion identifies the different layers shown in (A″) (black box). (A′), Distal cross-section of a human hair follicle (HF) displayed by a black line depicted in A. Outer root sheath (ORS) indicates the outermost layer with darker nuclear staining, followed by the inner root sheath (IRS) and the hair shaft (HS). (B) DIC picture of intact plucked human HF with clearly visible ORS and fully keratinized HS. (C) DIC picture of HF exposed to ambient air for 120 s with dried ORS. Subjective observation of visibly dried HFs before (D) and after transportation for 45 min in DMEM (E) exposed to air ranging from 10 s to 120 s. Percentage of outgrowing keratinocytes in relation to their exposure time to ambient air (10 s, 30 s, 60 s, 90 s, 120 s) before (F) and after (G) transfer to the transportation medium. Diameter of HFs exposed to ambient air for different time periods (10 s, 30 s, 60 s, 90 s, 120 s) relative to non-treated HFs before (H) and after (I) transferring into the transportation medium. TTEST p < 0.05 *, p < 0.01 **, p < 0.001 ***. N = number of single, independent experiments. Scale bar: 200 µm (A), 50 µm (A′,A″), 500 µm (B,C).
Figure 1
Figure 1
Anatomical structure and influence of ambient air exposure to plucked human hair follicles. (A) H&E staining of a sectioned, plucked human hair follicle. Longitudinal section with higher magnification of the proximal suprabulbar portion identifies the different layers shown in (A″) (black box). (A′), Distal cross-section of a human hair follicle (HF) displayed by a black line depicted in A. Outer root sheath (ORS) indicates the outermost layer with darker nuclear staining, followed by the inner root sheath (IRS) and the hair shaft (HS). (B) DIC picture of intact plucked human HF with clearly visible ORS and fully keratinized HS. (C) DIC picture of HF exposed to ambient air for 120 s with dried ORS. Subjective observation of visibly dried HFs before (D) and after transportation for 45 min in DMEM (E) exposed to air ranging from 10 s to 120 s. Percentage of outgrowing keratinocytes in relation to their exposure time to ambient air (10 s, 30 s, 60 s, 90 s, 120 s) before (F) and after (G) transfer to the transportation medium. Diameter of HFs exposed to ambient air for different time periods (10 s, 30 s, 60 s, 90 s, 120 s) relative to non-treated HFs before (H) and after (I) transferring into the transportation medium. TTEST p < 0.05 *, p < 0.01 **, p < 0.001 ***. N = number of single, independent experiments. Scale bar: 200 µm (A), 50 µm (A′,A″), 500 µm (B,C).
Figure 2
Figure 2
Light microscopy pictures of cultured HFs with the “circle condition”. A circle with a defined area of 0.3 mm in diameter is attached below the culture vessel. (A) Intact HF with the first outgrowing keratinocytes. Keratinocytes have not yet fulfilled the “circle condition”. (B) Keratinocyte cell layer reaching the size of the defined area of the circle and therefore categorized as achieved “circle condition”. This criterium is reached after an average of 6 to 8 days. Scale bar: 500 µm.
Figure 3
Figure 3
Outgrowth of HFs with respect to different transportation and storage conditions. (A) Relative outgrowth of keratinocytes from HFs after storage for a maximum of 2 h in either DMEM, DPBS−/−, NaCl or water (H2O). (B) Outgrowth after 24 h in the same four tested media. Keratinocytes stored in DMEM show the highest outgrowth rate. (C) Outgrowth of keratinocytes from HFs in percentanges after being stored in DMEM for a maximum of 2 h, 24 h, 48 h or 7 days (d). N = number of single, independent experiments.
Figure 4
Figure 4
Influence of different culture media on keratinocyte outgrowth from HFs. Relative outgrowth of keratinocytes from HFs after cultivation in five different media (MEFCM, MEF medium, EpiLife medium, DK-SFM, KGM2) after <2 h (A), 24 h (B), 48 h (C) and 7 d (D) in DMEM transportation media. Both commercially available media DK-SFM and KGM2 showed the lowest outgrowth rate. Three different media (MEFCM, MEF medium, EpiLife medium) were compared for the time period until the first keratinocytes appear (E) and the time to fulfil the circle condition (F). Significance is indicated via asterisks (Chi2 test (1) = 16.3, p < 0.001). p-value: p < 0.001 ***. N = number of single, independent experiments.
Figure 4
Figure 4
Influence of different culture media on keratinocyte outgrowth from HFs. Relative outgrowth of keratinocytes from HFs after cultivation in five different media (MEFCM, MEF medium, EpiLife medium, DK-SFM, KGM2) after <2 h (A), 24 h (B), 48 h (C) and 7 d (D) in DMEM transportation media. Both commercially available media DK-SFM and KGM2 showed the lowest outgrowth rate. Three different media (MEFCM, MEF medium, EpiLife medium) were compared for the time period until the first keratinocytes appear (E) and the time to fulfil the circle condition (F). Significance is indicated via asterisks (Chi2 test (1) = 16.3, p < 0.001). p-value: p < 0.001 ***. N = number of single, independent experiments.
Figure 5
Figure 5
Comparison of KGM2 and EpiLife as secondary media. (A) Graph showing the days (d) until the keratinocytes achieve the “circle condition”. Keratinocytes were growing either in EpiLife or KGM2 media following the initial outgrowth in MEFCM. Overview DIC image of confluent keratinocytes cultured in either secondary EpiLife (B) or KGM2 (C) media. Notice the terminally differentiated keratinocytes in the KGM2 (C) with a large, polygonal-shaped cytoplasm. High magnification image of keratinocytes grown in MEFCM + EpiLife medium (B′B‴) and MEFCM + KGM2 (C′C‴) in a DIC image, immunostained for CK5,10,14 (green) and nuclear marker DAPI (blue). Ki67 staining (red) for the visualization of dividing keratinocytes either in Epilife medium (D) or KGM2 (E). Keratinocytes were counterstained for CK14 (green) and nuclear marker DAPI (blue). N = number of single, independent experiments. Scale bar: 400 µm (B,C), 50 µm (B′B‴,C′C‴,D,E).
Figure 5
Figure 5
Comparison of KGM2 and EpiLife as secondary media. (A) Graph showing the days (d) until the keratinocytes achieve the “circle condition”. Keratinocytes were growing either in EpiLife or KGM2 media following the initial outgrowth in MEFCM. Overview DIC image of confluent keratinocytes cultured in either secondary EpiLife (B) or KGM2 (C) media. Notice the terminally differentiated keratinocytes in the KGM2 (C) with a large, polygonal-shaped cytoplasm. High magnification image of keratinocytes grown in MEFCM + EpiLife medium (B′B‴) and MEFCM + KGM2 (C′C‴) in a DIC image, immunostained for CK5,10,14 (green) and nuclear marker DAPI (blue). Ki67 staining (red) for the visualization of dividing keratinocytes either in Epilife medium (D) or KGM2 (E). Keratinocytes were counterstained for CK14 (green) and nuclear marker DAPI (blue). N = number of single, independent experiments. Scale bar: 400 µm (B,C), 50 µm (B′B‴,C′C‴,D,E).
Figure 6
Figure 6
Growth behavior of keratinocytes on different coating solutions. (A) Relative primary outgrowth of HFs in different media (MEFCM, MEF medium, EpiLife medium) and coating conditions (Matrigel, collagen I coating matrix). (B) Representative DIC image of the distal part of an HF with confluent keratinocytes growing on a 1:10 diluted Matrigel coating after 9 days of cultivation. (C) Distal part of an HF with scattered keratinocytes outgrowing on the coating matrix kit after 9 days of cultivation. N = number of single, independent experiments. Scale bar: 500 µm.
Figure 7
Figure 7
Influence of Matrigel droplet dilution on keratinocyte outgrowth. Keratinocyte growth behavior in different Matrigel mounting droplets (without drops (w/o); 1:5; 1:2,5; pure). DIC images of adherent keratinocytes growing under different coating conditions. After 6 days (6 d) of culturing (AC) and after 2 weeks (2 w) of culturing (DF). Relative outgrowth (G) and detaching (H) of HFs within four different Matrigel droplet dilutions. Analysis of the duration until the first outgrowth from HFs (I) and the time needed to fulfil the “circle condition” (J) with respect to the four different coating conditions. N = number of single, independent experiments. Scale bar: 500 µm.
Figure 7
Figure 7
Influence of Matrigel droplet dilution on keratinocyte outgrowth. Keratinocyte growth behavior in different Matrigel mounting droplets (without drops (w/o); 1:5; 1:2,5; pure). DIC images of adherent keratinocytes growing under different coating conditions. After 6 days (6 d) of culturing (AC) and after 2 weeks (2 w) of culturing (DF). Relative outgrowth (G) and detaching (H) of HFs within four different Matrigel droplet dilutions. Analysis of the duration until the first outgrowth from HFs (I) and the time needed to fulfil the “circle condition” (J) with respect to the four different coating conditions. N = number of single, independent experiments. Scale bar: 500 µm.
Figure 8
Figure 8
Reprogramming of HF-derived keratinocytes with different methods. Alkaline phosphatase (AP) staining of reprogrammed keratinocytes from the EpiLife medium (A) and KGM2 (B). Exemplary dotted lines mark the alkaline-phosphatase-positive iPSC colonies. (C) Higher magnification of AP-positive iPSCs growing on the MEF feeder layer. (D) Graph shows the amount of AP-positive iPSC colonies per well using different infection media and methods. N = number of single, independent experiments. Scale bar: 500 µm.

Similar articles

Cited by

References

    1. Feng C., Jia Y.D., Zhao X.Y. Pluripotency of induced pluripotent stem cells. Genom. Proteom. Bioinform. 2013;11:299–303. doi: 10.1016/j.gpb.2013.08.003. - DOI - PMC - PubMed
    1. Abu-Dawud R., Graffmann N., Ferber S., Wruck W., Adjaye J. Pluripotent stem cells: Induction and self-renewal. Philos. Trans. R. Soc. Lond. B Biol. Sci. 2018;373:20170213. doi: 10.1098/rstb.2017.0213. - DOI - PMC - PubMed
    1. Sobhani A., Khanlarkhani N., Baazm M., Mohammadzadeh F., Najafi A., Mehdinejadiani S., Aval F.S. Multipotent Stem Cell and Current Application. Acta Med. Iran. 2017;55:6–23. - PubMed
    1. Shafa M., Yang F., Fellner T., Rao M.S., Baghbaderani B.A. Human-Induced Pluripotent Stem Cells Manufactured Using a Current Good Manufacturing Practice-Compliant Process Differentiate Into Clinically Relevant Cells From Three Germ Layers. Front. Med. 2018;5:69. doi: 10.3389/fmed.2018.00069. - DOI - PMC - PubMed
    1. Takahashi K., Tanabe K., Ohnuki M., Narita M., Ichisaka T., Tomoda K., Yamanaka S. Induction of pluripotent stem cells from adult human fibroblasts by defined factors. Cell. 2007;131:861–872. doi: 10.1016/j.cell.2007.11.019. - DOI - PubMed

Publication types