. 2022 May 28;12(6):1343.
doi: 10.3390/diagnostics12061343.

Translation of a Protease Turnover Assay for Clinical Discrimination of Mucinous Pancreatic Cysts

Affiliations

Translation of a Protease Turnover Assay for Clinical Discrimination of Mucinous Pancreatic Cysts

Vallabh Suresh et al. Diagnostics (Basel). .

Abstract

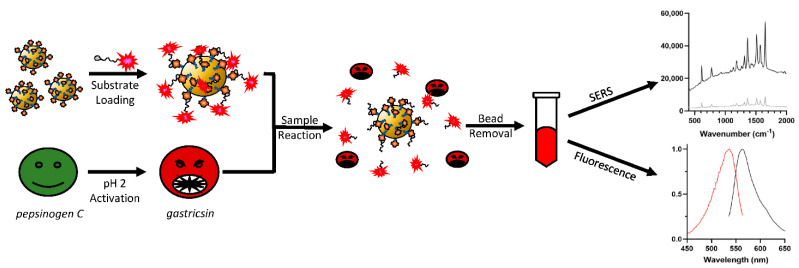
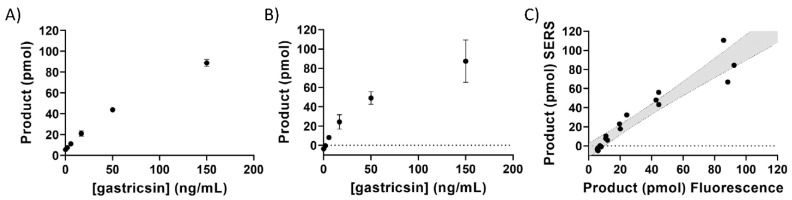
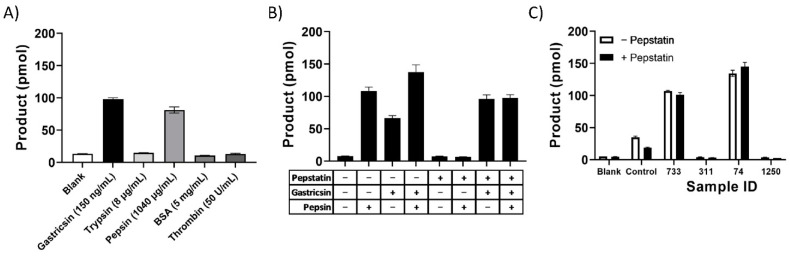
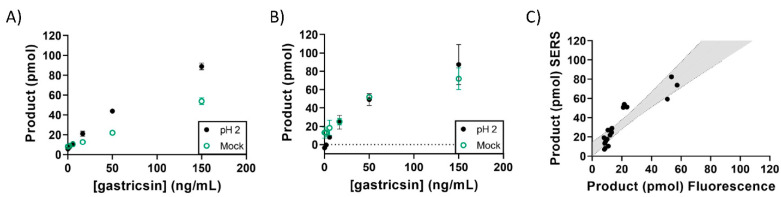
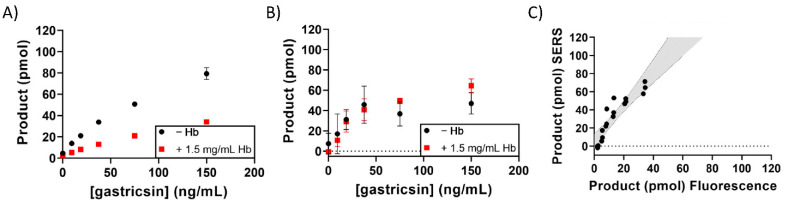
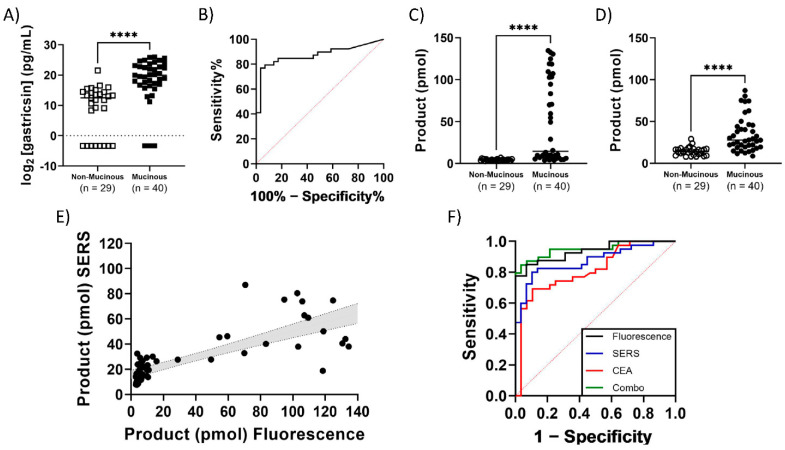
The classification of pancreatic cyst fluids can provide a basis for the early detection of pancreatic cancer while eliminating unnecessary procedures. A candidate biomarker, gastricsin (pepsin C), was found to be present in potentially malignant mucinous pancreatic cyst fluids. A gastricsin activity assay using a magnetic bead-based platform has been developed using immobilized peptide substrates selective for gastricsin bearing a dimeric rhodamine dye. The unique dye structure allows quantitation of enzyme-cleaved product by both fluorescence and surface enhanced Raman spectroscopy (SERS). The performance of this assay was compared with ELISA assays of pepsinogen C and the standard of care, carcinoembryonic antigen (CEA), in the same clinical sample cohort. A retrospective cohort of mucinous (n = 40) and non-mucinous (n = 29) classes of pancreatic cyst fluid samples were analyzed using the new protease activity assay. For both assay detection modes, successful differentiation of mucinous and non-mucinous cyst fluid was achieved using 1 µL clinical samples. The activity-based assays in combination with CEA exhibit optimal sensitivity and specificity of 87% and 93%, respectively. The use of this gastricsin activity assay requires a minimal volume of clinical specimen, offers a rapid assay time, and shows improvements in the differentiation of mucinous and non-mucinous cysts using an accurate standardized readout of product formation, all without interfering with the clinical standard of care.

Keywords: early detection; matrix effects; minimal volume; mucinous; non-mucinous; pancreatic cancer; surface-enhanced Raman spectroscopy (SERS).


Conflict of interest statement

K.B., U.C.R. and D.A.S. were funded by Amplified Sciences, and disclose financial incentives with Amplified Sciences via stock options. V.J.D. is CSO of Amplified Sciences, and has financial connections therein. C.S.C. also has stock option considerations from Amplified Sciences, as well as Alaunus Biosciences. F.C. has stock options from Alaunus Biosciences.

Figures

Figure 1
Figure 1
Scheme for conditional gastricsin activity assay. Briefly, magnetic beads are loaded with gastricsin substrate, and any unbound material is washed away. Gastricsin samples (research or clinical) are activated by incubation at pH 2 at room temperature prior to mixing with substrate-loaded beads. Equal volumes of enzyme solution and bead suspension are mixed for a predetermined amount of time, then the beads are removed with a magnetic tube rack. The resulting solution contains enzyme and reaction product at pH 2, which is quantified by either fluorescence or SERS measurements.
Figure 2
Figure 2
Gastricsin activity assay in pH 2 buffer. (A) The product formation is calculated from fluorescence measurement at each concentration of gastricsin as indicated on the x-axis. (B) The product formation calculated from SERS measurements at each concentration of gastricsin. The samples in (A) were used for these measurements after addition of silver. Error bars represent the standard deviation of triplicate measurements. (C) Correlation of product formation between SERS and fluorescence measurements from paired reaction samples. The grey area is the 95% confidence interval from a linear regression analysis with a slope = 1.075 and R2 = 0.914.
Figure 3
Figure 3
Specificity of assay for gastricsin. (A) Activity of VS001 substrate loaded onto beads with proteolytic enzymes and bovine serum albumin (BSA). Concentrations for each analyte are listed in parentheses. (B) Impact of 50 nM pepstatin on activity of 150 ng/mL gastricsin and/or 1 µg/mL pepsin in assay as indicated in the table below where “+” indicates addition of analyte. (C) Impact of the addition of pepstatin to assay buffer for clinical sample analysis. Controls are mock samples prepared with gastricsin at 150 ng/mL. Error bars represent standard deviation of triplicate measurements.
Figure 4
Figure 4
Gastricsin activity assay in samples comprised of a mock mucus matrix containing pancreatic enzymes with a viscosity of 1.5 cP to simulate a pancreatic cyst fluid sample. (A) Measured product formation calculated from fluorescence measurement at each concentration of gastricsin as indicated on the x-axis. (B) Measured product formation calculated from SERS measurement at each concentration of gastricsin as indicated on the x-axis. The samples are the exact same from panel (A). Error bars represent the standard deviation of triplicate measurements. (C) Correlation of product formation between SERS and fluorescence measurements from paired reaction samples. The grey area is the 95% confidence interval from a linear regression analysis with a slope = 1.293 and R2 = 0.836.
Figure 5
Figure 5
Gastricsin activity assay in samples comprised of a mock mucus matrix containing pancreatic enzymes with a viscosity of 1.5 cP, while the assay buffer contained the indicated concentration of Hb to simulate a bloody pancreatic cyst fluid sample. (A) Measured product formation calculated from fluorescence measurement at each concentration of gastricsin as indicated on the x-axis. (B) Measured product formation calculated from SERS measurement at each concentration of gastricsin as indicated on the x-axis. The samples are the exact same from panel (A). Error bars represent the standard deviation of triplicate measurements. (C) Correlation of product formation between SERS and fluorescence measurements from paired reaction samples. The grey area is the 95% confidence interval from a linear regression analysis with slope = 1.940 and R2 = 0.828.
Figure 6
Figure 6
Clinical sample results from a retrospective cohort of 69 pancreatic cyst fluid samples with known clinical diagnoses. (A) The measured mass of pepsinogen C according to commercial ELISA kit. (B) ROC curve of ELISA measurement of pepsinogen C mass to distinguish mucinous from non-mucinous pancreatic cysts (AUC = 0.873, 95% CI 0.794–0.900). (C) Measured product formation calculated from fluorescence measurement of clinical samples. (D) Measured product formation calculated from SERS measurement of clinical samples. Sample measurements are paired and both (C,D) are divided into respective diagnosis category as indicated on the x-axis. (E) Correlation of product formation between SERS and fluorescence measurements from paired reaction samples. The grey area is the 95% confidence interval from a linear regression analysis with a slope = 0.348 and R2 = 0.614. Every measurement represents a single reaction and sample. (F) ROC curve of clinical samples diagnosed according to the gastricsin activity assay using the product formation calculated from fluorescence (black, AUC = 0.936, 95% CI 0.882–0.990) or SERS (blue, AUC = 0.873, 95% CI 0.791–0.956), in comparison with clinical CEA measurement (red, AUC = 0.812, 95% CI 0.707–0.918) and a combination of all three (green, AUC = 0.950, 95% CI 0.900–1.000). **** = p < 0.0001 according to a Mann–Whitney test of significance.

References

    1. Rahib L., Smith B.D., Aizenberg R., Rosenzweig A.B., Fleshman J.M., Matrisian L.M. Projecting Cancer Incidence and Deaths to 2030: The Unexpected Burden of Thyroid, Liver, and Pancreas Cancers in the United States. Cancer Res. 2014;74:2913–2921. doi: 10.1158/0008-5472.CAN-14-0155. - DOI - PubMed
    1. Cancer Facts & Figures 2022 American Cancer Society. [(accessed on 2 February 2022)]. Available online: https://www.cancer.org/research/cancer-facts-statistics/all-cancer-facts....
    1. Kenner B.J., Go V.L.W., Chari S.T., Goldberg A.E., Rothschild L.J. Early Detection of Pancreatic Cancer. Pancreas. 2017;46:1238–1241. doi: 10.1097/MPA.0000000000000939. - DOI - PMC - PubMed
    1. Singhi D.A., Koay J.E., Chari S.T., Maitra A. Early Detection of Pancreatic Cancer: Opportunities and Challenges. Gastroenterology. 2019;156:2024–2040. doi: 10.1053/j.gastro.2019.01.259. - DOI - PMC - PubMed
    1. Chari S.T., Kelly K., Hollingsworth M.A., Thayer S.P., Ahlquist D.A., Andersen D.K., Batra S.K., Brentnall T.A., Canto M., Cleeter D.F., et al. Early Detection of Sporadic Pancreatic Cancer. Pancreas. 2015;44:693–712. doi: 10.1097/MPA.0000000000000368. - DOI - PMC - PubMed