. 2022 Jun 20;12(6):1501.
doi: 10.3390/diagnostics12061501.

Different Lung Parenchyma Quantification Using Dissimilar Segmentation Software: A Multi-Center Study for COVID-19 Patients

Affiliations

Different Lung Parenchyma Quantification Using Dissimilar Segmentation Software: A Multi-Center Study for COVID-19 Patients

Camilla Risoli et al. Diagnostics (Basel). .

Abstract

Background: Chest Computed Tomography (CT) imaging has played a central role in the diagnosis of interstitial pneumonia in patients affected by severe acute respiratory syndrome coronavirus 2 (SARS-CoV-2) and can be used to obtain the extent of lung involvement in COVID-19 pneumonia patients either qualitatively, via visual inspection, or quantitatively, via AI-based software. This study aims to compare the qualitative/quantitative pathological lung extension data on COVID-19 patients. Secondly, the quantitative data obtained were compared to verify their concordance since they were derived from three different lung segmentation software.

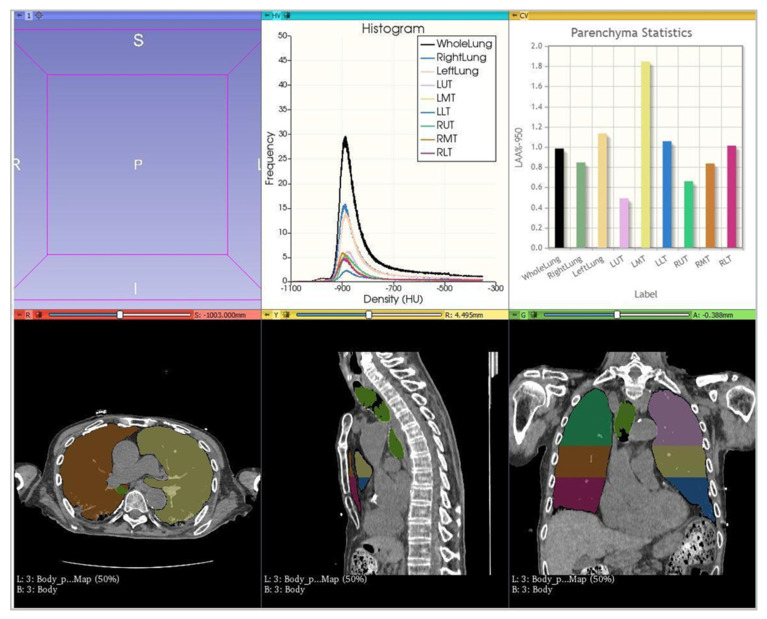
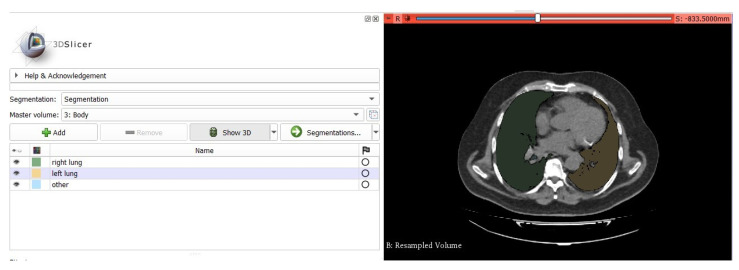
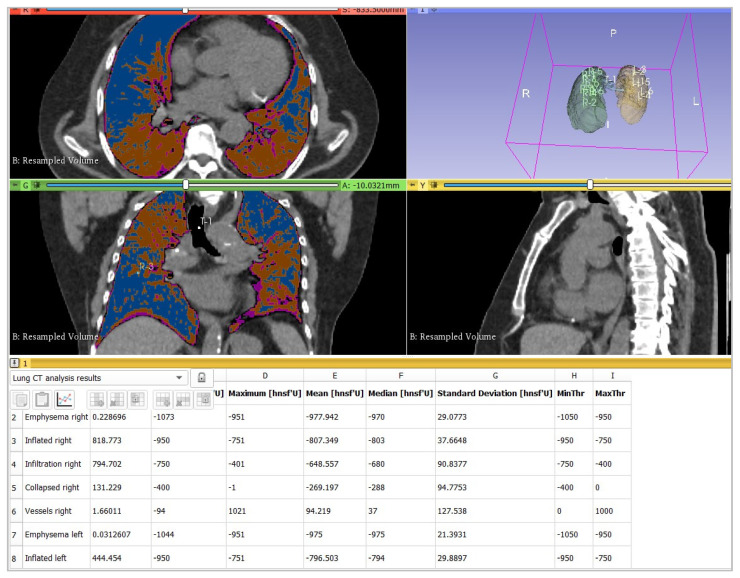
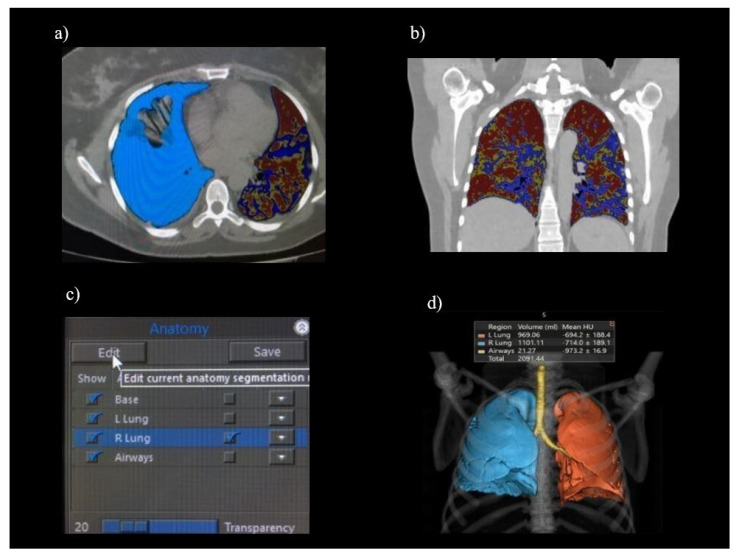
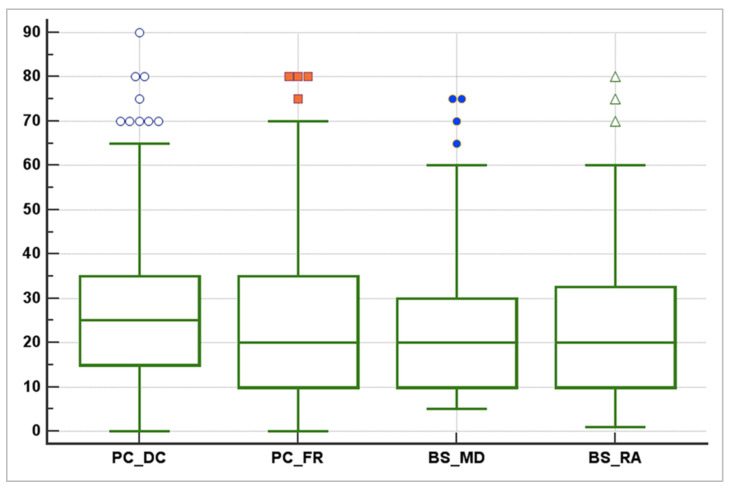
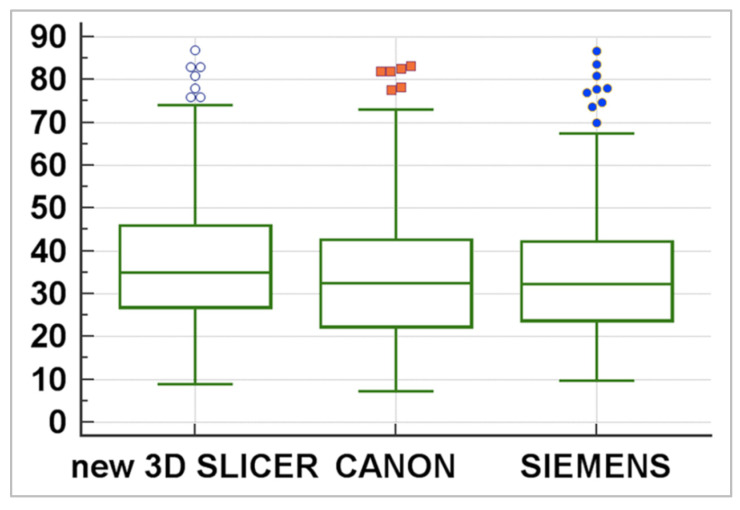
Methods: This double-center study includes a total of 120 COVID-19 patients (60 from each center) with positive reverse-transcription polymerase chain reaction (RT-PCR) who underwent a chest CT scan from November 2020 to February 2021. CT scans were analyzed retrospectively and independently in each center. Specifically, CT images were examined manually by two different and experienced radiologists for each center, providing the qualitative extent score of lung involvement, whereas the quantitative analysis was performed by one trained radiographer for each center using three different software: 3DSlicer, CT Lung Density Analysis, and CT Pulmo 3D.

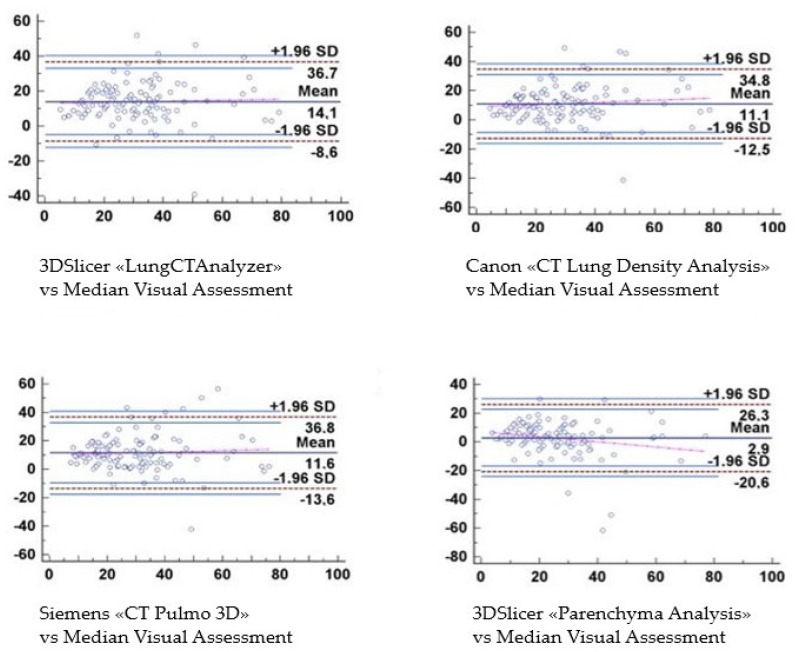
Results: The agreement between radiologists for visual estimation of pneumonia at CT can be defined as good (ICC 0.79, 95% CI 0.73-0.84). The statistical tests show that 3DSlicer overestimates the measures assessed; however, ICC index returns a value of 0.92 (CI 0.90-0.94), indicating excellent reliability within the three software employed. ICC was also performed between each single software and the median of the visual score provided by the radiologists. This statistical analysis underlines that the best agreement is between 3D Slicer "LungCTAnalyzer" and the median of the visual score (0.75 with a CI 0.67-82 and with a median value of 22% of disease extension for the software and 25% for the visual values).

Conclusions: This study provides for the first time a direct comparison between the actual gold standard, which is represented by the qualitative information described by radiologists, and novel quantitative AI-based techniques, here represented by three different commonly used lung segmentation software, underlying the importance of these specific values that in the future could be implemented as consistent prognostic and clinical course parameters.

Keywords: COVID-19 pneumonia; chest CT; lung segmentation; post-processing tools; semi-automatic segmentation software.


Conflict of interest statement

The authors declare no conflict of interest.

Figures

Figure 1
Figure 1
Lung segmentation provided by 3DSlicer. In the first stripe, two graphics concerning the extensions of different densities are shown. In the second stripe, there are three representations of the lung segmentation as provided by the 3DSlicer software, in axial, sagittal, and coronal multiplanar reconstructions.
Figure 2
Figure 2
The 3DSlicer manual tool (“Segment Editor”) accomplished the unsatisfactory segmentation. In this section, the user can perform a manual segmentation using the colors listed on the left board.
Figure 3
Figure 3
LungCTAnalyzer and the thresholds used. Here is an example of the analysis pursued. It was quantified that the “emphysematous”, “inflated”, “infiltrated”, and “collapsed” lung parenchyma were affected, and also their respective percentages were calculated.
Figure 4
Figure 4
CT Lung Density Analysis. This image shows: (a) parenchyma contouring; (b) lesion display; (c) manual editing; (d) final result with a volumetric rendering.
Figure 5
Figure 5
CT Lung Density Analysis: histogram of attenuation areas. The red area represents the low attenuation area [−990; −750 HU]; the yellow one represents the medium attenuation area [−750; 660 HU]; and the blue area shows the high attenuation area [−660; 0 HU].
Figure 6
Figure 6
CT Pulmo 3D: thresholds and volumes. This figure shows the HU thresholds and relative volumes per lobe.
Figure 7
Figure 7
CT Pulmo 3D: graphic of HU thresholds. This graphic represents the HU thresholds and their relative frequencies.
Figure 8
Figure 8
CT Pulmo 3D: lung contouring. This figure shows the lung parenchyma lesions counted; the different colors employed suggest different HU sub-ranges.
Figure 9
Figure 9
The descriptive statistics from the radiologists’ measurements. The agreement between radiologists for visual estimation of pneumonia from CT was good, as shown in this box, plot scheme (ICC 0.79, 95% CI 0.73–0.84). Only one radiologist esteemed a higher visual score (considered as the median). ICC = Intraclass Correlation Coefficient, CI = Confidence Interval.
Figure 10
Figure 10
Statistical description of the three software. This box plot scheme shows that 3DSlicer delivers a higher value in the median of the measures assessed.
Figure 11
Figure 11
Bland–Altman graphics demonstrate the trend of the values assessed. For the software “LungCTAnalyzer”, the results lie in a range between 36.7 and −8.6 with an SD of ±1.96. For the Canon software, the results filled the space between 34.8 and −12.5 with an SD of ±1.96; for the Siemens software, instead, the values were positioned between 36.8 and −13.6 with the same SD of ±1.96. Finally, the “Parenchyma Analysis” outcomes were placed between 26.3 and −20.6 with an SD of ±1.96. SD = Standard Deviation.

References

    1. Al World Health Organization COVID-19—China. 2020. [(accessed on 5 December 2021)]. Available online: https://www.who.int/emergencies/disease-outbreak-news/item/2020-DON233.
    1. Andersen K.G., Rambaut A., Lipkin W.I., Holmes E.C., Garry R.F. The proximal origin of SARS-CoV-2. Nat. Med. 2020;26:450–452. doi: 10.1038/s41591-020-0820-9. - DOI - PMC - PubMed
    1. Menezes M.C.S., Pestana D.V.S., Gameiro G.R., da Silva L.F.F., Baron Ė., Rouby J.-J., Auler J.O.C., Jr. SARS-CoV-2 pneumonia—Receptor binding and lung immunopathology: A narrative review. Crit. Care. 2021;25:53. doi: 10.1186/s13054-020-03399-z. - DOI - PMC - PubMed
    1. World Health Organization WHO Director-General’s Opening Remarks at the Media Briefing on COVID-19—11 March 2020. 2020. [(accessed on 5 December 2021)]. Available online: https://www.who.int/dg/speeches/detail/who-director-general-s-opening-re....
    1. Tran B.X., Ha G.H., Nguyen L.H., Vu G.T., Hoang M.T., Le H.T., Latkin C.A., Ho C.S.H., Ho R.C. Studies of Novel Coronavirus Disease 19 (COVID-19) Pandemic: A Global Analysis of Literature. Int. J. Environ. Res. Public Health. 2020;17:4095. doi: 10.3390/ijerph17114095. - DOI - PMC - PubMed

LinkOut - more resources