

A Novel Approach to Modeling and Forecasting Cancer Incidence and Mortality Rates through Web Queries and Automated Forecasting Algorithms: Evidence from Romania
- PMID: 35741378
- PMCID: PMC9220763
- DOI: 10.3390/biology11060857
A Novel Approach to Modeling and Forecasting Cancer Incidence and Mortality Rates through Web Queries and Automated Forecasting Algorithms: Evidence from Romania
Abstract
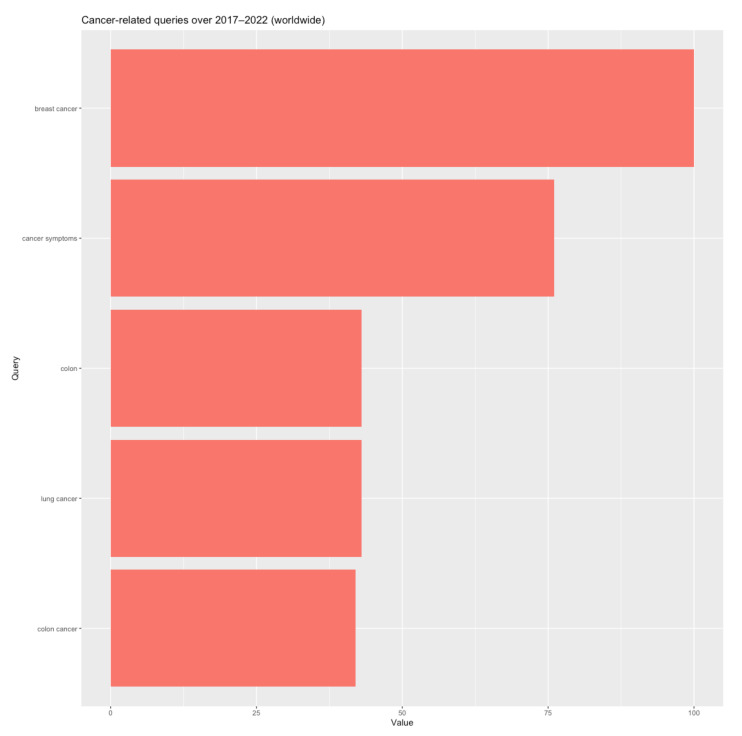
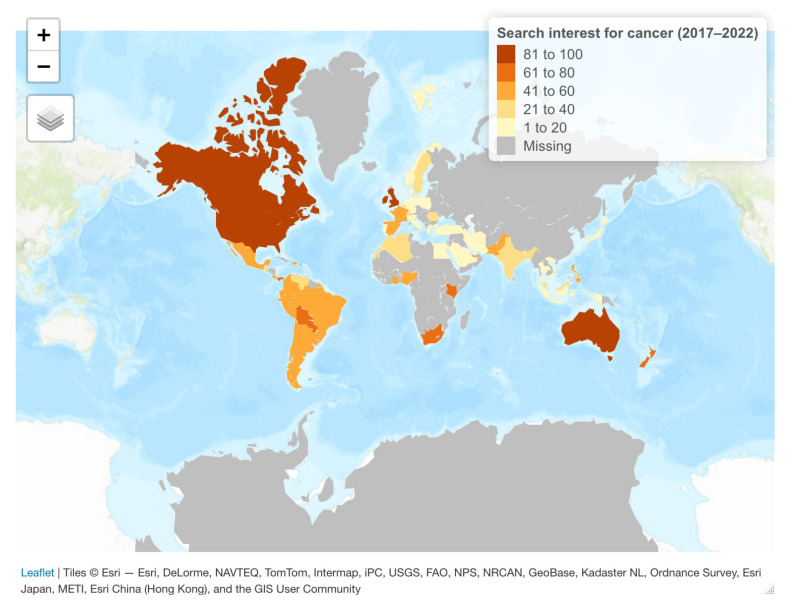
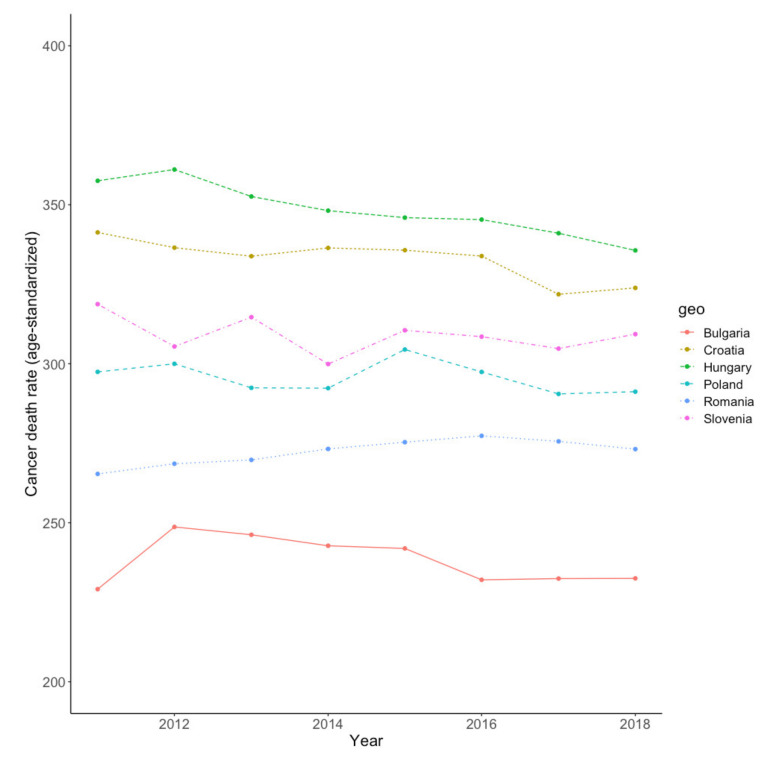
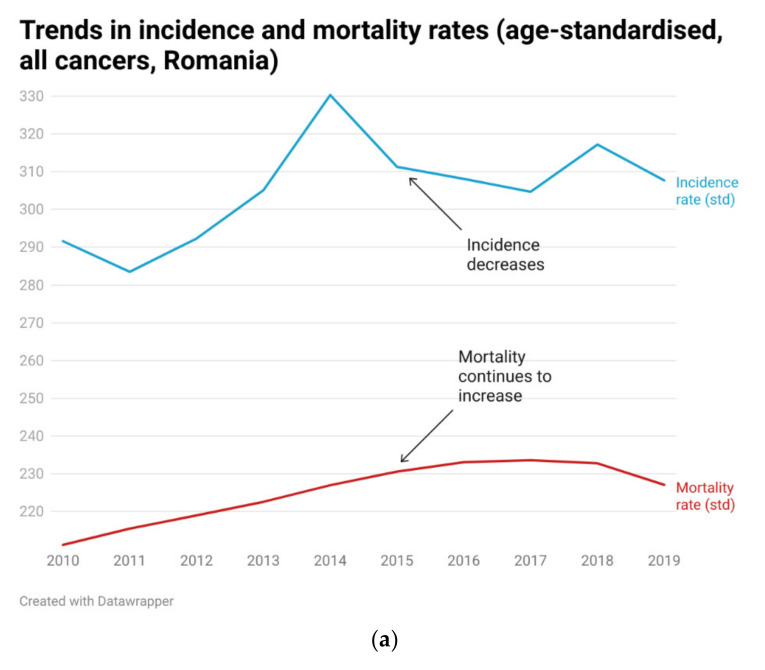
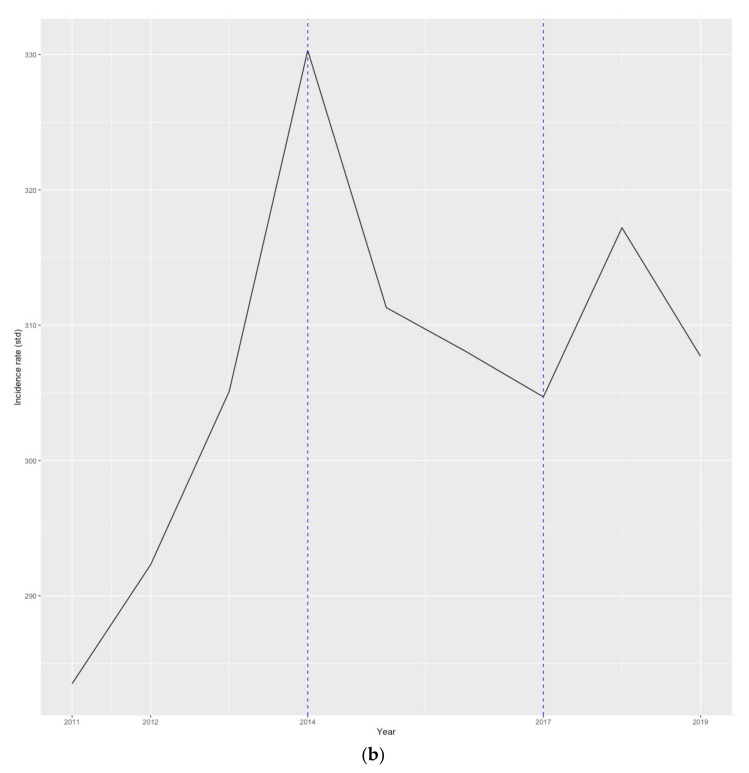
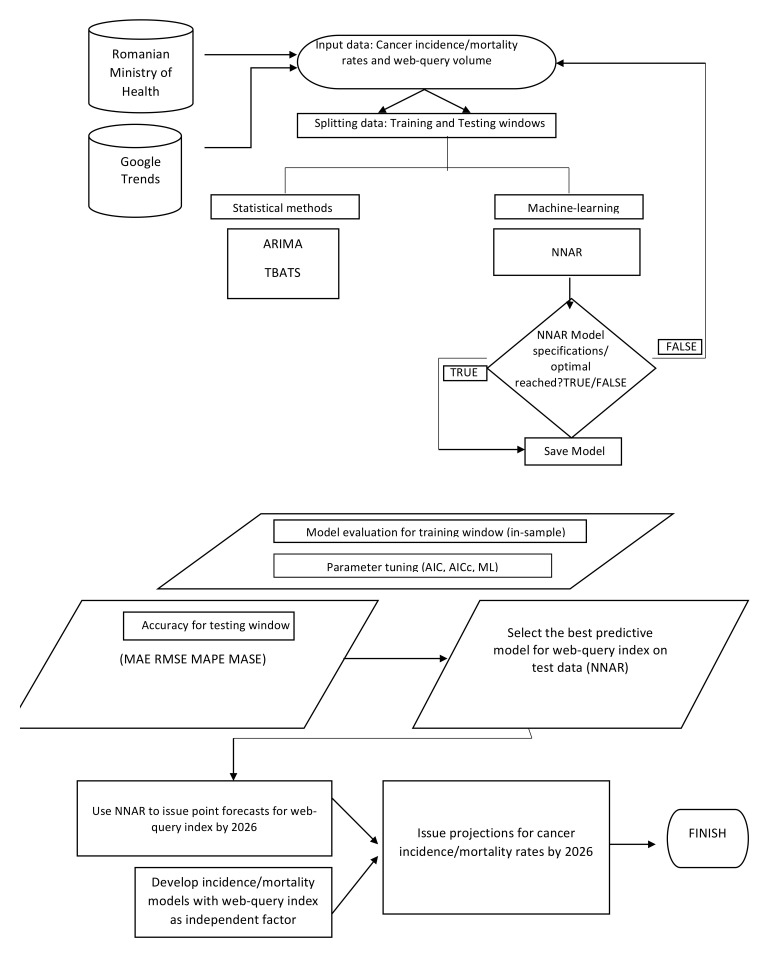
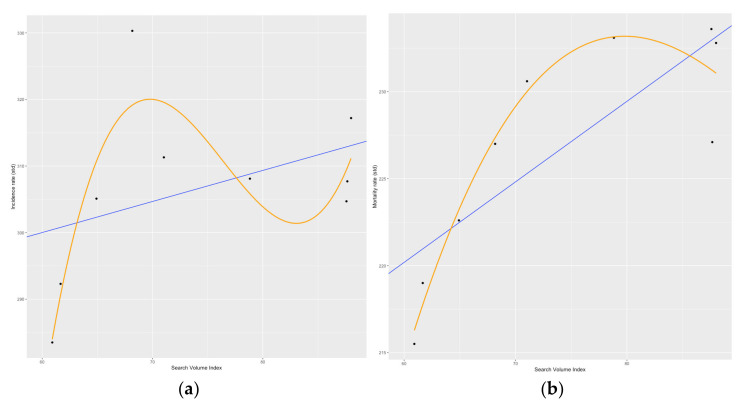
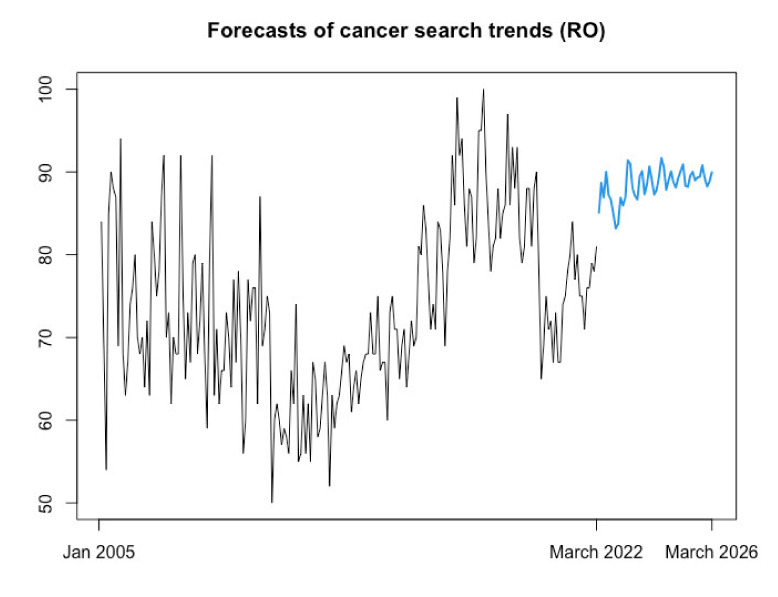
Cancer remains a leading cause of worldwide mortality and is a growing, multifaceted global burden. As a result, cancer prevention and cancer mortality reduction are counted among the most pressing public health issues of the twenty-first century. In turn, accurate projections of cancer incidence and mortality rates are paramount for robust policymaking, aimed at creating efficient and inclusive public health systems and also for establishing a baseline to assess the impact of newly introduced public health measures. Within the European Union (EU), Romania consistently reports higher mortality from all types of cancer than the EU average, caused by an inefficient and underfinanced public health system and lower economic development that in turn have created the phenomenon of "oncotourism". This paper aims to develop novel cancer incidence/cancer mortality models based on historical links between incidence and mortality occurrence as reflected in official statistics and population web-search habits. Subsequently, it employs estimates of the web query index to produce forecasts of cancer incidence and mortality rates in Romania. Various statistical and machine-learning models-the autoregressive integrated moving average model (ARIMA), the Exponential Smoothing State Space Model with Box-Cox Transformation, ARMA Errors, Trend, and Seasonal Components (TBATS), and a feed-forward neural network nonlinear autoregression model, or NNAR-are estimated through automated algorithms to assess in-sample fit and out-of-sample forecasting accuracy for web-query volume data. Forecasts are produced with the overperforming model in the out-of-sample context (i.e., NNAR) and fed into the novel incidence/mortality models. Results indicate a continuation of the increasing trends in cancer incidence and mortality in Romania by 2026, with projected levels for the age-standardized total cancer incidence of 313.8 and the age-standardized mortality rate of 233.8 representing an increase of 2%, and, respectively, 3% relative to the 2019 levels. Research findings thus indicate that, under the no-change hypothesis, cancer will remain a significant burden in Romania and highlight the need and urgency to improve the status quo in the Romanian public health system.
Keywords: ARIMA; Google Trends; NNAR; Romania; TBATS; cancer; forecasting; incidence; modeling; mortality.
Conflict of interest statement
The authors declare no conflict of interest.
Figures
Similar articles
-
Comparison of ARIMA, ETS, NNAR, TBATS and hybrid models to forecast the second wave of COVID-19 hospitalizations in Italy.Eur J Health Econ. 2022 Aug;23(6):917-940. doi: 10.1007/s10198-021-01347-4. Epub 2021 Aug 4. Eur J Health Econ. 2022. PMID: 34347175 Free PMC article.
-
Improving the precision of modeling the incidence of hemorrhagic fever with renal syndrome in mainland China with an ensemble machine learning approach.PLoS One. 2021 Mar 16;16(3):e0248597. doi: 10.1371/journal.pone.0248597. eCollection 2021. PLoS One. 2021. PMID: 33725011 Free PMC article.
-
Time series prediction of under-five mortality rates for Nigeria: comparative analysis of artificial neural networks, Holt-Winters exponential smoothing and autoregressive integrated moving average models.BMC Med Res Methodol. 2020 Dec 3;20(1):292. doi: 10.1186/s12874-020-01159-9. BMC Med Res Methodol. 2020. PMID: 33267817 Free PMC article.
-
Mining Google Trends data for nowcasting and forecasting colorectal cancer (CRC) prevalence.PeerJ Comput Sci. 2023 Oct 4;9:e1518. doi: 10.7717/peerj-cs.1518. eCollection 2023. PeerJ Comput Sci. 2023. PMID: 37869464 Free PMC article.
-
Forecasting tuberculosis incidence: a review of time series and machine learning models for prediction and eradication strategies.Int J Environ Health Res. 2024 Jun 25:1-16. doi: 10.1080/09603123.2024.2368137. Online ahead of print. Int J Environ Health Res. 2024. PMID: 38916208 Review.
Cited by
-
Comparing the current short-term cancer incidence prediction models in Brazil with state-of-the-art time-series models.Sci Rep. 2024 Feb 25;14(1):4566. doi: 10.1038/s41598-024-55230-2. Sci Rep. 2024. PMID: 38403643 Free PMC article. Review.
-
Comparing the trends of cancer burden attributed to high BMI in China and globally from 1990 to 2021, with multi-model prediction to 2036.Front Public Health. 2025 Jul 11;13:1590559. doi: 10.3389/fpubh.2025.1590559. eCollection 2025. Front Public Health. 2025. PMID: 40717954 Free PMC article.
-
New Regional Dynamic Cancer Model across the European Union.Cancers (Basel). 2023 Apr 28;15(9):2545. doi: 10.3390/cancers15092545. Cancers (Basel). 2023. PMID: 37174011 Free PMC article.
-
Estimated projection of oral squamous cell carcinoma annual incidence from twenty years registry data: a retrospective cross-sectional study in Indonesia.PeerJ. 2023 Aug 29;11:e15911. doi: 10.7717/peerj.15911. eCollection 2023. PeerJ. 2023. PMID: 37663292 Free PMC article.
-
Biogenic Synthesis of Cu-Mn Bimetallic Nanoparticles Using Pumpkin Seeds Extract and Their Characterization and Anticancer Efficacy.Nanomaterials (Basel). 2023 Mar 28;13(7):1201. doi: 10.3390/nano13071201. Nanomaterials (Basel). 2023. PMID: 37049295 Free PMC article.
References
-
- World Health Organization (WHO) Cancer. 2022. [(accessed on 4 April 2022)]. Available online: https://www.who.int/news-room/fact-sheets/detail/cancer.
-
- World Cancer Research Fund Worldwide Cancer Data. 2022. [(accessed on 30 March 2022)]. Available online: https://www.wcrf.org/dietandcancer/worldwide-cancer-data/
-
- World Health Organization (WHO) Cancer. 2019. [(accessed on 4 April 2022)]. Available online: https://www.who.int/health-topics/cancer#tab=tab_1.
LinkOut - more resources
Full Text Sources
Research Materials
