

Comparative Study of Brain Size Ontogeny: Marsupials and Placental Mammals
- PMID: 35741421
- PMCID: PMC9219685
- DOI: 10.3390/biology11060900
Comparative Study of Brain Size Ontogeny: Marsupials and Placental Mammals
Abstract
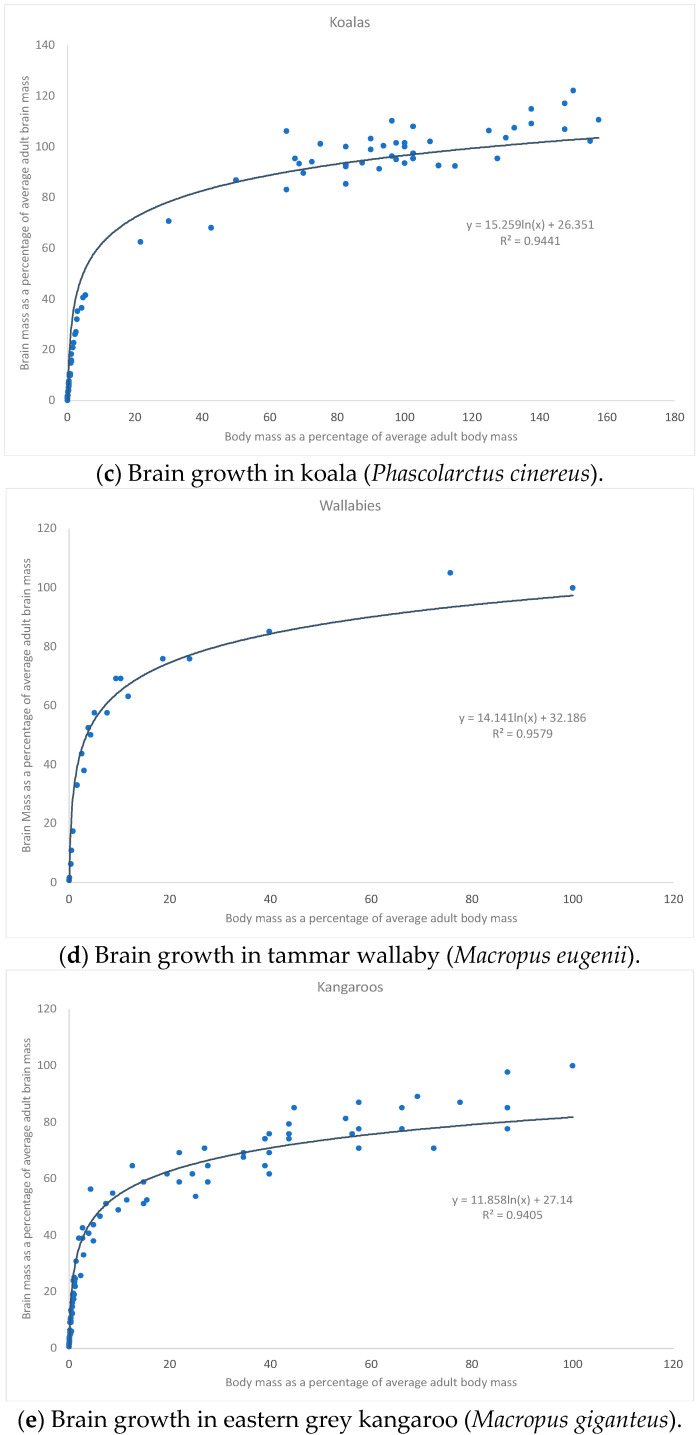
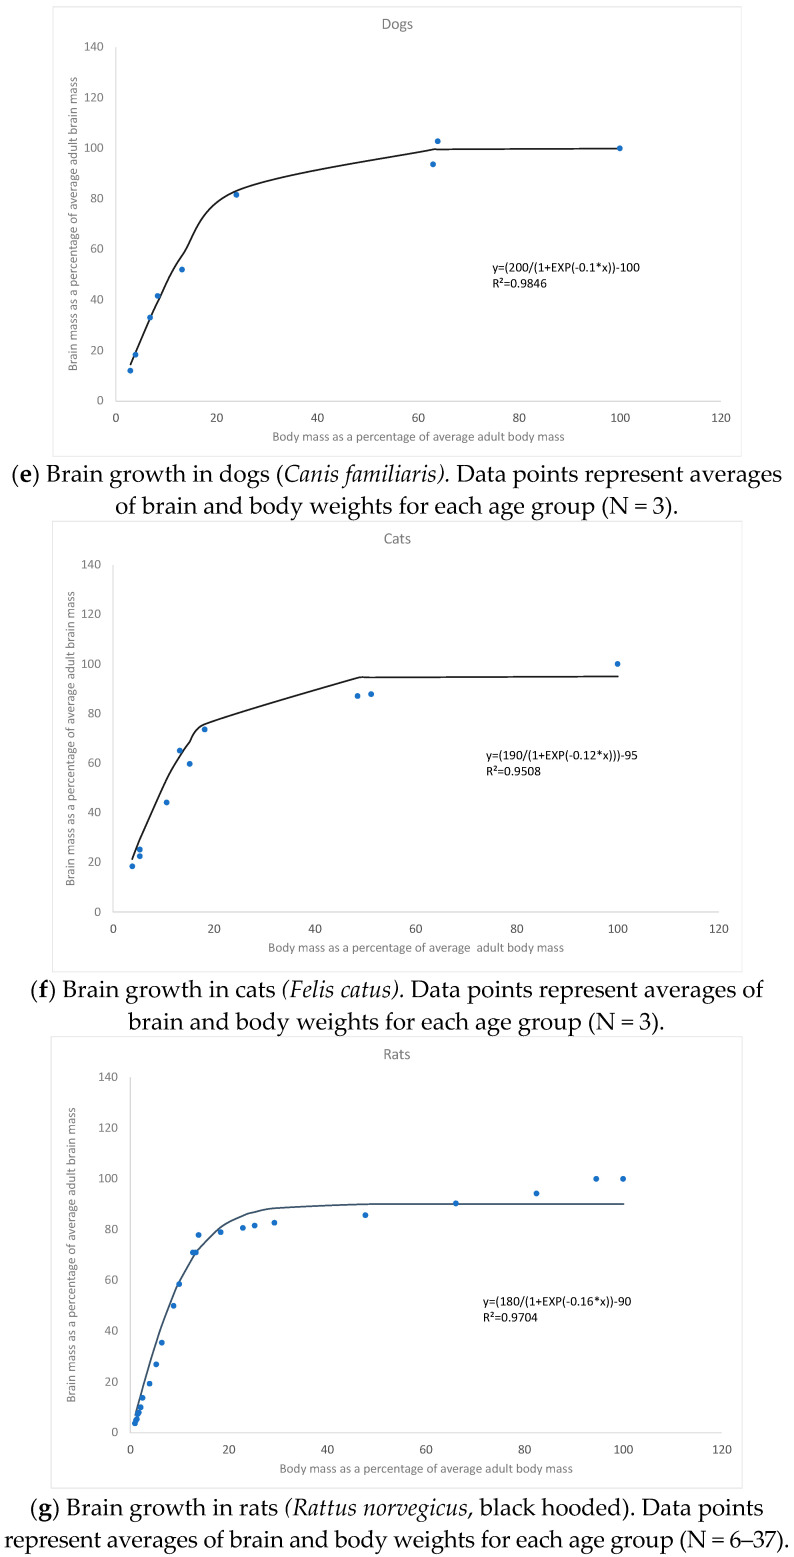
There exists a negative allometry between vertebrate brain size and body size. It has been well studied among placental mammals but less is known regarding marsupials. Consequently, this study explores brain/body ontogenetic growth in marsupials and compares it with placental mammals. Pouch young samples of 43 koalas (Phascolarctos cinereus), 28 possums (Trichosurus vulpecula), and 36 tammar wallabies (Macropus eugenii) preserved in a solution of 10% buffered formalin, as well as fresh juveniles and adults of 43 koalas and 40 possums, were studied. Their brain size/body size allometry was compared to that among humans, rhesus monkeys, dogs, cats, rats, guinea pigs, rabbits, wild pigs, and mice. Two patterns of allometric curves were found: a logarithmic one (marsupials, rabbits, wild pigs, and guinea pigs) and a logistic one (the rest of mammals).
Keywords: brain variability; brain/body allometry; logarithmic/logistic curves; neuronal units; ontogenesis.
Conflict of interest statement
Authors declare no conflict of interests.
Figures


Similar articles
-
In vitro hepatic microsomal metabolism of meloxicam in koalas (Phascolarctos cinereus), brushtail possums (Trichosurus vulpecula), ringtail possums (Pseudocheirus peregrinus), rats (Rattus norvegicus) and dogs (Canis lupus familiaris).Comp Biochem Physiol C Toxicol Pharmacol. 2014 Apr;161:7-14. doi: 10.1016/j.cbpc.2013.12.002. Epub 2013 Dec 15. Comp Biochem Physiol C Toxicol Pharmacol. 2014. PMID: 24345479
-
A quantitative study of the morphological development and bacterial colonisation of the gut of the tammar wallaby Macropus eugenii eugenii and brushtail possum Trichosurus vulpecula during in-pouch development.J Comp Physiol B. 2006 Nov;176(8):763-74. doi: 10.1007/s00360-006-0097-4. Epub 2006 Jul 4. J Comp Physiol B. 2006. PMID: 16819652
-
Uterine molecular changes for non-invasive embryonic attachment in the marsupials Macropus eugenii (Macropodidae) and Trichosurus vulpecula (Phalangeridae).Mol Reprod Dev. 2017 Oct;84(10):1076-1085. doi: 10.1002/mrd.22861. Epub 2017 Aug 7. Mol Reprod Dev. 2017. PMID: 28688214
-
Therapeutics of companion exotic marsupials.Vet Clin North Am Exot Anim Pract. 2000 Jan;3(1):173-81, vii. doi: 10.1016/s1094-9194(17)30100-7. Vet Clin North Am Exot Anim Pract. 2000. PMID: 11228826 Review.
-
Embryonic diapause in marsupials.J Reprod Fertil Suppl. 1981;29:67-78. J Reprod Fertil Suppl. 1981. PMID: 7014870 Review.
Cited by
-
Similarity-Based Predictive Models: Sensitivity Analysis and a Biological Application with Multi-Attributes.Biology (Basel). 2023 Jul 4;12(7):959. doi: 10.3390/biology12070959. Biology (Basel). 2023. PMID: 37508389 Free PMC article.
References
-
- Count E.W. Brain and body weight in man: Their antecedents in growth and evolution. Ann. N. Y. Acad. Sci. 1947;46:993–1122. doi: 10.1111/j.1749-6632.1947.tb36165.x. - DOI
-
- Sacher G.A., Staffeldt E.F. Elation of gestation time to brain weight for placental mammals: Implications for the theory of vertebrate growth. Am. Nat. 1974;108:593–615. doi: 10.1086/282938. - DOI
-
- Holt A.B., Cheek D.B., Mellits E.D., Hill D.E. Brain size and the relation of the primate to the non-primate. In: Cheek D., editor. Fetal and Postnatal Cellular Growth: Hormones and Nutrition. John Wiley & Sons; New York, NY, USA: 1975. pp. 23–44. - DOI
LinkOut - more resources
Full Text Sources
Miscellaneous
