

Effect of Diet Consistency on Rat Mandibular Growth: A Geometric Morphometric and Linear Cephalometric Study
- PMID: 35741424
- PMCID: PMC9220214
- DOI: 10.3390/biology11060901
Effect of Diet Consistency on Rat Mandibular Growth: A Geometric Morphometric and Linear Cephalometric Study
Abstract
Background: Our study intended to investigate the null hypothesis that there is no effect of diet consistency on rat mandibular growth.
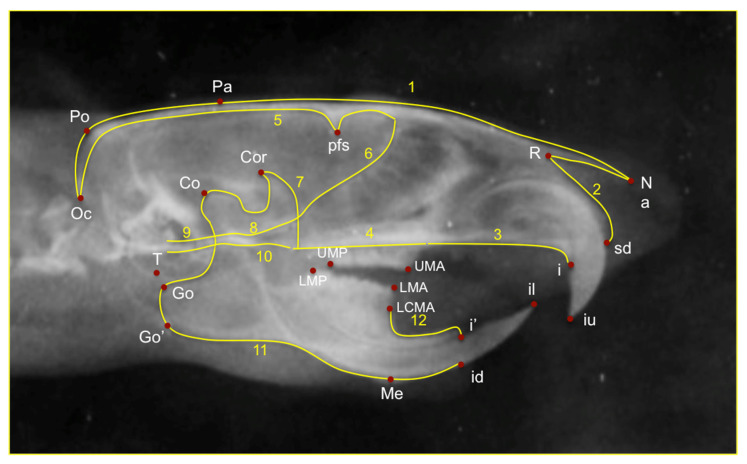
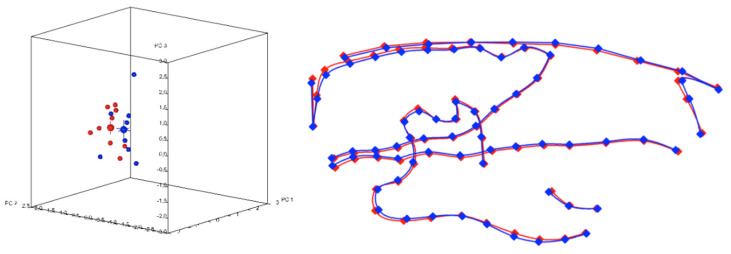
Methods: A total sample of 24 female wistar rats, 30 days old, was used in this study. In the first group, the rats were fed soft diet and in the second group, they were fed hard diet for 60 days. On the 60th day, the rats were sedated and lateral cephalometric X-rays were taken. Lateral cephalometric X-rays were digitized with 7 craniofacial landmarks for the linear measurements, as well as with 12 curves and 90 landmarks, of which 74 were semilandmarks and 16 were fixed landmarks for morphometric analysis. These landmarks were exposed to Procrustes superimposition and Principal Component Analysis (PCA) to describe the shape variability of the mandible.
Results: Means measurements of the soft diet group compared to those of the hard diet group were significantly different in linear and morphometric analysis measurements. The soft diet group of wistar rats revealed significant changes on the condyle (smaller), the angle of the mandible, and on the body of the mandible.
Conclusions: Diet consistency affects the craniofacial growth of rats. Soft diet could be responsible for less mandibular growth.
Keywords: growth; hard diet; mandible; soft diet.
Conflict of interest statement
The authors declare no conflict of interest.
Figures

Similar articles
-
Effects of Diet Consistency on Rat Maxillary and Mandibular Growth within Three Generations-A Longitudinal CBCT Study.Biology (Basel). 2023 Sep 20;12(9):1260. doi: 10.3390/biology12091260. Biology (Basel). 2023. PMID: 37759659 Free PMC article.
-
Long-Term Effect of Diet Consistency on Mandibular Growth within Three Generations: A Longitudinal Cephalometric Study in Rats.Biology (Basel). 2023 Apr 7;12(4):568. doi: 10.3390/biology12040568. Biology (Basel). 2023. PMID: 37106767 Free PMC article.
-
Craniofacial shape in patients with beta thalassaemia: a geometric morphometric analysis.Sci Rep. 2021 Jan 18;11(1):1686. doi: 10.1038/s41598-020-80234-z. Sci Rep. 2021. PMID: 33462286 Free PMC article.
-
Geometric morphometrics of different malocclusions in lateral skull radiographs.J Orofac Orthop. 2017 Jan;78(1):11-20. doi: 10.1007/s00056-016-0057-x. Epub 2016 Oct 31. J Orofac Orthop. 2017. PMID: 27796401 Free PMC article.
-
Cephalometric evaluation of condylar and mandibular growth modification: a review.Orthod Craniofac Res. 2006 Feb;9(1):2-9. doi: 10.1111/j.1601-6343.2006.00323.x. Orthod Craniofac Res. 2006. PMID: 16420269 Review.
Cited by
-
Morphometric Analysis of the Mandibular Canal and Its Anatomical Variants in a Chilean Subpopulation: Cone Beam Computed Tomography Study.Diagnostics (Basel). 2024 Aug 30;14(17):1914. doi: 10.3390/diagnostics14171914. Diagnostics (Basel). 2024. PMID: 39272699 Free PMC article.
-
Anterior Mandibular Displacement in Growing Rats-A Systematic Review.Animals (Basel). 2022 Aug 12;12(16):2059. doi: 10.3390/ani12162059. Animals (Basel). 2022. PMID: 36009649 Free PMC article. Review.
-
Effects of Diet Consistency on Rat Maxillary and Mandibular Growth within Three Generations-A Longitudinal CBCT Study.Biology (Basel). 2023 Sep 20;12(9):1260. doi: 10.3390/biology12091260. Biology (Basel). 2023. PMID: 37759659 Free PMC article.
-
Histological and Biochemical Analysis after Posterior Mandibular Displacement in Rats.Vet Sci. 2022 Nov 10;9(11):625. doi: 10.3390/vetsci9110625. Vet Sci. 2022. PMID: 36356102 Free PMC article.
-
Effects on Facial Growth Following Masseter Muscle Resection in Growing Rats-A Systematic Review.Animals (Basel). 2023 May 18;13(10):1680. doi: 10.3390/ani13101680. Animals (Basel). 2023. PMID: 37238110 Free PMC article. Review.
References
-
- Proffit W.R., Fields H.W., Sarver D.M. Contemporary Orthodontics. Elsiever; St. Louis, MO, USA: 2012. Contemporary orthodontic appliances; pp. 348–350.
LinkOut - more resources
Full Text Sources
