

Colored Texture Analysis Fuzzy Entropy Methods with a Dermoscopic Application
- PMID: 35741551
- PMCID: PMC9223301
- DOI: 10.3390/e24060831
Colored Texture Analysis Fuzzy Entropy Methods with a Dermoscopic Application
Abstract
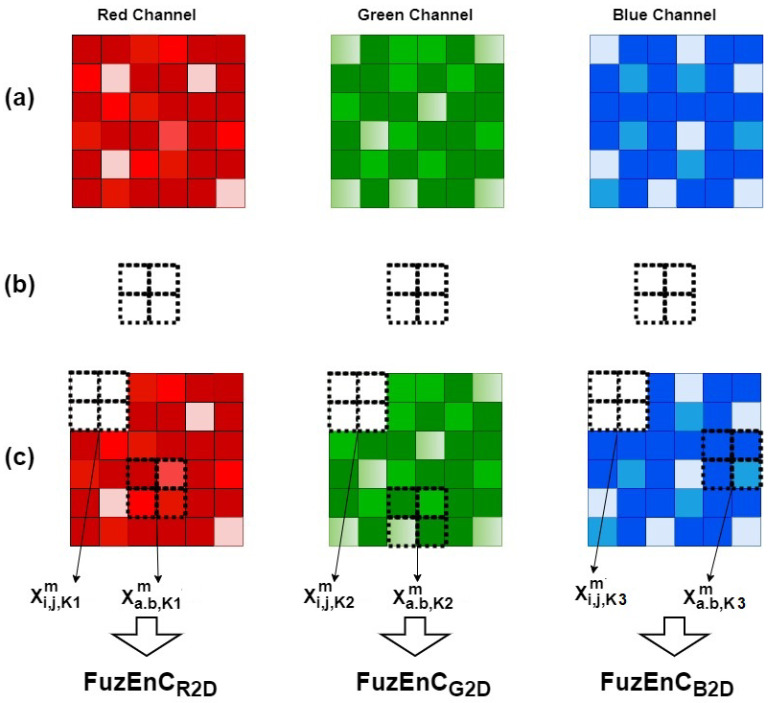
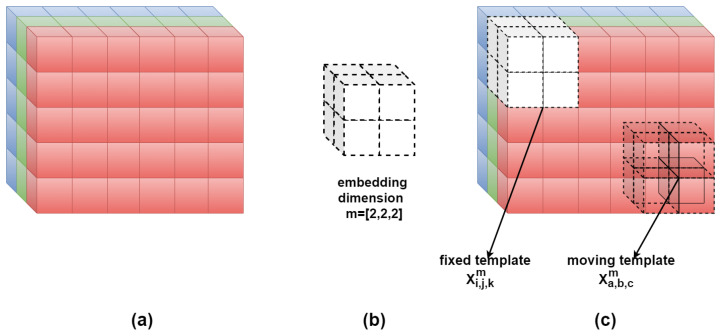
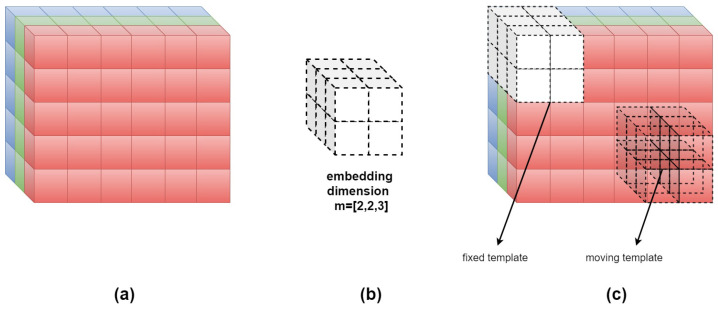
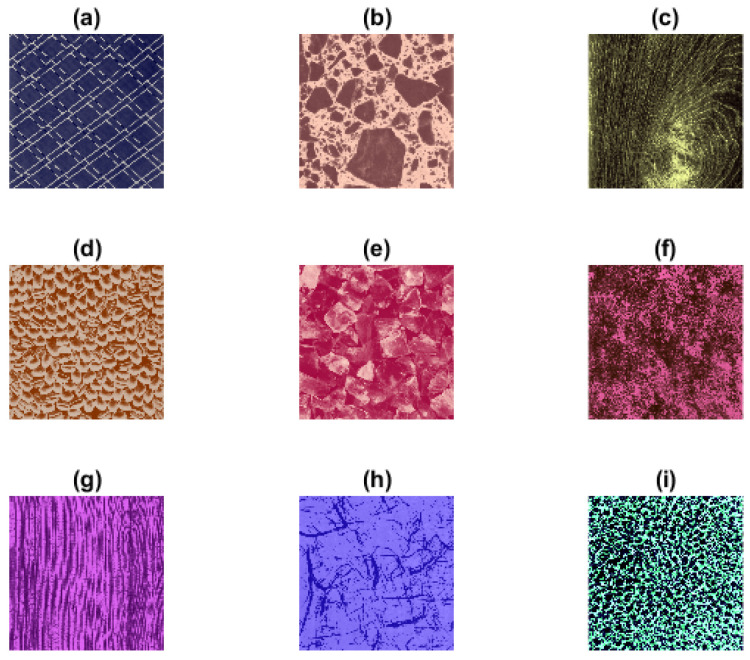
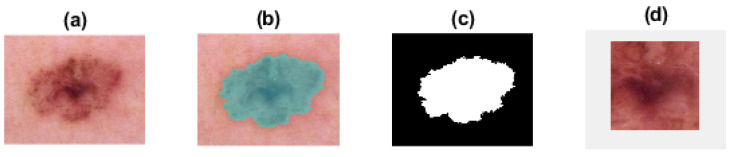
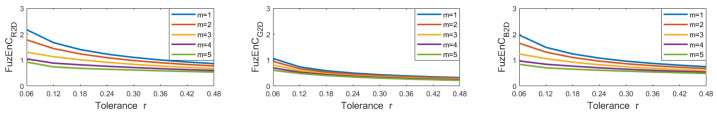
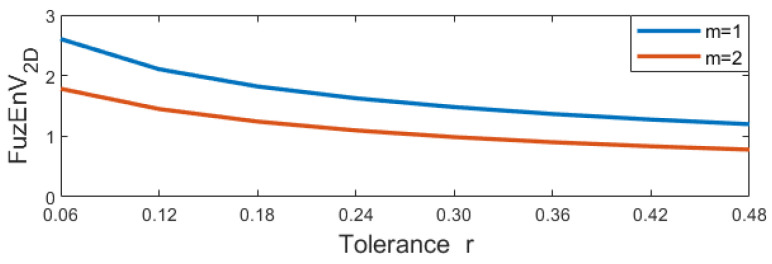
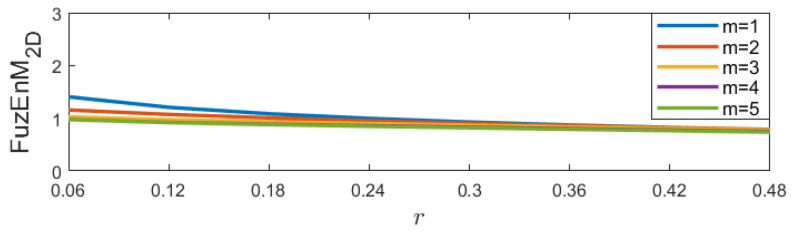
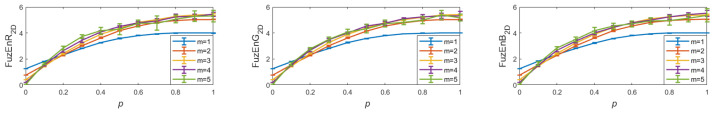
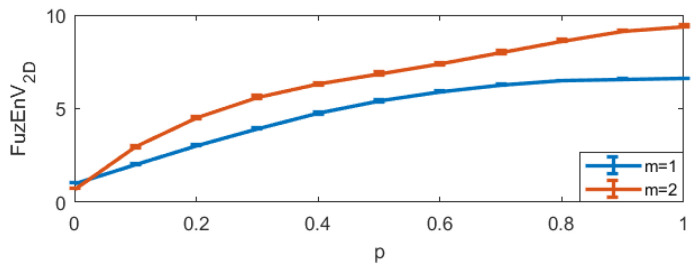
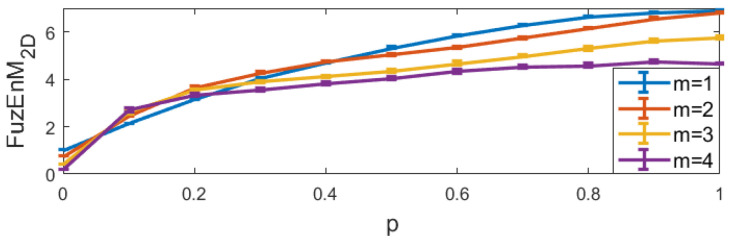
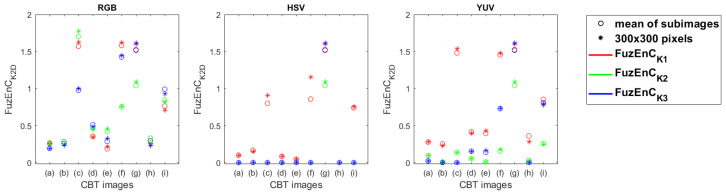
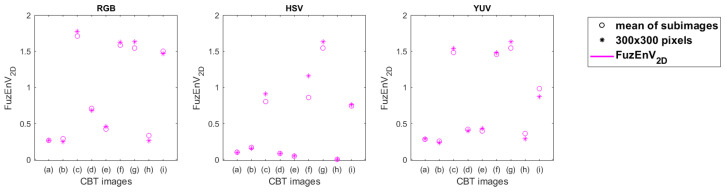
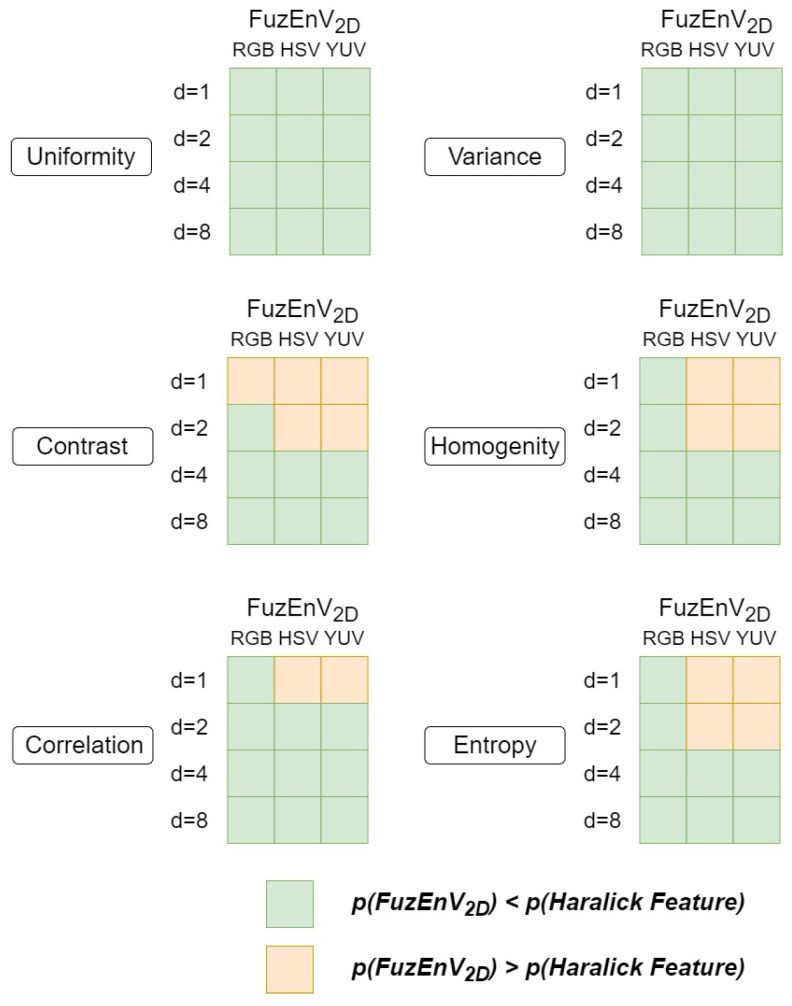
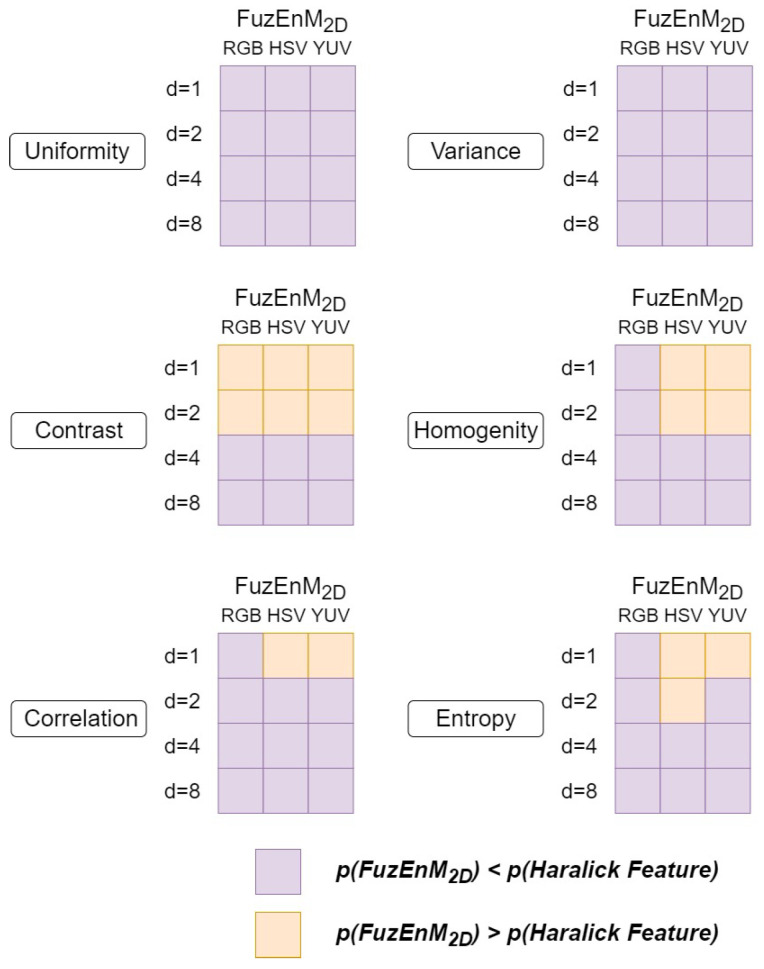
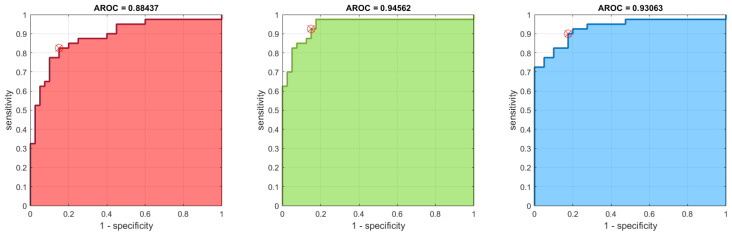
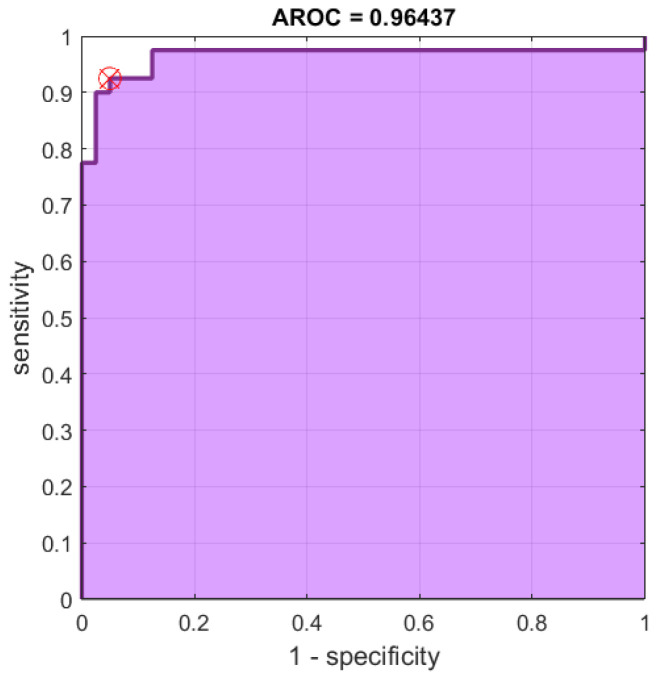
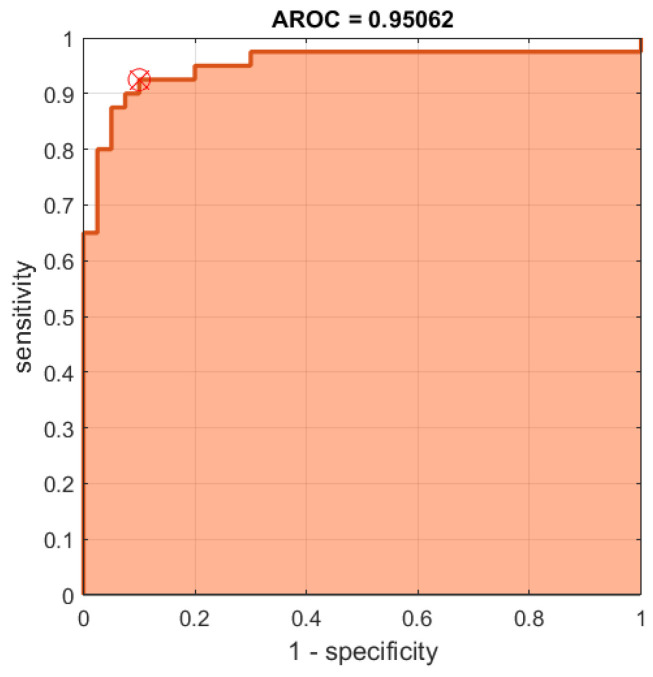
Texture analysis is a subject of intensive focus in research due to its significant role in the field of image processing. However, few studies focus on colored texture analysis and even fewer use information theory concepts. Entropy measures have been proven competent for gray scale images. However, to the best of our knowledge, there are no well-established entropy methods that deal with colored images yet. Therefore, we propose the recent colored bidimensional fuzzy entropy measure, FuzEnC2D, and introduce its new multi-channel approaches, FuzEnV2D and FuzEnM2D, for the analysis of colored images. We investigate their sensitivity to parameters and ability to identify images with different irregularity degrees, and therefore different textures. Moreover, we study their behavior with colored Brodatz images in different color spaces. After verifying the results with test images, we employ the three methods for analyzing dermoscopic images of malignant melanoma and benign melanocytic nevi. FuzEnC2D, FuzEnV2D, and FuzEnM2D illustrate a good differentiation ability between the two-similar in appearance-pigmented skin lesions. The results outperform those of a well-known texture analysis measure. Our work provides the first entropy measure studying colored images using both single and multi-channel approaches.
Keywords: colored texture analysis; dermoscopy; entropy; fuzzy entropy; information theory; medical image analysis; melanoma; texture analysis.
Conflict of interest statement
The authors declare no conflict of interest.
Figures
Similar articles
-
Bidimensional Fuzzy Entropy: Principle Analysis and Biomedical Applications.Annu Int Conf IEEE Eng Med Biol Soc. 2019 Jul;2019:4811-4814. doi: 10.1109/EMBC.2019.8857176. Annu Int Conf IEEE Eng Med Biol Soc. 2019. PMID: 31946938
-
Bidimensional Multiscale Fuzzy Entropy and Its Application to Pseudoxanthoma Elasticum.IEEE Trans Biomed Eng. 2020 Jul;67(7):2015-2022. doi: 10.1109/TBME.2019.2953681. Epub 2019 Nov 15. IEEE Trans Biomed Eng. 2020. PMID: 31751213
-
Bidimensional Increment Entropy for Texture Analysis: Theoretical Validation and Application to Colon Cancer Images.Entropy (Basel). 2025 Jan 17;27(1):80. doi: 10.3390/e27010080. Entropy (Basel). 2025. PMID: 39851700 Free PMC article.
-
Digital image analysis for diagnosis of cutaneous melanoma. Development of a highly effective computer algorithm based on analysis of 837 melanocytic lesions.Br J Dermatol. 2004 Nov;151(5):1029-38. doi: 10.1111/j.1365-2133.2004.06210.x. Br J Dermatol. 2004. PMID: 15541081 Review.
-
Computational texture features of dermoscopic images and their link to the descriptive terminology: A survey.Comput Methods Programs Biomed. 2019 Dec;182:105049. doi: 10.1016/j.cmpb.2019.105049. Epub 2019 Aug 26. Comput Methods Programs Biomed. 2019. PMID: 31494412 Review.
Cited by
-
Symmetric cross-entropy multi-threshold color image segmentation based on improved pelican optimization algorithm.PLoS One. 2023 Jun 29;18(6):e0287573. doi: 10.1371/journal.pone.0287573. eCollection 2023. PLoS One. 2023. PMID: 37384625 Free PMC article.
-
Deep Learning and Entropy-Based Texture Features for Color Image Classification.Entropy (Basel). 2022 Oct 31;24(11):1577. doi: 10.3390/e24111577. Entropy (Basel). 2022. PMID: 36359667 Free PMC article.
References
-
- Humeau-Heurtier A. Texture feature extraction methods: A survey. IEEE Access. 2019;7:8975–9000. doi: 10.1109/ACCESS.2018.2890743. - DOI
-
- Song T., Feng J., Wang S., Xie Y. Spatially weighted order binary pattern for color texture classification. Expert Syst. Appl. 2020;147:113167. doi: 10.1016/j.eswa.2019.113167. - DOI
-
- Liu L., Chen J., Fieguth P., Zhao G., Chellappa R., Pietikäinen M. From BoW to CNN: Two decades of texture representation for texture classification. Int. J. Comput. Vis. 2019;127:74–109. doi: 10.1007/s11263-018-1125-z. - DOI
-
- Liu L., Fieguth P., Guo Y., Wang X., Pietikäinen M. Local binary features for texture classification: Taxonomy and experimental study. Pattern Recognit. 2017;62:135–160. doi: 10.1016/j.patcog.2016.08.032. - DOI
-
- Nguyen T.P., Vu N.S., Manzanera A. Statistical binary patterns for rotational invariant texture classification. Neurocomputing. 2016;173:1565–1577. doi: 10.1016/j.neucom.2015.09.029. - DOI
LinkOut - more resources
Full Text Sources
