. 2022 May 31;12(6):719.
doi: 10.3390/brainsci12060719.

Broadband Amplification as Tinnitus Treatment

Affiliations

Broadband Amplification as Tinnitus Treatment

Mie Laerkegaard Joergensen et al. Brain Sci. .

Abstract

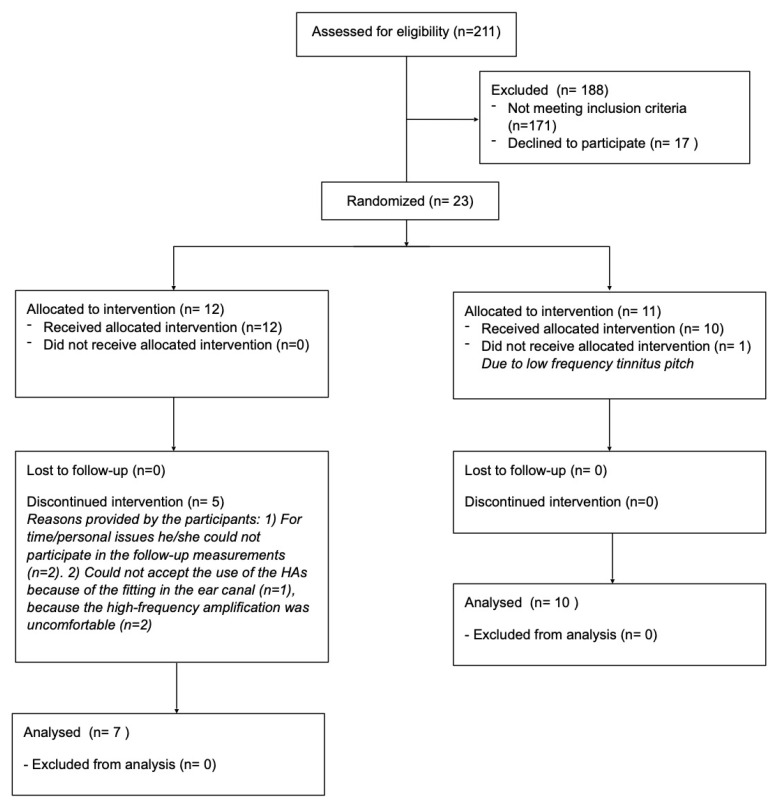
This study investigated the effect of broadband amplification (125 Hz to 10 kHz) as tinnitus treatment for participants with high-frequency hearing loss and compared these effects with an active placebo condition using band-limited amplification (125 Hz to 3-4 kHz). A double-blinded crossover study. Twenty-three participants with high-frequency (≥3 kHz) hearing loss and chronic tinnitus were included in the study, and 17 completed the full treatment protocol. Two different hearing aid treatments were provided for 3 months each: Broadband amplification provided gain in the frequency range from 125 Hz to 10 kHz and band-limited amplification only provided gain in the low-frequency range (≤3-4 kHz). The effect of the two treatments on tinnitus distress was evaluated with the Tinnitus Handicap Inventory (THI) and the Tinnitus Functional Index (TFI) questionnaires. The effect of the treatment on tinnitus loudness was evaluated with a visual analog scale (VAS) for loudness and a psychoacoustic loudness measure. Furthermore, the tinnitus annoyance was evaluated with a VAS for annoyance. The tinnitus pitch was evaluated based on the tinnitus likeness spectrum. A statistically significant difference was found between the two treatment groups (broadband vs. band-limited amplification) for the treatment-related change in THI and TFI with respect to the baseline. Furthermore, a statistically significant difference was found between the two treatment conditions for the annoyance measure. Regarding the loudness measure, no statistically significant differences were found between the treatments, although there was a trend towards a lower VAS-based loudness measure resulting from the broadband amplification. No changes were observed in the tinnitus pitch between the different conditions. Overall, the results from the present study suggest that tinnitus patients with high-frequency hearing loss can experience a decrease in tinnitus-related distress and annoyance from high-frequency amplification.

Keywords: amplification; hearing aids; high-frequency hearing loss; tinnitus.


Conflict of interest statement

The authors declare no conflict of interest. The funders had no role in the design of the study; in the collection, analyses, or interpretation of data; in the writing of the manuscript, or in the decision to publish the results.

Figures

Figure 1
Figure 1
Overview of the participant selection.
Figure 2
Figure 2
Hearing thresholds were measured from 125 Hz to 14 kHz. Results were averaged over each ear and shown with mean ± SEM. The red line is the average threshold for the right ear, while the blue line is the average threshold for the left ear.
Figure 3
Figure 3
Gain provided by the hearing aids in the two different treatment conditions. The dark blue curve is the gain provided in the left ear in the broadband condition, while the dark red curve is the gain provided in the right ear in the broadband condition. The light blue and red curves are the gain provided in the band-limited condition in the left and right ear, respectively. The gain was measured at 55, 65 and 75 dB SPL with the ISTS.
Figure 4
Figure 4
Tinnitus distress. (A) Average change in THI scores after broadband and band-limited amplification from baseline. The data from groups 1 and 2 were pooled for both the broadband and band-limited conditions. Averages are presented as mean ± SEM. * p < 0.05. (B) Average THI scores at each visit subdivided into treatment groups. (C) Average change in TFI scores after broadband and band-limited amplification from baseline. The data from group 1 and 2 were pooled for both the broadband and band-limited conditions. Averages are presented as mean ± SEM. * p < 0.05. (D) Average TFI scores at each visit subdivided into treatment groups.
Figure 5
Figure 5
Tinnitus loudness. (A) Average change in tinnitus loudness matching after broadband and band-limited amplification from baseline. The data from groups 1 and 2 were pooled for both the broadband and band-limited conditions. Averages are presented as mean ± SEM. (B) Average tinnitus loudness matching at each visit subdivided into treatment groups. (C) Average change in VAS loudness score after broadband and band-limited amplification from baseline. The data from groups 1 and 2 were pooled for both the broadband and band-limited conditions. (D) Average VAS loudness score at each visit subdivided into treatment groups.
Figure 6
Figure 6
Tinnitus annoyance. (A) Average change in VAS annoyance score after broadband and band-limited amplification compared to the baseline. The data from groups 1 and 2 were pooled for both the broadband and band-limited conditions. Averages are presented as mean ± SEM. (B) Average VAS annoyance score at each visit subdivided into treatment groups.
Figure 7
Figure 7
Averaged tinnitus spectrum measured at baseline, after broadband amplification and after band-limited amplification with both pure-tones and narrowband noise.
Figure 8
Figure 8
Difference between REIG and the target gains provided by the hearing aid fitting software. The average of the left and right ears is shown. Individual participant data (colored lines) and the average (black line) across participants are shown. The dotted lines represent the +/− 5 dB tolerance recommended at frequencies between 250 Hz and 6 kHz when comparing the REIG to the target value (BSA 2018).
Figure 9
Figure 9
(A) Overview of the number of hours/day the hearing aids have been switched on. (B) Pearson’s correlation between the THI difference before/after the use of broadband amplification and the amount of hours/day the HAs were active. (C) Correlation between the THI difference before/after the use of band-limited amplification and the amount of hours/day the HAs were active.

Similar articles

Cited by

References

    1. Baguley D., McFerran D., Hall D. Tinnitus. Lancet. 2013;382:1600–1607. doi: 10.1016/S0140-6736(13)60142-7. - DOI - PubMed
    1. McCormack A., Edmondson-Jones M., Somerset S., Hall D. A systematic review of the reporting of tinnitus prevalence and severity. Hear. Res. 2016;337:70–79. doi: 10.1016/j.heares.2016.05.009. - DOI - PubMed
    1. De Ridder D., Elgoyhen A.B., Romo R., Langguth B. Phantom percepts: Tinnitus and pain as persisting aversive memory networks. Proc. Natl. Acad. Sci. USA. 2011;108:8075–8080. doi: 10.1073/pnas.1018466108. - DOI - PMC - PubMed
    1. Langguth B., Kreuzer P.M., Kleinjung T., De Ridder D. Tinnitus: Causes and clinical management. Lancet Neurol. 2013;12:920–930. doi: 10.1016/S1474-4422(13)70160-1. - DOI - PubMed
    1. Cederroth C.R., Gallus S., Hall D.A., Kleinjung T., Langguth B., Maruotti A., Meyer M., Norena A., Probst T., Schlee W., et al. Towards an understanding of tinntus heterogeneity. Front. Aging Neurosci. 2019;11:53. doi: 10.3389/fnagi.2019.00053. - DOI - PMC - PubMed

LinkOut - more resources