

Construction and Validation of a Tumor Microenvironment-Based Scoring System to Evaluate Prognosis and Response to Immune Checkpoint Inhibitor Therapy in Lung Adenocarcinoma Patients
- PMID: 35741714
- PMCID: PMC9222903
- DOI: 10.3390/genes13060951
Construction and Validation of a Tumor Microenvironment-Based Scoring System to Evaluate Prognosis and Response to Immune Checkpoint Inhibitor Therapy in Lung Adenocarcinoma Patients
Abstract
Background: Lung cancer is among the most dangerous malignant tumors to human health. Lung adenocarcinoma (LUAD) accounts for about 40% of all lung cancers. Accumulating evidence suggests that the tumor microenvironment (TME) is a crucial regulator of carcinogenesis and therapeutic efficacy in LUAD. However, the impact of tumor microenvironment-related signatures (TMERSs) representing the TME characteristics on the prognosis and therapeutic outcome of LUAD patients remains to be further explored.
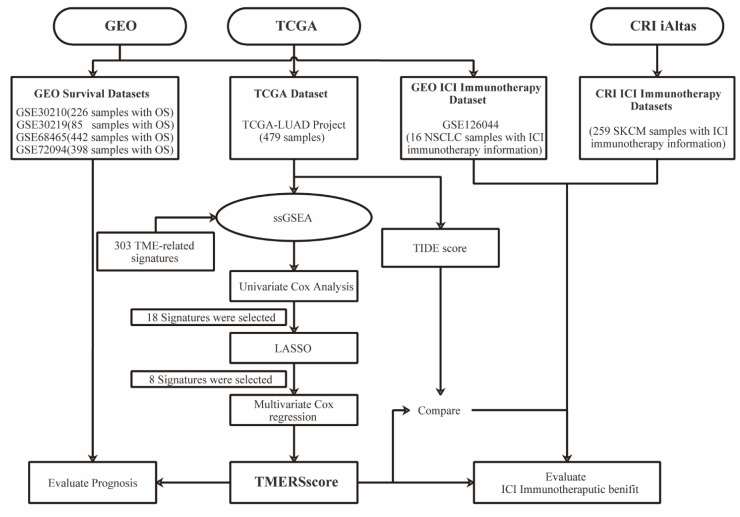
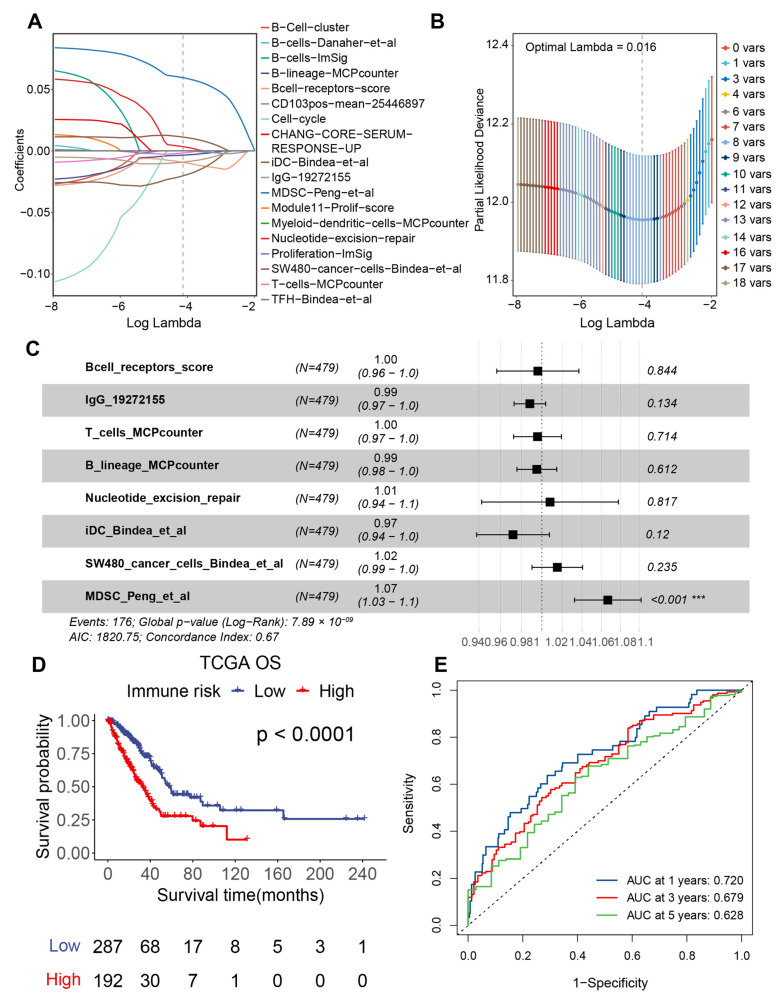
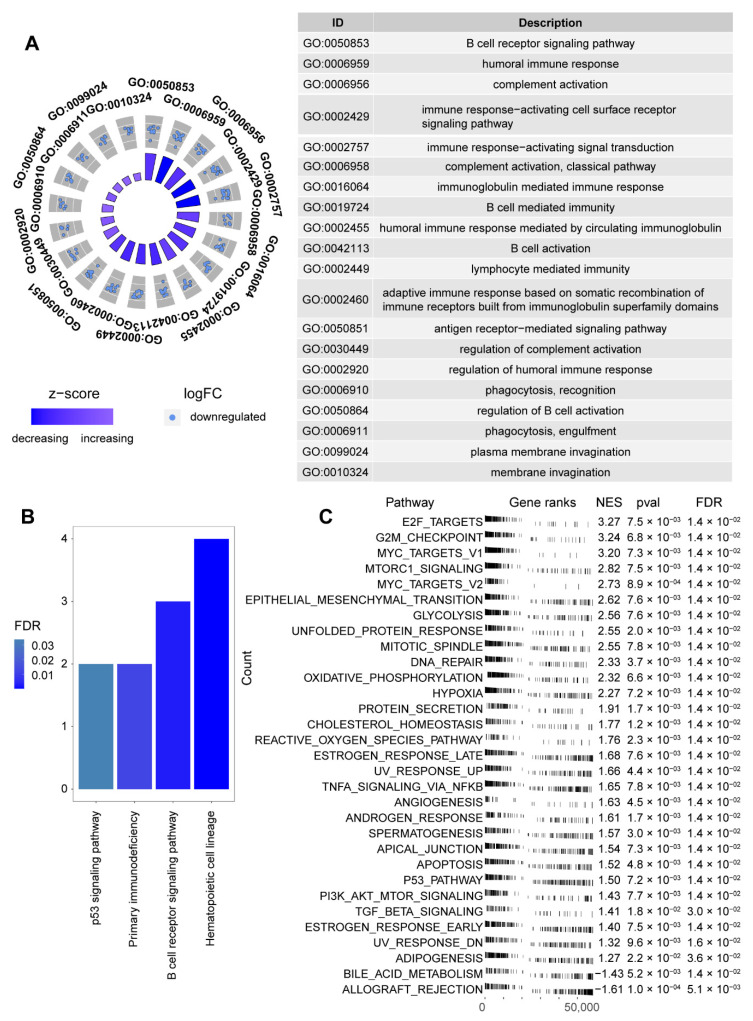
Materials and methods: Gene expression files and clinical information of 1630 LUAD samples and 275 samples with immunotherapy information from different databases such as The Cancer Genome Atlas (TCGA), Gene Expression Omnibus (GEO) and Cancer Research Institute (CRI) iAtlas were downloaded and analyzed. Three hundred tumor microenvironment-related signatures (TMERS) based on a comprehensive collection of marker genes were quantified by single sample gene set enrichment analysis (ssGSEA), and then eight significant signatures were selected to construct the tumor microenvironment-related signature score (TMERSscore) by performing Least Absolute Shrinkage and Selection Operator (LASSO)-Cox analysis.
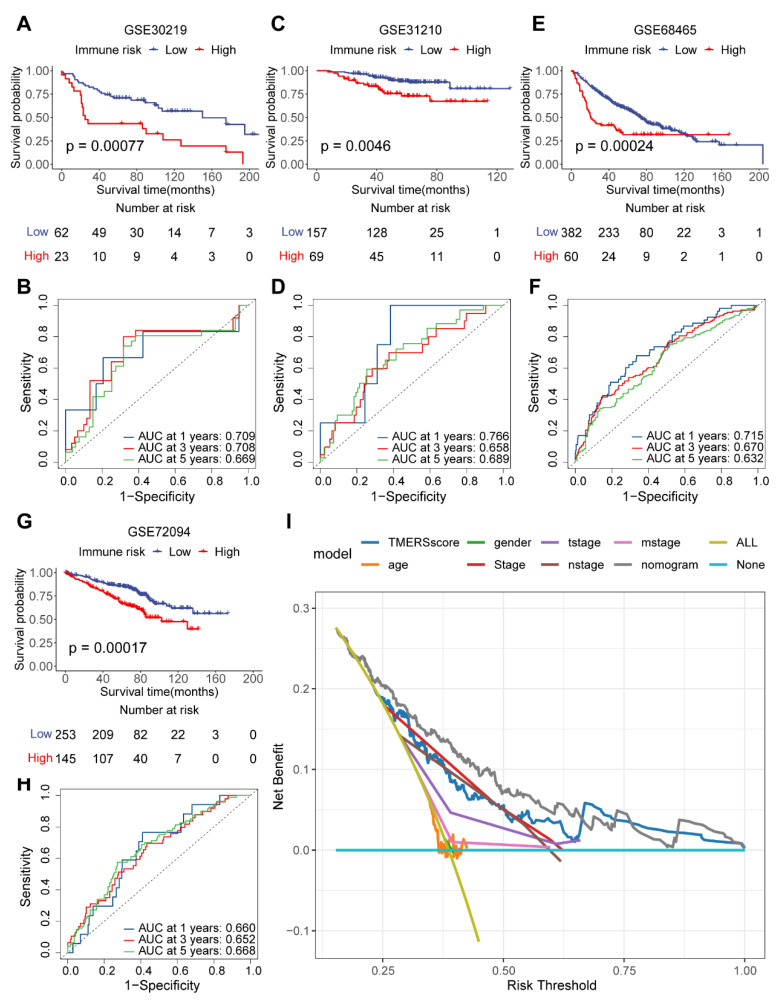
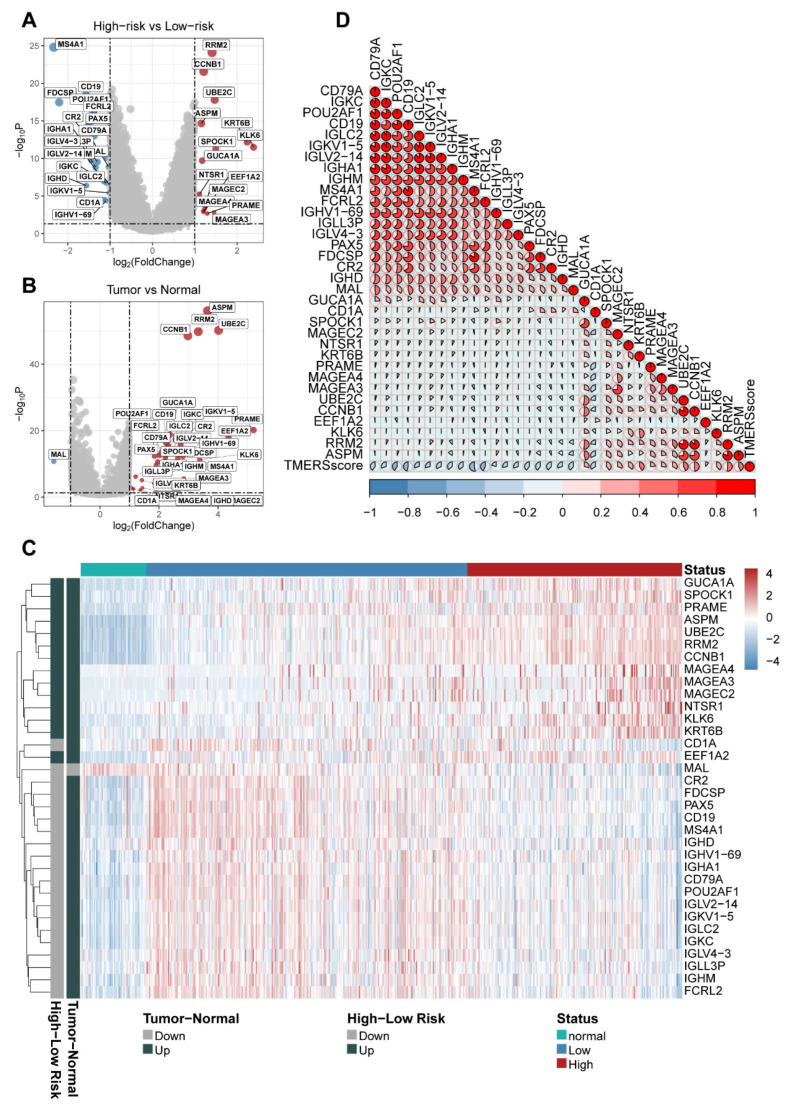
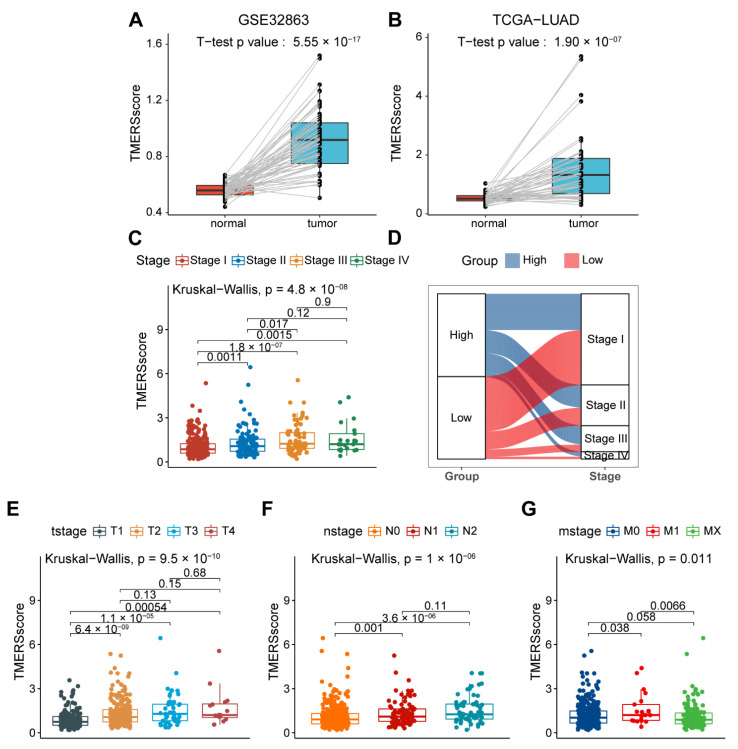
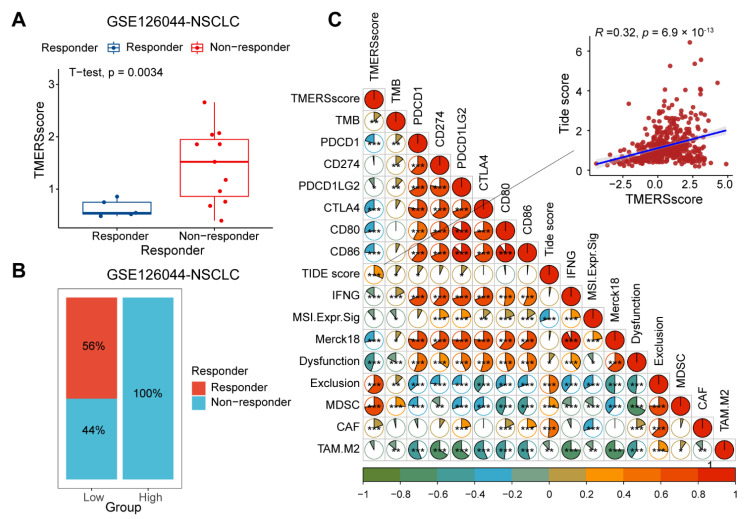
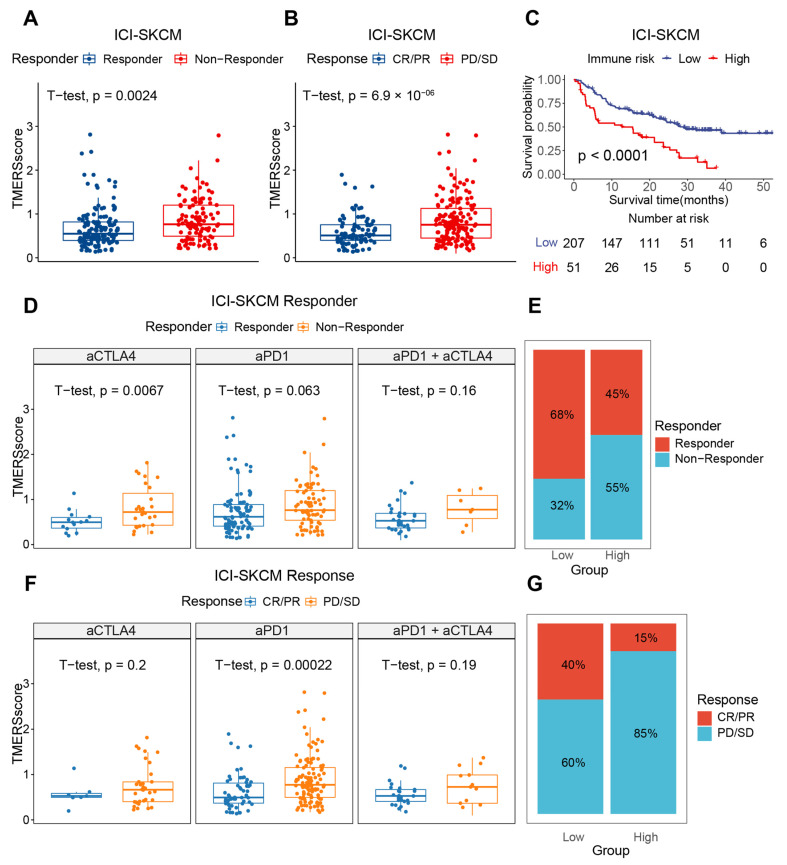
Results: In this study, we constructed a TME-based prognostic stratification model for patients with LUAD and validated it in several external datasets. Furthermore, the TMERSscore was found to be positively correlated with tumor malignancy and a high TMERSscore predicted a poor prognosis. Moreover, the TMERSscore of responders treated with Immune Checkpoint Inhibitor (ICI) therapies was significantly lower than that of non-responders, and the TMERSscore was positively correlated with the tumor immune dysfunction and exclusion (TIDE) score, implying that a low TMERSscore predicts a better response to ICI treatment and may provide independent and incremental predictive value over current biomarkers.
Conclusions: Overall, we constructed a TMERSscore that can be used for LUAD patient prognosis stratification as well as ICI therapeutic efficacy evaluation, supportive results from independent external validation sets showed its robustness and effectiveness.
Keywords: TIDE score; immune checkpoint inhibitor therapeutic response evaluation; lung adenocarcinoma; prognostic stratification; tumor microenvironment.
Conflict of interest statement
The authors declare that the research was conducted in the absence of any commercial or financial relationships that could be construed as a potential conflict of interest.
Figures
Similar articles
-
Multi-omics analysis-based clinical and functional significance of a novel prognostic and immunotherapeutic gene signature derived from amino acid metabolism pathways in lung adenocarcinoma.Front Immunol. 2024 Dec 13;15:1361992. doi: 10.3389/fimmu.2024.1361992. eCollection 2024. Front Immunol. 2024. PMID: 39735553 Free PMC article.
-
Identification of immune activation-related gene signature for predicting prognosis and immunotherapy efficacy in lung adenocarcinoma.Front Immunol. 2023 Jul 7;14:1217590. doi: 10.3389/fimmu.2023.1217590. eCollection 2023. Front Immunol. 2023. PMID: 37492563 Free PMC article.
-
Clinical Significance and Immunologic Landscape of a Five-IL(R)-Based Signature in Lung Adenocarcinoma.Front Immunol. 2021 Aug 23;12:693062. doi: 10.3389/fimmu.2021.693062. eCollection 2021. Front Immunol. 2021. PMID: 34497605 Free PMC article.
-
Development of fatty acid metabolism-related models in lung adenocarcinomaA Review.Medicine (Baltimore). 2023 Jan 6;102(1):e32542. doi: 10.1097/MD.0000000000032542. Medicine (Baltimore). 2023. PMID: 36607846 Free PMC article. Review.
-
[Advances in predictive biomarkers associated with immune checkpoint inhibitors for tumor therapy].Sheng Wu Gong Cheng Xue Bao. 2023 Apr 25;39(4):1403-1424. doi: 10.13345/j.cjb.220650. Sheng Wu Gong Cheng Xue Bao. 2023. PMID: 37154314 Review. Chinese.
Cited by
-
Prognostic models for immunotherapy in non-small cell lung cancer: A comprehensive review.Heliyon. 2024 Apr 17;10(8):e29840. doi: 10.1016/j.heliyon.2024.e29840. eCollection 2024 Apr 30. Heliyon. 2024. PMID: 38681577 Free PMC article. Review.
-
Comprehensive analysis of prognosis and tumor immune microenvironment of cuproptosis-related gene CDKN2A in lung adenocarcinoma.BMC Pulm Med. 2025 Apr 14;25(1):179. doi: 10.1186/s12890-025-03631-y. BMC Pulm Med. 2025. PMID: 40229853 Free PMC article.
-
Checkpoint Markers and Tumor Microenvironment: What Do We Know?Cancers (Basel). 2022 Aug 4;14(15):3788. doi: 10.3390/cancers14153788. Cancers (Basel). 2022. PMID: 35954452 Free PMC article.
-
The Predictive Value of Monocarboxylate Transporter 4 (MCT4) on Lung Adenocarcinoma Patients Treated with PD-1 Inhibitors.J Inflamm Res. 2024 Dec 6;17:10515-10531. doi: 10.2147/JIR.S493632. eCollection 2024. J Inflamm Res. 2024. PMID: 39659754 Free PMC article.
References
-
- Ettinger D.S., Wood D.E., Aisner D.L., Akerley W., Bauman J., Chirieac L.R., D’Amico T.A., DeCamp M.M., Dilling T.J., Dobelbower M., et al. Non-Small Cell Lung Cancer, Version 5.2017, NCCN Clinical Practice Guidelines in Oncology. J. Natl. Compr. Cancer Netw. 2017;15:504–535. doi: 10.6004/jnccn.2017.0050. - DOI - PubMed
Publication types
MeSH terms
Substances
LinkOut - more resources
Full Text Sources
Medical
