Genome-Wide Identification and Analysis of the NAC Transcription Factor Gene Family in Garden Asparagus (Asparagus officinalis)
- PMID: 35741738
- PMCID: PMC9222252
- DOI: 10.3390/genes13060976
Genome-Wide Identification and Analysis of the NAC Transcription Factor Gene Family in Garden Asparagus (Asparagus officinalis)
Abstract
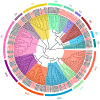
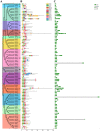
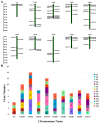
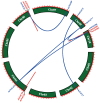
As a large plant-specific gene family, the NAC (NAM, ATAF1/2, and CUC2) transcription factor is related to plant growth, development, and response to abiotic stresses. Although the draft genome of garden asparagus (Asparagus officinalis) has been released, the genome-wide investigation of the NAC gene family is still unavailable. In this study, a total of 85 A. officinalis NAC genes were identified, and a comprehensive analysis of the gene family was performed, including physicochemical properties, phylogenetic relationship, chromosome localization, gene structure, conserved motifs, intron/exon, cis-acting elements, gene duplication, syntenic analysis, and differential gene expression analysis. The phylogenetic analysis demonstrated that there were 14 subgroups in both A. officinalis and Arabidopsis thaliana, and the genes with a similar gene structure and motif distribution were clustered in the same group. The cis-acting regulatory analysis of AoNAC genes indicated four types of cis-acting elements were present in the promoter regions, including light-responsive, hormone-responsive, plant-growth-and-development-related, and stress-responsive elements. The chromosomal localization analysis found that 81 NAC genes in A. officinalis were unevenly distributed on nine chromosomes, and the gene duplication analysis showed three pairs of tandem duplicated genes and five pairs of segmental duplications, suggesting that gene duplication is possibly associated with the amplification of the A. officinalis NAC gene family. The differential gene expression analysis revealed one and three AoNAC genes that were upregulated and downregulated under different types of salinity stress, respectively. This study provides insight into the evolution, diversity, and characterization of NAC genes in garden asparagus and will be helpful for future understanding of their biological roles and molecular mechanisms in plants.
Keywords: Asparagus officinalis; NAC transcription factor; gene duplication; gene family; genome-wide analysis; salinity stress; syntenic analysis.
Conflict of interest statement
The authors declare no conflict of interest.
Figures


Similar articles
-
Genome-wide identification and salt stress-responsive expression profiling of Aux/IAA gene family in Asparagus officinalis.BMC Plant Biol. 2025 Jun 4;25(1):759. doi: 10.1186/s12870-025-06780-8. BMC Plant Biol. 2025. PMID: 40468198 Free PMC article.
-
Genome-wide identification and comprehensive analyses of NAC transcription factor gene family and expression patterns during somatic embryogenesis in Dimocarpus longan Lour.Plant Physiol Biochem. 2020 Dec;157:169-184. doi: 10.1016/j.plaphy.2020.10.009. Epub 2020 Oct 13. Plant Physiol Biochem. 2020. PMID: 33120109
-
Genome-wide identification and comprehensive analysis heat shock transcription factor (Hsf) members in asparagus (Asparagus officinalis) at the seeding stage under abiotic stresses.Sci Rep. 2023 Oct 23;13(1):18103. doi: 10.1038/s41598-023-45322-w. Sci Rep. 2023. PMID: 37872303 Free PMC article.
-
Genome-Wide Identification and Expression Analysis of the Copper Transporter (COPT/Ctr) Gene Family in Kandelia obovata, a Typical Mangrove Plant.Int J Mol Sci. 2023 Oct 25;24(21):15579. doi: 10.3390/ijms242115579. Int J Mol Sci. 2023. PMID: 37958561 Free PMC article. Review.
-
Genome-Wide Identification, Characterization, and Expression Analysis of the Copper-Containing Amine Oxidase Gene Family in Mangrove Kandelia obovata.Int J Mol Sci. 2023 Dec 9;24(24):17312. doi: 10.3390/ijms242417312. Int J Mol Sci. 2023. PMID: 38139139 Free PMC article. Review.
Cited by
-
Genome-wide analysis of NAC transcription factors and exploration of candidate genes regulating selenium metabolism in Broussonetia papyrifera.Planta. 2024 May 16;260(1):1. doi: 10.1007/s00425-024-04438-7. Planta. 2024. PMID: 38753175
-
Genome-Wide Identification, Characterization, and Expression Analysis Related to Low-Temperature Stress of the CmGLP Gene Family in Cucumis melo L.Int J Mol Sci. 2022 Jul 25;23(15):8190. doi: 10.3390/ijms23158190. Int J Mol Sci. 2022. PMID: 35897766 Free PMC article.
-
Genome-Wide Identification of NAC Gene Family Members of Tree Peony (Paeonia suffruticosa Andrews) and Their Expression under Heat and Waterlogging Stress.Int J Mol Sci. 2024 Aug 28;25(17):9312. doi: 10.3390/ijms25179312. Int J Mol Sci. 2024. PMID: 39273263 Free PMC article.
-
Genome-wide identification and expression pattern analysis of NAC family in Taxus yunnanensis and the TyuNAC30 role in paclitaxel production.BMC Genomics. 2025 Jul 31;26(1):705. doi: 10.1186/s12864-025-11916-z. BMC Genomics. 2025. PMID: 40745264 Free PMC article.
-
Genome-wide identification and molecular evolution of NAC gene family in Dendrobium nobile.Front Plant Sci. 2023 Aug 21;14:1232804. doi: 10.3389/fpls.2023.1232804. eCollection 2023. Front Plant Sci. 2023. PMID: 37670854 Free PMC article.
References
-
- Meshi T., Iwabuchi M. Plant transcription factors. Plant Cell Physiol. 1995;36:1405–1420. - PubMed
Publication types
MeSH terms
Substances
LinkOut - more resources
Full Text Sources
Research Materials

